
ABSTRACT
Rhabdomyosarcoma (RMS) is an aggressive childhood sarcoma with two distinct subtypes, embryonal (ERMS) and alveolar (ARMS) histologies. More effective treatment is needed to improve outcomes, beyond conventional cytotoxic chemotherapy. The pan-histone deacetylase inhibitor, Suberoylanilide Hydroxamic Acid (SAHA), has shown promising efficacy in limited preclinical studies. We used a panel of human ERMS and ARMS cell lines and xenografts to evaluate the effects of SAHA as a therapeutic agent in both RMS subtypes. SAHA decreased cell viability by inhibiting S-phase progression in all cell lines tested, and induced apoptosis in all but one cell line. Molecularly, SAHA-treated cells showed activation of a DNA damage response, induction of the cell cycle inhibitors p21Cip1 and p27Kip1 and downregulation of Cyclin D1. In a subset of RMS cell lines, SAHA promoted features of cellular senescence and myogenic differentiation. Interestingly, SAHA treatment profoundly decreased protein levels of the driver fusion oncoprotein PAX3-FOXO1 in ARMS cells at a post-translational level. In vivo, SAHA-treated xenografts showed increased histone acetylation and induction of a DNA damage response, along with variable upregulation of p21Cip1 and p27Kip1. However, while the ARMS Rh41 xenograft tumor growth was significantly inhibited, there was no significant inhibition of the ERMS tumor xenograft RD. Thus, our work shows that, while SAHA is effective against ERMS and ARMS tumor cells in vitro, it has divergent in vivo effects . Together with the observed effects on the PAX3-FOXO1 fusion protein, these data suggest SAHA as a possible therapeutic agent for clinical testing in patients with fusion protein-positive RMS.
Introduction
Rhabdomyosarcoma (RMS) is an aggressive childhood sarcoma for which more effective therapies are needed. Current multimodality therapy, including chemotherapy, surgery, and/or radiation therapy, results in cure rates approaching 70%; however, patients with metastatic and recurrent disease still fare very poorly.Citation1,Citation2 RMS occurs in two major histologic subtypes, embryonal (ERMS) and alveolar (ARMS) histology. ERMS tumors are typically characterized by aberrations in cell cycle proteins such as FGFR pathway, CDKs and CDK inhibitor alterations, and IGF1 aberrations, whereas ARMS tumors are characterized by a specific fusion oncoprotein that juxtaposes the PAX3 gene (or less frequently the PAX7 gene) to the FOXO1 gene, resulting in a fusion oncoprotein PAX3/7-FOXO1.Citation3 Patients with fusion-protein positive RMS are more likely to present with invasive and metastatic disease, and tend to have a worse outcome.Citation2,Citation3
Recent studies have shown that, in both ERMS and ARMS, epigenetic dysregulation plays a role in inhibition of terminal myogenic differentiation, and in promotion of proliferative, invasive, and metastatic phenotypes.Citation4–Citation7 Genome-wide profiling of DNA methylation in RMS has shown that, while there are common epigenetic aberrations among ERMS and ARMS, they also have distinct epigenetic profiles.Citation8–Citation10 Specifically, fusion-positive (ARMS) tumors showed global decreased methylation when compared to ERMS tumors, with higher frequency of CpG sites that had low methylation, and a lower frequency of CpG that had higher methylation levels.Citation11 Indeed, an 11-gene methylation signature (ARHGEF3, DIRAS3, EMILIN1, GATA4, MYOG, NHLH1, NOS1, TGFB1, LCP1, SLC7A9, PIPTNM3) could confidently differentiate ARMS from ERMS cells.Citation11 Seki et al. evaluated a cohort of 60 RMS tumors and identified four distinct subtypes based on methylation profiles. Two subtypes corresponded to ARMS tumors, while the other 2 subtypes corresponded to ERMS tumors.Citation10 Another study evaluated a panel of cell lines and human RMS samples, and found that ARMS and ERMS subtypes clustered based on DNA methylation patterns, with more significant hypermethylation of polycomb target genes in the ARMS subtype.Citation8
This altered epigenetic profile represents a possible target for therapeutic intervention, by using regulators of DNA methylation and/or histone acetylation.Citation12,Citation13 Clinical studies evaluating the efficacy of epigenetic regulators in multiple tumor types are currently underway, including the use of histone deacetylase inhibitors (HDACi) and DNA methyltransferases inhibitors (DNMTi).Citation14–Citation20 HDACi act primarily by increasing acetylation of histones, leading to a more open chromatin configuration and allowing gene transcription, thus reversing repression of genes in cancer cells.Citation21 In addition, HDACi also lead to increased acetylation of other targets of HDACs beyond histones, including transcription factors, which likely also play a role in their effects on cancer cells.Citation22 Suberoylanilide Hydroxamic Acid (SAHA) is a pan-histone deacetylase inhibitor that has gained FDA approval for treatment of refractory cutaneous T-cell lymphoma, and has demonstrated activity in multiple tumor types.Citation23–Citation25 Previous limited studies have demonstrated that SAHA shows promising effects on cessation of RMS growth in preclinical models.Citation26–Citation29 In this study, we evaluated the effect of SAHA on a panel of RMS cells in culture, and in xenografts in immunocompromised mice. We describe specific differential effects of SAHA on ERMS and ARMS cells, and we demonstrate an effect of SAHA on downregulation of the PAX3-FOXO1 fusion oncoprotein in ARMS.
Results
SAHA treatment decreases ERMS and ARMS cell viability by inhibiting cell cycle progression, and in most cases it also induces apoptosis
To evaluate the effect of SAHA treatment on RMS cells, we used a panel of well-characterized RMS human cell lines, of which three had been derived from ERMS tumors (JR1, RD and Rh36) and two from ARMS tumors (Rh30 and Rh41).Citation30 A treatment concentration of 1 µM of SAHA was chosen because it is an achievable level as shown in adultCitation25,Citation31,Citation32 and pediatricCitation33,Citation34 pharmacokinetic studies.
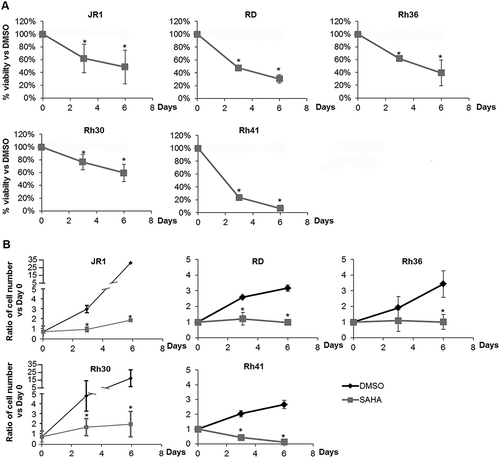
Treatment of all 5 cell lines with 1 µM SAHA significantly inhibited cell viability, shown by MTT assay at both 3 and 6 days after treatment, with increasing efficacy in a time-dependent manner (). The results were also verified by cell accumulation assay (counting total number of viable cells after trypan-blue exclusion of dead cells), showing a significant decrease in total number of cells in all tested cell lines after SAHA treatment, as compared to vehicle-treated condition ().
Figure 1. SAHA decreases RMS cell viability and accumulation. (A) MTT assay assessing viability of ERMS (JR1, RD and Rh36) and ARMS (Rh30 and Rh41) cells in response to 1 μM SAHA, compared to vehicle-treated condition (0.01% DMSO). (B) Total number of RMS cells at the specified timepoints after treatment with 1 μM SAHA compared to vehicle-treated controls (0.01% DMSO). Each point represents the mean of at least 3 experiments. Bars represent standard deviation. Asterisks denote a statistically significant difference (p-value < 0.05).
To determine whether the reduction in cell viability induced by SAHA treatment was associated with cell cycle perturbation, we assessed S-phase progression by BrdU incorporation assay. SAHA treatment resulted in decreased BrdU incorporation into DNA in all RMS cell lines, assessed at 48 hours after SAHA treatment ().
Figure 2. SAHA treatment inhibits cell cycle progression and induces apoptosis in RMS cells. (A) Percentage of BrdU-positive cells in the indicated RMS cell lines at 48 hours after treatment with 1 μM SAHA compared to vehicle-treated controls (0.01% DMSO). Each value represents the mean number counted in at least 5 fields, and is the mean of at least 3 independent experiments. (B) Percentage of TUNEL-positive cells in the indicated RMS cell lines at 48 hours after treatment with 1 μM SAHA compared to vehicle (0.01% DMSO). Each value is representative of at least 3 independent experiments, each done in duplicate. Bars represent standard deviation. Asterisks denote a statistically significant difference (p-value < 0.05).
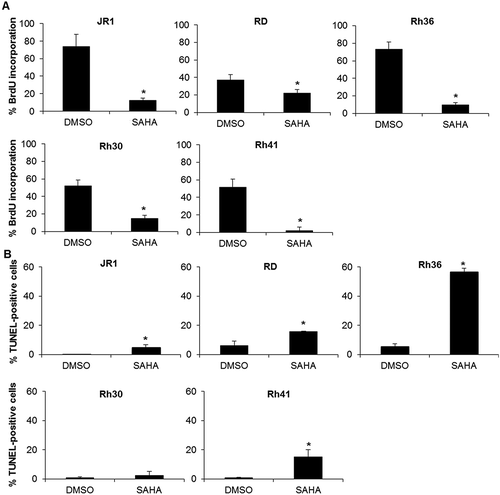
Using TUNEL assay, we found that SAHA treatment also significantly induced apoptosis at 48 hours of treatment in 4 of the 5 cell lines ().
As expected, SAHA treatment induced an increase in acetylation of Histone 4 in all treated cell lines (). In view of the prior implication of the cell cycle proteins p21CipCitation1, p27KipCitation1, and Cyclin D1 in the cell cycle arrest induced by SAHA,Citation29,Citation35 we evaluated their expression levels in treated RMS cells. We found that SAHA treatment resulted in increased expression of p21CipCitation1 in all 5 cell lines (, C), and an increase in p27KipCitation1 in 3 of the 5 cell lines (, C). We also observed a decrease in CDK2 activity in two cell lines evidenced by decrease in phosphorylation of its target Histone 1 (, C). SAHA treatment also decreased levels of Cyclin D1 protein in 3 cell lines ().
Figure 3. SAHA induces cell cycle inhibitors and a DNA damage response in RMS cells. Western blot analysis of (A) acetylated histone H4 (AcH4), (B) the indicated cell cycle proteins at 48 hours after treatment with vehicle DMSO control (D) or 1 μM SAHA (S) in the indicated cell lines. (C) Histograms represent the quantification of the western blot bands in the indicated cell lines compared to GAPDH and relative to DMSO from at least 3 independent experiments. Bars represent standard deviation. Asterisks denote a statistically significant difference (p-value < 0.05). (D) Western blot analysis of the DNA damage response protein phospho-H2AX at 48 hours after treatment with vehicle DMSO control (D) or 1 μM SAHA (S) in the indicated cell lines. GAPDH serves as a loading control for all western blots.
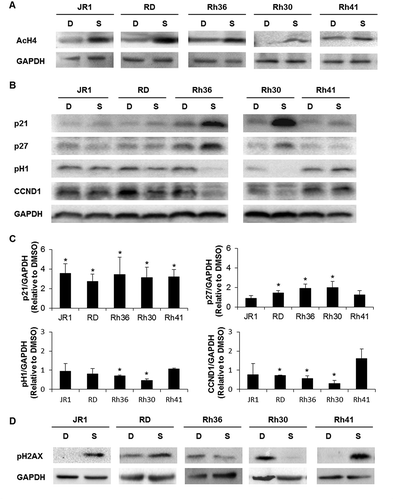
Since the DNA damage response (DDR) is a well-known mediator of apoptosis,Citation36 and has been reported to be induced by SAHA in other studies,Citation37 we next evaluated SAHA-treated RMS cells for DDR pathway activation. Assessing phosphorylation of Histone H2AX as a marker of DNA damage, we found an increase in pH2AX in JR1, RD, and Rh41 cells ().
Thus, we conclude that SAHA reproducibly induced expression of the tumor suppressor p21CipCitation1 and effectively inhibited S-phase entry in all RMS cells, suggesting a central role for this cell cycle protein in mediating SAHA effects on proliferation. Notable effects on p27KipCitation1 and Cyclin D1 levels in 3 of the 5 cell lines (RD, Rh36, and Rh30) suggest that these proteins might also play a role, and that SAHA promotes G1 cell cycle arrest in this setting. Although SAHA showed a major apoptotic response in Rh36, a modest response in RD and Rh41, and a minimal response in JR1 and Rh30, this did not correlate with the observed induction of the DDR, which was noted in 3 cell lines (JR1, RD, and Rh41), suggesting a limited role of the DDR in mediating the apoptotic effects of SAHA in this setting.
SAHA induces changes in cell morphology in all RMS cell lines, with a subset showing features of cellular senescence and/or myogenic differentiation
We noted that SAHA treatment induced morphologic alteration of RMS cells at both days 2 and 6 after treatment, and these effects were evident in all the tested cell lines (, B). Specifically, we noted an increase in elongated and fused cells (arrows in , B), and flattened cell morphology (arrowheads in , B). We therefore investigated whether SAHA may be inducing senescence (evidenced by the flattened cell morphology) or myogenic differentiation (evidenced by the elongated and fused morphology).
Figure 4. SAHA treatment results in morphologic changes in RMS cells, with a subset showing features of cellular senescence and differentiation. Representative images of RMS cells as observed by light microscopy after (A) 2 and (B) 6 days of treatment with 1 μM SAHA or vehicle (0.01% DMSO), as indicated. Arrowheads indicate flattened cells and arrows indicate elongated and fused morphology. (C) Representative senescence-associated beta-galactosidase (SABG) staining at 6 days of treatment with 1 μM SAHA or control vehicle (0.01% DMSO), as indicated. (D) Percentage of SABG-positive cells in the indicated RMS cell lines 6 days after treatment with 1 μM SAHA compared to vehicle (0.01% DMSO). Each value represents the mean number counted in at least 5 fields, and is the mean of at least 3 independent experiments. Bars represent standard deviation. Asterisks denote a statistically significant difference (p-value < 0.05). (E) Western blot analysis of the senescence markers Lamin B1 and Dec1 in RMS cell lysates after 6 days of treatment with 1 μM SAHA (S) or control vehicle 0.01% DMSO (D), as indicated. GAPDH was used as loading control. Western blots are representative of at least 3 independent experiments. (F) qRT-PCR analysis of MyoD, MyoG and MHC mRNA levels after 48 hours of treatment with 1 μM SAHA or vehicle DMSO control. Gene expression is shown relative to expression of the housekeeping gene GAPDH. Values are representative of at least 3 independent experiments, each done in triplicate. Bars represent standard deviation. Asterisks indicate p-value < 0.05.
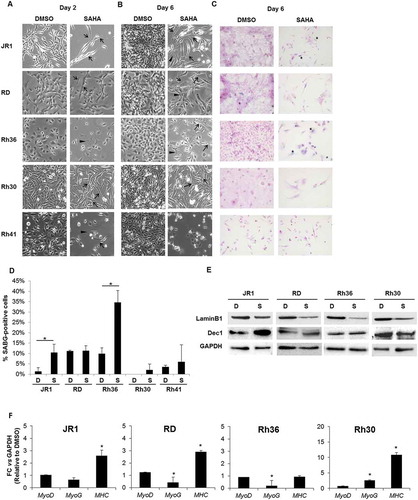
To evaluate cellular senescence, a known tumor suppressor response,Citation38 we assessed treated cells for senescence-associated beta galactosidase (SABG) activity, a marker of senescence,Citation39 and found increased staining at 6 days of treatment in 2 of the 5 cell lines, specifically JR1 and Rh36 (, D). Assessment of Lamin B1, which is decreased during senescence,Citation40 showed reduction of its protein levels at day 6 after SAHA treatment in all cell lines tested, while Dec1, another senescence marker,Citation41 was increased in 2 cell lines (JR1 and RD) as shown in . Of note, the cell line Rh41 was not tested due to the very low number of cells remaining after SAHA treatment by day 6 (see ), leading to low numbers of residual viable cells.
Thus, taking into consideration the above senescence markers, as well as p21CipCitation1 and p27KipCitation1, which are also markers of senescence,Citation42 we conclude that evidence of senescence shown by at least 4 markers was noted in JR1, RD, and Rh36 cells, suggesting senescence as a possible mechanism for SAHA-induced cell cycle arrest in RMS.
We also considered whether SAHA treatment affected myogenic differentiation. Differentiation is well-established to be closely linked to cell cycle exit in myoblasts, and indeed, induction of differentiation has been proposed as a therapeutic strategy to induce RMS cells to exit the cell cycle.Citation3 We analyzed treated cells for expression of the early myogenic transcription factors MyoD and myogenin (MyoG), and the late myogenic marker Myosin Heavy Chain (MHC). At an mRNA level, we found that levels of MyoD were unchanged, while those of MyoG were slightly decreased by treatment in RD and Rh36 cell lines, and increased in Rh30 cells (). Notably, the late myogenic marker MHC was induced by SAHA treatment in 3 of the 4 tested cell lines at day 6 (), signifying that SAHA treatment can lead to enhanced late myogenic differentiation in RMS cells.
Together the above data suggests that the senescence program and myogenic differentiation program may account for pathways of SAHA-induced cell cycle arrest in RMS cells.
SAHA has lasting effects on RMS cell viability inhibition, and decreases protein levels of the PAX3-FOXO1 driver oncoprotein in ARMS cells
To determine whether the effects of SAHA treatment were reversible, we treated cells with SAHA for 6 days, then changed the media and allowed the cells to recover for an additional 6 days. For 2 of the 4 tested cell lines, removal of SAHA resulted in continued decrease in cell count, to levels similar to those continuously treated with SAHA (). In all tested cell lines, western blotting showed persistence of histone 4 acetylation 6 days after removal of SAHA treatment (). Interestingly, RD cells that recovered after drug removal still had persistent acetylation of H4, suggesting mechanisms for overcoming SAHA-induced cell cycle exit independently of its effects on H4 acetylation.
Figure 5. SAHA has prolonged effects after treatment withdrawal and decreases PAX3-FOXO1 protein levels in ARMS cells. (A) Total number of ERMS (JR1, RD and Rh36) and ARMS (Rh30) cells after withdrawal (Off treatment) or not (SAHA) of the 1 μM SAHA treatment at day 6 compared to vehicle-treated controls (0.01% DMSO). Each point represents the mean of at least 3 experiments. Bars represent standard deviation. Asterisks denote a statistically significant difference (p-value < 0.05). Western blot analysis of (B) acetylated histone H4 (AcH4) and (C) the DNA damage response protein phospho-H2AX at day 6 after treatment with 1 μM SAHA (SAHA D6 (+)) and day 12 either after withdrawal of the treatment at day 6 (SAHA D6-12 (-)) or not (SAHA D6-12 (+)) compared to vehicle DMSO control (SAHA D6 (-)) in the indicated cell lines. GAPDH serves as a loading control. (D) Western blot analysis of Pax3-FOXO1 (P3F) at 48 hours after treatment with 1 μM SAHA (S) or vehicle DMSO control (D) in the indicated cell lines; GAPDH serves as a loading control. (E) qRT-PCR analysis of PAX3-FOXO1 mRNA levels in Rh30 and Rh41 cells after 48 hours of treatment with 1 μM SAHA (S) or vehicle DMSO control (D), as indicated. Gene expression is shown relative to expression of the housekeeping gene GAPDH. Values are representative of at least 3 independent experiments, each done in triplicate. Bars represent standard deviation. Asterisks indicate p-value < 0.05.
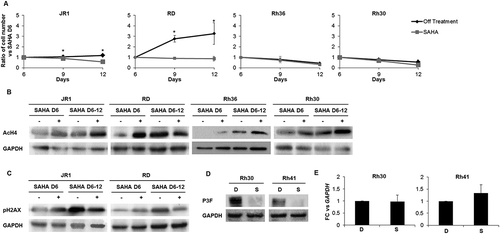
Phosphorylation of H2AX was decreased in both JR1 and RD after prolonged drug exposure (), the two cell lines where pH2AX was induced by SAHA (see ). This may reflect either repair of the DNA damage with time, or loss of cells in which the DNA damage response has occurred. Notably, cells that were allowed to recover from SAHA treatment showed an increase in pH2AX levels with time, correlating with the accumulation of cell numbers, and further supporting the latter possibility.
We also evaluated the effects of SAHA on the fusion protein PAX3-FOXO1, the oncogenic driver in ARMS tumors.Citation2,Citation3 Interestingly, SAHA treatment resulted in marked decrease in expression levels of the fusion oncoprotein in both ARMS cell lines (). This decrease seemed to occur at a post-transcriptional level, as SAHA treatment did not affect levels of the PAX3-FOXO1 mRNA fusion transcript ().
From the above data combined, we propose that SAHA treatment can lead to stable cell cycle arrest even after drug withdrawal, likely due to multiple mechanisms that depend on cellular context and include cellular senescence, differentiation, and disruption of oncogenic pathways (through decrease in oncoprotein levels) – rather than simple induction of apoptosis or transient cell cycle arrest.
SAHA treatment of human RMS xenografts in immunodeficient mice shows efficacy in reducing growth of tested ARMS but not ERMS tumors
We next evaluated the efficacy of SAHA in vivo, by treating cohorts of mice carrying xenografts of the ERMS cell line RD, and the ARMS cell line Rh41. SAHA treatment resulted in a significant decrease in tumor volume relative to control-treated mice in the ARMS (), but not the ERMS xenografts (). Analysis of treated xenografts in both ARMS and ERMS models showed increased staining for acetylated histone 3 in SAHA-treated compared to vehicle-treated xenografts (). Western blotting showed induction of the cell cycle regulator p27KipCitation1, as well as phosphorylation of H2AX, with variable effects on p21Cip1,(,. There were no clear changes in the expression levels of the late myogenic protein MHC, signifying lack of demonstrable augmentation of differentiation ().
Figure 6. SAHA treatment of human RMS xenografts inhibits ARMS tumor growth in vivo and induces cell cycle inhibitors, DNA damage response and differentiation markers in RMS xenografts. Mean tumor volumes (represented as ratio to day 1 of treatment) for (A) Rh41 ARMS and (B) RD ERMS xenografts in immune deficient mice, after treatment with vehicle (CTRL) or SAHA, as indicated. Five to seven mice were used in each cohort at each time point specified. Bars represent standard deviation. Asterisks indicate p-values < 0.05. (C) Representative images of immunohistochemical staining for acetylated Histone 3, in vehicle (DMSO) and SAHA treated RMS xenografts, as indicated. (D) Western blot analysis of xenografts of the indicated RMS tumors, that had been treated with either control vehicle (C) or SAHA (S), for the acetylated histone H4 (AcH4), the cell cycle regulators p27 and p21, phospho-H2AX, and the late myogenic marker Myosin Heavy Chain (MHC); GAPDH was used as loading control. IHC staining and western blots were done at day 21 after tumor harvest.
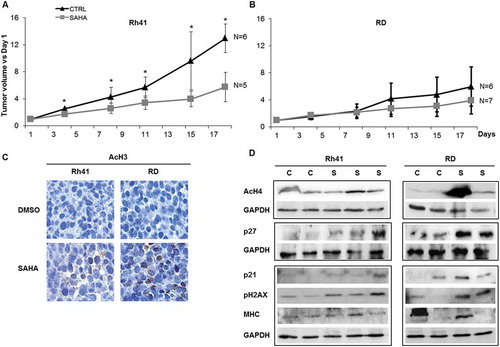
Together, these data show that, while molecular effects of SAHA are demonstrated in vivo in both ERMS RD and ARMS Rh41 tumors, its efficacy is retained against only the ARMS Rh41 xenografts.
Discussion
Epigenetic dysregulation is now well recognized to be an important mechanism for tumor initiation and progression in many types of cancer. In pediatric tumors, where the global gene mutation rate is much lower than that in adult tumors, epigenetic modulation contributes to both arrest of differentiation and developmental cellular programs, as well as acquisition of pro-tumorigenic properties.Citation43 Specifically in RMS, genomic studies have identified a relatively low mutational frequency.Citation44 In addition, more than 7% of ERMS tumors have a mutation in BCOR, which acts by interacting with histone deacetylases, further implicating epigenetic dysregulation and HDACs in ERMS tumor biology.Citation44 In ARMS, the oncogenic fusion protein PAX3-FOXO1 cooperates with epigenetic modifiers to inhibit and/or activate transcriptional programs.Citation45 Thus, epigenetic modifications, including activity of HDACs, are thought to be integral to the pathogenesis and oncogenic properties in both types of RMS.Citation46 Consequently, the prospect of treating RMS and other childhood cancers using epigenetic modifiers, alone or in combination with chemotherapy, is attractive because of the different toxicity profile as compared to cytotoxic therapies, and because it has the potential to unlock the differentiation arrest that accompanies tumorigenesis.
Previous studies in RMS cell lines have shown that SAHA can enhance the cytotoxic effect of chemotherapeutic agents,Citation26 and HDAC inhibition has been reported to induce cell death in RMS.Citation28,Citation29 One study showed that SAHA modulated the cMyc and SP transcription factors in RMS cells, in a mechanism dependent on accumulation of reactive oxygen species and independent of its effects on histone acetylation.Citation28 Another study showed that SAHA suppresses self-renewal, migratory, and growth capacity of ERMS cells, through modulation of Notch1 and Ephrin B expression, respectively.Citation27 In our current study, we sought to better understand the activity of SAHA against both ERMS and ARMS cells, by investigating its comprehensive effects on cell cycle, apoptosis, differentiation, and senescence, in a panel of ERMS and ARMS cell lines, as well as its effect on growth of in vivo xenografts.
Our results show that SAHA is effective in limiting both ERMS and ARMS cell growth in vitro, with evident effects on inhibition of cell cycle progression and induction of apoptosis. Molecularly, SAHA treatment led to activation of the DNA damage response, induction of p21Cip1 and p27Kip1, and downregulation of Cyclin D1, although seen to variable extents across the 5 cell lines. This is somewhat similar to what has been described in other studies, where HDAC-inhibition was found to induce p21Cip1 expression in 2 RMS cell lines,Citation29 and decrease Cyclin D1 and increase p21Cip1 and p27Kip1 in neuroblastoma.Citation47 Similarly, in uterine sarcoma, SAHA treatment also induces p21Cip1 as well as apoptosis.Citation48 Thus, downregulation of Cyclin D1, upregulation of the tumor suppressors p21Cip1 and p27Kip1, and induction of a DNA damage response, seem to be common mechanisms for SAHA effects on cell cycle inhibition and promotion of apoptosis in solid tumors, including RMS.
Importantly, our work shows that the cell cycle inhibitory effects of SAHA lasted even several days after cessation of exposure of tumor cells to the drug, suggesting permanent cell cycle exit. It is likely that different molecular mechanisms contribute to this prolonged cell cycle arrest depending on the cellular context of the cancer subtype, as we observed features of a senescence phenotype in three RMS cell lines, while augmentation of differentiation was also noted in three cell lines, and downregulation of the PAX3-FOXO1 oncoprotein was noted in ARMS cells. Others have recently identified HDACs as essential mediators of arrested differentiation in RMS,Citation35 and a previous study focusing on RD cells also showed that SAHA induces myogenic differentiation, primarily through modulation of Notch1 pathway.Citation27 DNA methylation and histone methylation (and decreased acetylation) have been proposed to cooperate to inhibit differentiation in RMS and other cancers.Citation49–Citation52 Indeed, knockdown of DNMT3b has been previously shown to induce myogenic differentiation in ERMS cells,Citation53 with a decrease in Cyclin D1, and induction of both p21CipCitation1 and p27KipCitation1, as we see in our studies with SAHA treatment. It would be interesting therefore to test combination therapy with both agents in RMS, where differentiation defects seem to be epigenetically regulated.Citation54–Citation57
Importantly, cell cycle arrest was reversible in 2 of the cell lines, and occurred despite persistent histone 4 acetylation in the RD cell line. This suggests that the SAHA-induced histone acetylation alone may not be sufficient for cell cycle exit. Indeed, histone acetylation induced by HDACi has previously been noted to be insufficient for persistent cell cycle arrest in dermal fibroblasts,Citation58 suggesting other important targets for HDACi in mediating cell cycle exit. Previous studies have shown that SAHA can lead to modulation of signaling pathways through direct effects on protein-protein interaction, for example by disrupting HDAC-PP1 complexes leading to activation of PP1 and ensuing disruption of AKT signaling.Citation59 In addition, SAHA can affect acetylation of non-histone proteins that play important roles in cell cycle regulation and cellular proliferation, such as the NFKb pathway,Citation60 the p53 tumor suppressor protein,Citation61 or tubulin,Citation62 as well as potentially other yet unidentified protein targets. Additional investigations should specifically focus on identifying the critical targets of SAHA in the differing cellular contexts within cancer subtypes, to best design combinatorial therapeutic interventions and stratify potential patient populations most likely to respond to such therapy.
Of particular interest was our finding that SAHA treatment reduced the protein levels of the PAX3-FOXO1 fusion oncoprotein in ARMS. This fusion protein has been implicated in many of the invasive properties of ARMS cells, and therefore the effects of SAHA on reducing its expression may have significant therapeutic implications. Notably, this decrease seemed to occur at a post-transcriptional level, as levels of the mRNA transcript of the fusion gene were unaltered. A prior study has shown that SAHA treatment leads to destabilization of mutant p53, increasing its degradation at the protein level. This was found to be due to SAHA’s effect on inhibiting HDAC6, leading to increased acetylation of HSP90, inactivating its chaperone activity which is needed to protect mutant p53 from degradation.Citation61 Whether similar mechanisms may contribute to the observed destabilization of the oncogenic fusion protein, seen in our study, needs to be further investigated.
Treatment of RMS xenografts with SAHA showed good tolerability in mice, and evident efficacy in ARMS xenografts. In vivo, SAHA treatment led to upregulation of p27KipCitation1, variable effects on p21CipCitation1, and induction of DNA damage. Unlike the in vitro findings, there was no significant effect of SAHA on ERMS xenograft growth inhibition. This may be attributable to the pharmacokinetics of SAHA, where concentrations are maintained at or above the 1μM concentration for only few hours per day with daily treatment.Citation25,Citation31–Citation34 Thus, more persistent high concentrations may be necessary to phenocopy the in vitro effect. Better mechanisms of delivering SAHA and preventing its early metabolism may therefore be needed to enhance its observed efficacy in vivo.
Alternatively, different mechanisms for the SAHA-induced cell cycle arrest in the two cell lines could also account for the differential in vivo effects. The fact that RD cells could recover from SAHA-induced cell cycle arrest despite continued histone acetylation (see -B) suggests that relevant cell cycle inhibitory processes could be disrupted irrespective of histone-independent effects of SAHA treatment in this cell line.
Additionally, the distinct differences in epigenetic dysregulation that underly ARMS tumors compared to ERMS, may also contribute to the observed more significant effect of SAHA on controlling ARMS xenograft tumor growth, by possibly leading to efficacy at lower cumulative dose exposure in ARMS tumors in vivo.Citation8,Citation9 It has been shown that the ARMS-specific PAX3-FOXO1 fusion oncoprotein interacts with epigenetic modifiers to co-regulate a large proportion of its targets, influencing cellular processes such as differentiation, cell survival, and proliferation.Citation7 Thus, the fusion oncoprotein-positive ARMS tumors may be more sensitive to epigenetic modification as a therapeutic intervention. Knowing that fusion oncoprotein-positive RMS is less common than fusion oncoprotein-negative tumors, it will be important to consider this difference during clinical trial design, to specifically study this agent for treatment of patients with the ARMS subtype. Future work will need to focus on identification of the reasons underlying such differential effects of SAHA in vivo, which may inform appropriate combination therapies for the different tumor contexts.
Material and methods
Cell lines and culture
Human RMS cell lines JR1, Rh30, Rh36 and Rh41 were generously donated by Dr. Peter Houghton (Columbus, OH), and have been previously described.Citation30 The RD cell line was purchased from ATCC (Manassas, VA). JR1, Rh41, RD and Rh30 cells were cultured in Dulbecco’s modified Eagle’s medium (DMEM, Sigma, St. Louis, MO); Rh36 were cultured in RPMI-1640 medium. Both media were supplemented with 10% fetal bovine serum (FBS), 1% L-glutamine and 1% penicillin/streptomycin (all from Sigma). All human RMS cell lines were cultured in a humidified incubator at 37 °C, with 21% O2 and 5% CO2. Suberoylanilide Hydroxamic Acid (SAHA) (LC Laboratories, Woburn, MA) was dissolved in DMSO, stored at −80°C, and diluted to the final concentrations as specified.
Cell viability, cell cycle, apoptosis, and senescence assays
Cells were treated with 1 µM SAHA or equivalent volume of vehicle (DMSO), and then harvested at the specified time points for analysis. Each study was performed using triplicate samples, and repeated at least 3 times. Cell viability was assessed using MTT assay (Roche Diagnostics, Indianapolis, IN) according to the manufacturer’s instructions. For cell accumulation, cells were counted using hemocytometer after labeling by trypan blue (Sigma). For bromodeoxyuridine (BrdU) incorporation assay, BrdU (Sigma) was added at a concentration of 30 µM for two hours before harvesting. After fixation, cells were treated with 2 N HCL, neutralized by borate buffer and incubated with anti-BrdU primary antibody (Santa Cruz Biotechnology, Santa Cruz, CA) followed by CyTM3-conjugated secondary antibody (Jackson ImmunoResearch Laboratories, West Grove, PA). Stained cells were mounted with 4ʹ6’-diamidino-2-phenylindole (DAPI, vector Laboratories, CA), placed under coverslips and visualized by immunofluorescence microscope. Positive cells were manually counted from at least 5 representative fields at 200x magnification, and normalized to the total number of DAPI-positive cells. Terminal deoxy-transferase (TdT)-mediated deoxyuridine triphosphate (dUTP) nick-end labeling (TUNEL) assay (Roche Diagnostics) was performed as per manufacturer’s instructions and analyzed using the BD FACSAriaTM III cell sorter. Senescence-associated beta-galactosidase (SABG) staining was performed as described in our previous studies.Citation63
Immunoblotting
Proteins were extracted from tissues and cells using Universal or RIPA Lysis Buffer supplemented with 50 mM NaF (Sigma), 1mM sodium orthovanadate (Sigma) and protease inhibitor cocktail (Roche Diagnostics). Proteins were quantified by Bradford assay (Bio-Rad, Richmond, CA), resolved on 8% or 12% SDS-PAGE gel, and transferred onto polyvinylidene difluoride membranes (Bio-Rad). Membranes were probed with primary antibodies against acetylated histone H4 (AcH4) (Active Motif, Carlsbad, CA), FOXO1 (Cell Signaling Technology, Beverly, MA), p21CipCitation1, p27KipCitation1, Cyclin D1 (CCND1), myosin heavy chain (MHC), phospho-H2AX, phospho-Histone 1 (pH1), GAPDH (all from Santa Cruz Biotechnology), then detected with species-specific horseradish peroxidase-coupled secondary antibodies (Santa Cruz Biotechnology), and visualized by enhanced chemiluminescence (Roche) upon detection on X-ray films (Kodak) or Clarity Western ECL Substrate (Bio-Rad) on Chemidoc machine (Bio-Rad). Bands from at least 3 independent experiments were quantified using ImageJ software.
Real-time quantitative PCR (rt-qpcr)
RNA was extracted using TRIzol reagent (Ambion, Austin, TX) according to the manufacturer’s instructions, followed by treatment with DNase I (Qiagen, Valencia, CA). cDNA synthesis was performed using RevertAid first strand cDNA synthesis kit (Fermentas, Vilnius, Lithuania). RT-qPCR was performed using the iQSYBR Green Supermix kit using a CFX96 system (Bio-Rad). Amplification was done using the following primers: GAPDH: Forward 5ʹ-TGGTGCTCAGTGTAGCCCAG-3ʹ, Reverse 5ʹ-GGACCTGACCTGCCGTCTAG-3ʹ; PAX3-FOXO1: Forward 5ʹ-GAACCCACCATTGGCAAT-3ʹ, Reverse 5ʹ-TCTGCACACGAATGAACTTGCT-3ʹ; MyoD: Forward 5ʹ-CCGCCTGAGCAAAGTAAATGA-3ʹ, Reverse 5ʹ-GCAACCGCTGGTTTGGATT-3ʹ; MyoG: Forward 5ʹ-GGTGCCCAGCGAATGC-3ʹ, Reverse 5ʹ-TGATGCTGTCCACGATGGA-3ʹ; MHC: Forward 5ʹ-CTGATGCCATGGAATGAC-3ʹ, Reverse 5ʹ- CCCTATGCTTTATTTCCTTTGC-3ʹ. RT-qPCR conditions were as follows: 95°C for 15 min. for denaturation, 95°C for 15 sec., 72°C for 1 min. and annealing at 55°C or 60°C for 40 cycles.
In vivo studies
All mouse studies were approved by the Institutional Care and Use Committee (IACUC) at the American University of Beirut, and all studies followed the IACUC-approved guidelines. RD xenografts were subcutaneously generated as previously described.Citation64 Xenografts of Rh41 tumors were generously donated by Dr. Peter Houghton, and were serially passed in vivo. Animals received either vehicle (DMSO) or SAHA (125 mg/kg/day), by intraperitoneal injection for 5 consecutive days per week.Citation65 Treatment was initiated once tumor volume exceeded 350 mmCitation3; tumor size was assessed twice weekly by measurement with a Vernier caliper. Tumor volume was calculated using the formula [length x (width)Citation2]/2. Mice were euthanized at the specified time points for tumor harvesting.
For Immunohistochemistry (IHC) assays, tumors were fixed in 4% paraformaldehyde, embedded in paraffin and sectioned at 4 µm. Antigen retrieval was performed in a steamer using citrate antigen retrieval buffer (pH 6.0). Staining was performed using anti-AcH3 (Santa Cruz). ABC Elite Kit (Vector Labs, Burlingame, CA) was used for detection by biotinylated secondary antibody and streptavidin conjugated to horseradish peroxidase followed by DAB substrate (DAKO, Glostrup, Denmark).
Both IHC staining and western blots were done on the tumors harvested at the end of the experiment (day 21).
Statistical analysis and imaging
All in vitro experiments were performed in biological and technical triplicates unless mentioned otherwise. Values represent the means ± standard deviation. Differences between means were analyzed using two-tailed Student’s t-test, with a p-value < 0.05 considered statistically significant. Digital photomicrographs were obtained using a Zeiss AxioObserver Z1 microscope. Composite images were constructed using Photoshop CS6 software (Adobe Systems)
Disclosure of interest
The authors report no conflict of interest.
Acknowledgments
The authors thank Dr. Peter Houghton for providing the RMS cell lines, and the core facilities at the American University of Beirut Faculty of Medicine for the infrastructure and support.
Additional information
Funding
References
- Breitfeld PP, Meyer WH. Rhabdomyosarcoma: new windows of opportunity. Oncologist. 2005;10:518–527. doi: 10.1634/theoncologist.10-7-518.
- Huh WW, Skapek SX. Childhood rhabdomyosarcoma: new insight on biology and treatment. Curr Oncol Rep. 2010;12:402–410. doi: 10.1007/s11912-010-0130-3.
- Saab R, Spunt SL, Skapek SX. Myogenesis and rhabdomyosarcoma the Jekyll and Hyde of skeletal muscle. Curr Top Dev Biol. 2011;94:197–234. doi: 10.1016/b978-0-12-380916-2.00007-3.
- Tombolan L, Poli E, Martini P, Zin A, Millino C, Pacchioni B, Celegato B, Bisogno G, Romualdi C, Rosolen A. Global DNA methylation profiling uncovers distinct methylation patterns of protocadherin alpha4 in metastatic and non-metastatic rhabdomyosarcoma. BMC Cancer. 2016;16:886. doi:10.1186/s12885-016-2936-3.
- Ramaglia M, D'Angelo V, Iannotta A, Di Pinto D, Pota E, Affinita MC, Donofrio V, Errico ME, Lombardi A, Indolfi C. High EZH2 expression is correlated to metastatic disease in pediatric soft tissue sarcomas. Cancer Cell Int. 2016;16:59. doi:10.1186/s12935-016-0338-x.
- Vella S, Pomella S, Leoncini PP, Colletti M, Conti B, Marquez VE, Strillacci A, Roma J, Gallego S, Milano GM. MicroRNA-101 is repressed by EZH2 and its restoration inhibits tumorigenic features in embryonal rhabdomyosarcoma. Clin Epigenetics. 2015;7:82.doi:10.1186/s13148-015-0107-z.
- Böhm M, Wachtel M, Marques JG, Streiff N, Laubscher D, Nanni P, Mamchaoui K, Santoro R, Schäfer BW. Helicase CHD4 is an epigenetic coregulator of PAX3-FOXO1 in alveolar rhabdomyosarcoma. J Clin Invest. 2016;126:4237–4249. doi:10.1172/JCI85057.
- Mahoney SE, Yao Z, Keyes CC, Tapscott SJ, Diede SJ. Genome-wide DNA methylation studies suggest distinct DNA methylation patterns in pediatric embryonal and alveolar rhabdomyosarcomas. Epigenetics. 2012;7:400–408. doi: 10.4161/epi.19463.
- Sun X, Guo W, Shen JK, Mankin HJ, Hornicek FJ, Duan Z. Rhabdomyosarcoma: advances in Molecular and Cellular Biology. Sarcoma. 2015:232010. doi:10.1155/2015/232010.
- Seki M, Nishimura R, Yoshida K, Shimamura T, Shiraishi Y, Sato Y, Kato M, Chiba K, Tanaka H, Hoshino N. Integrated genetic and epigenetic analysis defines novel molecular subgroups in rhabdomyosarcoma. Nat Commun. 2015;6:7557. doi:10.1038/ncomms8557.
- Sun W, Chatterjee B, Wang Y, Stevenson HS, Edelman DC, Meltzer PS, Barr FG. Distinct methylation profiles characterize fusion-positive and fusion-negative rhabdomyosarcoma. Mod Pathol. 2015;28(9):1214–1224. doi:10.1038/modpathol.2015.82.
- Minucci S, Pelicci PG. Histone deacetylase inhibitors and the promise of epigenetic (and more) treatments for cancer. Nat Rev Cancer. 2006;6(38–51). doi: 10.1038/nrc1779.
- Furchert SE, Lanvers-Kaminsky C, Juürgens H, Jung M, Loidl A, Frühwald MC. Inhibitors of histone deacetylases as potential therapeutic tools for high-risk embryonal tumors of the nervous system of childhood. Int J Cancer. 2007;120(8):1787–1794. doi:10.1002/ijc.22401.
- Dokmanovic M, Marks PA. Prospects: histone deacetylase inhibitors. J Cell Biochem. 2005;96:293–304. doi: 10.1002/jcb.20532.
- Rasheed WK, Johnstone RW, Prince HM. Histone deacetylase inhibitors in cancer therapy. Expert Opin Investig Drugs. 2007;16:659–678. doi: 10.1517/13543784.16.5.659.
- Morera L, Lübbert M, Jung M. Targeting histone methyltransferases and demethylases in clinical trials for cancer therapy. Clin Epigenetics. 2016;8:57. doi: 10.1186/s13148-016-0223-4.
- McCabe MT, Mohammad HP, Barbash O, Kruger RG. Targeting Histone Methylation in Cancer. Cancer J. 2017;23(292–301). doi: 10.1097/PPO.0000000000000283.
- Faleiro I, Leão R, Binnie A, de Mello RA, Maia AT, Castelo-Branco P. Epigenetic therapy in urologic cancers: an update on clinical trials. Oncotarget. 2017;8(7):12484–12500. doi:10.18632/oncotarget.14226.
- Damaskos C, Garmpis N, Valsami S, Kontos M, Spartalis E, Kalampokas T, Kalampokas E, Athanasiou A, Moris D, Daskalopoulou A. Histone Deacetylase Inhibitors: an Attractive Therapeutic Strategy Against Breast Cancer. Anticancer Res. 2017;37(1):35–46. doi:10.21873/anticanres.11286.
- Tang F, Choy E, Tu C, Hornicek F, Duan Z. Therapeutic applications of histone deacetylase inhibitors in sarcoma. Cancer Treat Rev. 2017;59:33–45. doi: 10.1016/j.ctrv.2017.06.006.
- Bannister AJ, Miska EA. Regulation of gene expression by transcription factor acetylation. Cell Mol Life Sci. 57;2000:1184–1192.
- Johnstone RW. Histone-deacetylase inhibitors: novel drugs for the treatment of cancer. Nat Rev Drug Discov. 2002;1:287–299. doi: 10.1038/nrd772.
- Galanis E, Jaeckle KA, Maurer MJ, Reid JM, Ames MM, Hardwick JS, Reilly JF, Loboda A, Nebozhyn M, Fantin VR. Phase II trial of vorinostat in recurrent glioblastoma multiforme: a north central cancer treatment group study. J Clinical Oncology: Official Journal Am Soc Clin Oncol. 2009;27(12):2052–2058. doi:10.1200/JCO.2008.19.0694.
- Marks PA. Discovery and development of SAHA as an anticancer agent. Oncogene. 2007;26:1351–1356. doi: 10.1038/sj.onc.1210204.
- Fakih MG, Fetterly G, Egorin MJ, Muindi JR, Espinoza-Delgado I, Zwiebel JA, Litwin A, Holleran JL, Wang K, Diasio RB. A phase I, pharmacokinetic, and pharmacodynamic study of two schedules of vorinostat in combination with 5-fluorouracil and leucovorin in patients with refractory solid tumors. Clin Cancer Res. 2010;16(14):3786-3794. doi:10.1158/1078-0432.CCR-10-0547.
- Heinicke U, Fulda S. Chemosensitization of rhabdomyosarcoma cells by the histone deacetylase inhibitor SAHA. Cancer Lett. 2014;351:50–58. doi: 10.1016/j.canlet.2014.04.021.
- Vleeshouwer-Neumann T, Phelps M, Bammler TK, MacDonald JW, Jenkins I, Chen EY. Histone Deacetylase Inhibitors Antagonize Distinct Pathways to Suppress Tumorigenesis of Embryonal Rhabdomyosarcoma. PloS one. 2015;10(12):e0144320. doi:10.1371/journal.pone.0144320.
- Hedrick E, Crose L, Linardic CM, Safe S. Histone Deacetylase Inhibitors Inhibit Rhabdomyosarcoma by Reactive Oxygen Species-Dependent Targeting of Specificity Protein Transcription Factors. Mol Cancer Ther. 2015;14:2143–2153. doi: 10.1158/1535-7163.MCT-15-0148.
- Kutko MC, Glick RD, Butler LM, Coffey DC, Rifkind RA, Marks PA, Richon VM, LaQuaglia MP. Histone deacetylase inhibitors induce growth suppression and cell death in human rhabdomyosarcoma in vitro. Clin Cancer Res. 2003;9(15):5749–5755
- Hinson AR, Jones R, Crose LE, Belyea BC, Barr FG, Linardic CM. Human rhabdomyosarcoma cell lines for rhabdomyosarcoma research: utility and pitfalls. Front Oncol. 2013;3:(183. doi:10.3389/fonc.2013.00183.
- Ramalingam SS, Parise RA, Ramanathan RK, Ramananthan RK, Lagattuta TF, Musguire LA, Stoller RG, Potter DM, Argiris AE, Zwiebel JA. Phase I and pharmacokinetic study of vorinostat, a histone deacetylase inhibitor, in combination with carboplatin and paclitaxel for advanced solid malignancies. Clin Cancer Res. 2007;13(12):3605–3610. doi:10.1158/1078-0432.CCR-07-0162.
- Fujiwara Y, Yamamoto N, Yamada Y, Yamada K, Otsuki T, Kanazu S, Iwasa T, Hardwick JS, Tamura T. Phase I and pharmacokinetic study of vorinostat (suberoylanilide hydroxamic acid) in Japanese patients with solid tumors. Cancer Sci. 2009;100(9):1728–1734. doi:10.1111/j.1349-7006.2009.01237.x.
- Muscal JA, Scorsone KA, Zhang L, Ecsedy JA, Berg SL. Additive effects of vorinostat and MLN8237 in pediatric leukemia, medulloblastoma, and neuroblastoma cell lines. Invest New Drugs. 2013;31:39–45. doi: 10.1007/s10637-012-9831-9.
- Hummel TR, Wagner L, Ahern C, Fouladi M, Reid JM, McGovern RM, Ames MM, Gilbertson RJ, Horton T, Ingle AM. A pediatric phase 1 trial of vorinostat and temozolomide in relapsed or refractory primary brain or spinal cord tumors: a Children’s Oncology Group phase 1 consortium study. Pediatric Blood & Cancer. 2013;60(9):1452–1457. doi:10.1002/pbc.24541.
- Phelps MP, Bailey JN, Vleeshouwer-Neumann T, Chen EY. CRISPR screen identifies the NCOR/HDAC3 complex as a major suppressor of differentiation in rhabdomyosarcoma. Proc Natl Acad Sci U S A. 2016;113:15090–15095. doi: 10.1073/pnas.1610270114.
- Roos WP, Kaina B. DNA damage-induced cell death: from specific DNA lesions to the DNA damage response and apoptosis. Cancer Letters. 2013;332:237–248. doi: 10.1016/j.canlet.2012.01.007.
- Chun P. Histone deacetylase inhibitors in hematological malignancies and solid tumors. Arch Pharm Res. 2015;38:933–949. doi: 10.1007/s12272-015-0571-1.
- Ewald JA, Desotelle JA, Wilding G, Jarrard DF. Therapy-induced senescence in cancer. Journal of the National Cancer Institute. 2010;102:1536–1546. doi: 10.1093/jnci/djq364.
- Dimri GP, Lee X, Basile G, Acosta M, Scott G, Roskelley C, Medrano EE, Linskens M, Rubelj I, Pereira-Smith O. A biomarker that identifies senescent human cells in culture and in aging skin in vivo. Proc Natl Acad Sci U S A. 1995;92(20):9363–9367.
- Freund A, Laberge RM, Demaria M, Lamin CJ. B1 loss is a senescence-associated biomarker. Mol Biol Cell. 2012;23:2066–2075. doi: 10.1091/mbc.E11-10-0884.
- Qian Y, Zhang J, Yan B, Chen X. DEC1, a basic helix-loop-helix transcription factor and a novel target gene of the p53 family, mediates p53-dependent premature senescence. J Biol Chem. 2008;283:2896–2905. doi: 10.1074/jbc.M708624200.
- Saab R. Cellular senescence: many roads, one final destination. Scientific World Journal. 2010;10:727–741. doi: 10.1100/tsw.2010.68.
- Lawlor ER, Thiele CJ. Epigenetic changes in pediatric solid tumors: promising new targets. Clin Cancer Res. 2012;18:2768–2779. doi: 10.1158/1078-0432.CCR-11-1921.
- Shern JF, Chen L, Chmielecki J, Wei JS, Patidar R, Rosenberg M, Ambrogio L, Auclair D, Wang J, Song, YK. Comprehensive genomic analysis of rhabdomyosarcoma reveals a landscape of alterations affecting a common genetic axis in fusion-positive and fusion-negative tumors. Cancer Discov. 2014;4(2):216–231. doi:10.1158/2159-8290.CD-13-0639.
- Gryder BE, Yohe ME, Chou HC, Zhang X, Marques J, Wachtel M, Schaefer B, Sen N, Song YK, Gualtieri A. PAX3-FOXO1 Establishes Myogenic Super Enhancers and Confers BET Bromodomain Vulnerability. Cancer Discov. 2017. doi: 10.1158/2159-8290.CD-16-1297.
- Zhu B, Davie JK. New insights into signalling-pathway alterations in rhabdomyosarcoma. Br J Cancer. 2015;112:227–231. doi: 10.1038/bjc.2014.471.
- De Los Santos M, Martínez-Iglesias O, Aranda A. Anti-estrogenic actions of histone deacetylase inhibitors in MCF-7 breast cancer cells. Endocr Relat Cancer. 2007;14:1021–1028. doi: 10.1677/ERC-07-0144.
- Hrzenjak A, Moinfar F, Kremser ML, Strohmeier B, Petru E, Zatloukal K, Denk H. Histone deacetylase inhibitor vorinostat suppresses the growth of uterine sarcomas in vitro and in vivo. Molecular Cancer. 2010;9:49. doi:10.1186/1476-4598-9-49.
- Keller C, Guttridge DC. Mechanisms of impaired differentiation in rhabdomyosarcoma. FEBS J. 2013;280:4323–4334. doi: 10.1111/febs.12421.
- Claus R, Lübbert M. Epigenetic targets in hematopoietic malignancies. Oncogene. 2003;22:6489–6496. doi: 10.1038/sj.onc.1206814.
- Fazi F, Travaglini L, Carotti D, Palitti F, Diverio D, Alcalay M, McNamara S, Miller WH, Lo Coco F, Pelicci PG. Retinoic acid targets DNA-methyltransferases and histone deacetylases during APL blast differentiation in vitro and in vivo. Oncogene. 2005;24(11):1820–1830. doi:10.1038/sj.onc.1208286.
- Capobianco E, Mora A, La Sala D, Roberti A, Zaki N, Badidi E, Taranta M, Cinti C. Separate and combined effects of DNMT and HDAC inhibitors in treating human multi-drug resistant osteosarcoma HosDXR150 cell line. PloS one. 2014;9(4):e95596. doi:10.1371/journal.pone.0095596.
- Megiorni F, Camero S, Ceccarelli S, McDowell HP, Mannarino O, Marampon F, Pizer B, Shukla R, Pizzuti A, Marchese C. DNMT3B in vitro knocking-down is able to reverse embryonal rhabdomyosarcoma cell phenotype through inhibition of proliferation and induction of myogenic differentiation. Oncotarget. 2016;7(48):79342–79356. doi:10.18632/oncotarget.12688.
- Li ZY, Yang J, Gao X, Lu JY, Zhang Y, Wang K, Cheng MB, Wu NH, Wu Z, Shen YF. Sequential recruitment of PCAF and BRG1 contributes to myogenin activation in 12-O-tetradecanoylphorbol-13-acetate-induced early differentiation of rhabdomyosarcoma-derived cells. J Biol Chem. 2007;282(26):18872–18878. doi:10.1074/jbc.M609448200.
- Carrió E, Suelves M. DNA methylation dynamics in muscle development and disease. Front Aging Neurosci. 2015;7(19). doi: 10.3389/fnagi.2015.00019.
- Wolf S, Hagl B, Kappler R. Identification of BMP2 as an epigenetically silenced growth inhibitor in rhabdomyosarcoma. Int J Oncol. 2014;44:1727–1735. doi: 10.3892/ijo.2014.2312.
- Walters ZS, Villarejo-Balcells B, Olmos D, Buist TW, Missiaglia E, Allen R, Al-Lazikani B, Garrett MD, Blagg J, Shipley J. JARID2 is a direct target of the PAX3-FOXO1 fusion protein and inhibits myogenic differentiation of rhabdomyosarcoma cells. Oncogene. 2014;33(9):1148–1157. doi:10.1038/onc.2013.46.
- Brinkmann H, Dahler AL, Popa C, Serewko MM, Parsons PG, Gabrielli BG, Burgess AJ, Saunders NA. Histone hyperacetylation induced by histone deacetylase inhibitors is not sufficient to cause growth inhibition in human dermal fibroblasts. J Biol Chem. 2001;276(25):22491–22499. doi:10.1074/jbc.M100206200.
- Chen CS, Weng SC, Tseng PH, Lin HP. Histone acetylation-independent effect of histone deacetylase inhibitors on Akt through the reshuffling of protein phosphatase 1 complexes. J Biol Chem. 2005;280:38879–38887. doi: 10.1074/jbc.M505733200.
- Chen L, Fischle W, Verdin E, Greene WC. Duration of nuclear NF-kappaB action regulated by reversible acetylation. Science. 2001;293:1653–1657. doi: 10.1126/science.1062374.
- Li D, Marchenko ND, Moll UM. SAHA shows preferential cytotoxicity in mutant p53 cancer cells by destabilizing mutant p53 through inhibition of the HDAC6-Hsp90 chaperone axis. Cell Death Differ. 2011;18:1904–1913. doi: 10.1038/cdd.2011.71.
- Matsuyama A, Shimazu T, Sumida Y, Saito A, Yoshimatsu Y, Seigneurin-Berny D, Osada H, Komatsu Y, Nishino N, Khochbin S, et al. In vivo destabilization of dynamic microtubules by HDAC6-mediated deacetylation. EMBO J. 2002;21(24):6820–6831.
- Zalzali H, Harajly M, Abdul-Latif L, El-Chaar N, Dbaibo G, Skapek SX, Saab R. Temporally distinct roles for tumor suppressor pathways in cell cycle arrest and cellular senescence in Cyclin D1-driven tumor. Molecular Cancer. 2012;11:28. doi:10.1186/1476-4598-11-28.
- Basma H, Ghayad SE, Rammal G, Mancinelli A, Harajly M, Ghamloush F, Dweik L, El-Eit R, Zalzali H, Rabeh W. The synthetic retinoid ST1926 as a novel therapeutic agent in rhabdomyosarcoma. Int J Cancer. 2016;138(6):1528–1537. doi:10.1002/ijc.29886.
- Keshelava N, Houghton PJ, Morton CL, Lock RB, Carol H, Keir ST, Maris JM, Reynolds CP, Gorlick R, Kolb EA. Initial testing (stage 1) of vorinostat (SAHA) by the pediatric preclinical testing program. Pediatric Blood & Cancer. 2009;53(3):505–508. doi:10.1002/pbc.21988.