
ABSTRACT
Circulating tumor cells (CTCs) have been exclusively studied and served to assess the clinical outcomes of treatments and progression of cancer. Most CTC data have mainly been derived from distinct cohorts or selected tumor types. In the present study, a total of 594 blood samples from 479 cases with 19 different carcinomas and 30 healthy samples were collected and analyzed by Subtraction enrichment method combined with immunostaining-fluorescence in situ hybridization (iFISH). Non-hematopoietic cells with aneuploid chromosome 8 (more than 2 copies) were regarded as positive CTCs. The results showed that none of CTCs was found in all 30 healthy samples. The overall positive rate of CTCs was 89.0% in diagnosed cancer patients (ranging from 75.0% to 100.0%). Average number of 11, 5, 8 and 4 CTCs per 7.5 mL was observed in lung cancer, liver cancer, renal cancer and colorectal cancer, respectively. Among 19 different carcinomas, the total number of CTCs, tetraploid chromosome 8, polyploid chromosome 8, CTM (Circulating tumor microemboli) and large CTCs in patients with stage Ⅲ and Ⅳ were statistically higher than patients with stage Ⅰ and Ⅱ (P < 0.05). Furthermore, EpCAM expression was more frequently found in most CTCs than vimentin expression, confirming that these CTCs were of epithelial origin. In addition, small and large CTCs were also classified, and the expression of vimentin was mostly observed in small CTCs and CTM. Our results revealed that there are higher numbers of CTCs, tetraploid, polyploid and large CTCs in patients with stage Ⅲ and Ⅳ, indicating that the quantification of chromosome ploidy performed by SE-iFISH for CTCs might be a useful tool to predict and evaluate therapeutic efficacy as well as to monitoring disease progression.
Introduction
Circulating tumor cells (CTCs) are derived from primary or metastatic solid tumors and then enter into the peripheral blood circulation.Citation1,Citation2 Enumeration of CTCs is one of the key means of diagnosis in liquid biopsy enabling non-invasive and periodic monitoring of therapeutic outcomes for cancer patients in a real-time manner. CTCs are responsible for tumor metastasis and relapse.Citation3 The clinical significance of CTCs have been gradually identified in recent years. CTC diagnosis has been applied to rapidly assess therapeutic response (e.g. surgery, radiotherapy and chemotherapy as well as immunotherapy), predict prognosis, monitor therapeutic resistance and cancer relapse.Citation4 Detection of CTCs provides an effective tool for personalized therapy for cancer patients, offering information for the selection of precision medicine and holding significance outcomes for clinical application.
A variety of techniques for the detection of CTCs have been explored, and the sensitivity and specificity of CTC detection methods have been determined by the appropriate CTC enrichment and identification technologies.Citation5 Since CTCs have critical clinical significance it is necessary to demonstrate the feasibility and efficiency of this method to predict cancer progression and prognosis in large cohorts. Therefore, this study has focused on CTCs detection in order to study the heterogeneity of detected CTCs within different cancer phenotypes and evaluate the application feasibility of subtraction enrichment method in liquid biopsy.
Materials and methods
Patients and sample collection
A total of 594 peripheral blood samples were collected from 479 patients with various diagnosed and confirmed cancers and 30 healthy volunteers, from September 2015 to February 2018. All patients and healthy volunteers that enrolled in this study have given written consent for participation and were approved by the Ethics committees of Eastern Hepatobiliary Surgery Hospital, Shanghai, China. All patients’ blood samples, including multiple test samples from the same patients were drawn before and after cancer treatments including surgery, chemotherapy, radiotherapy, interventional therapy, targeted drug therapy, immunotherapy and Chinese medicine. The healthy volunteers were selected with tested HIV, systemic infection, connective tissue disease, abnormal tumor marker or cancer was excluded.All experiments were performed within 48 hours after peripheral blood sample collection and result slides were collected and stored at 4°C.
Subtraction enrichment of CTCs
Subtraction enrichment experiment was performed according to the protocol of subtraction enrichment of circulation tumor cells with immunostaining-fluorescence in situ hybridization (SE-iFISH) (Cytelligen, San Diego, CA, USA).Citation6,Citation7 Briefly, first 2mL of patient peripheral blood was discarded to avoid epithelial cell contamination and additional 7.5 mL of blood was collected into a tube containing the Acid Citrate Dextrose (ACD) anticoagulant solution (Becton Dickinson, Franklin Lakes, NJ, USA).
According the manufacture’s instruction (Cytelligen, San Diego, CA, USA) with certain modifications,Citation6,Citation7 the blood sample was first centrifuged at 200 x g for 15 min, the supernatant plasma was discarded and the cell pellets were diluted with 3 ml PBS, mixed thoroughly and layered over 3 mL of separation matrix,Citation6,Citation7 followed by centrifugation at 450 x g for 6 min at room temperature. The buffy coat solution containing WBCs and tumor cells but lacking RBCs was collected and incubated with immuno-magnetic beads, conjugated with a cocktail of anti-leukocyte monoclonal antibodies, at room temperature with gentle mixing for 20 min at 125 rpm. The beads were separated from the mixture using a magnetic frame. The bead-free solution was then transferred into a new centrifuge tube, thoroughly washed two times with washing bufferCitation6,Citation7 at 500xg for 5 min.
Immunostaining and immunofluorescence in suit hybridization (iFISH)
The cell pellet was subjected to immunostaining with 1 µL Alexa Fluor 549-conjugated monoclonal anti-CD45, 1 µL Alexa Fluor 549-conjugated monoclonal anti-CD31 or 1 µL Alexa Fluor 647-conjugated monoclonal anti-CD31, 1µL Alexa Fluor 488-conjugated anti-EpCAM/CK18/PD-L1 and/or 1µL Alexa Fluor 647- conjugated anti-Vimentin. The mixture was incubated for 20 min in the dark and washed with washing buffer by centrifuging 950 x g for 4 min to remove excess antibodies. The cell suspension was then mixed with 100 µL fixativeCitation6,Citation7 and loaded onto Cytelligen formatted CTC slide. The slide was dried in the air dry oven at 32°C overnight, followed by hybridization with chromosome 8 centromere probe (CEP8) spectrum orange (Vysis, Abbott Laboratories, Abbott Park IL, USA) for 4 hours using S500-24 Statspin ThermoBrite Slide Hybridization/Denaturation System (Abbott Molecular, Des Plaines, IL, USA).
Characterization of CTCs
FISH hybridization suspension was applied onto slide with 10 µL mounting media (including DAPI). Then the slide was subjected to the Axio Imager Z2 fluorescence microscope (Zeiss, Germany) for scanning. Each sample slide was scanned automatically using Metafer 5 software. This software enables 4-channel fluorescent images of multiple fields covering the full area of sample for fluorescence detection of cells. 10x magnification (Zeiss Plan-Apochromat 10x/0.45 M27) was used to scan the sample slide and exposure times were auto-selected at 0.04 s for DAPI, 0.44 s for CEP8, 0.8 s for CD45 and fixed at 0.6 s for EpCAM, CK18, PD-L1 and Vimentin. The captured images were screened manually and CTCs are identified as CD45−, CD31−, DAPI+, tumor biomarker(s)+/- with aneuploid chromosome 8. All sample slides were reviewed by the same investigator.
Statistical analyses
All statistical analyses were performed by IBM SPSS (Version 22.0, www.spss.com) and data were shown as mean ± standard deviation. In the univariate analysis, significant parameters were analyzed and P < 0.05 (two-sided) was considered statistically significant.
Results
Total CTCs detection in the clinical samples of cancer patients
A total of 594 blood samples, including 126 liver, 85 lung, 39 colorectal, 74 renal, 38 breast, 28 bladder, 45 gastric, 12 esophagus, 12 pancreatic, 14 ovarian and 91 other (gallbladder, cervical, prostate, melanoma, endometrial, nasopharyngeal, pelvic, glioma, pelvic, cardiac) cancer samples from 479 patients and 30 healthy samples were subjected to subtraction enrichment, followed by immunofluorescence FISH analysis. The CTCs were enumerated as non-hematopoietic (CD45 negative), aneuploid chromosome 8 meanwhile excluding the CECs (CD31 positive) with or without tumor biomarkers (EpCAM, CK18 and Vimentin) by means of scanning with an automatic fluorescence microscope. The overall percentage of CTC positive patients was 89.0%, and detailed information was summarized as follows ( & Table S12).
Table 1. CTC positive rate (CTC number > 0) in different malignancies.
The average number of CTCs detected with negative enrichment was higher than that with the CellSearch system
CTCs detections among various carcinomas and detailed clinical information of cancer patients with lung, colorectal, renal, breast, gastric, bladder, esophagus and other cancers and CTC subtypes as well as total numbers were described in the supplementary tables (Table S1-S11), respectively.
For quality control, we collected 30 blood samples from healthy volunteers, no CTCs were found in this group. Detailed information was shown in the supplementary table (Table S12).
The overall percentage of positive CTC of liver cancer patients was 84.9% (107/126) with an average of 5 CTCs/7.5 ml and a range of 1–47 CTCs/7.5 ml in peripheral blood. The overall percentage of CTC positive lung cancer patients was 92.9% (79/85) with an average of 11 CTCs/7.5 ml and a range of 1–230 CTCs/7.5 ml in peripheral blood. And the total positive incidence of CTCs from colorectal cancer patients was 84.6% (33/39) with an average of 4 CTCs/7.5 ml and an interval of 1–23 CTCs/7.5 ml in peripheral blood. The percentage of positive CTC of renal cancer patients account for 91.9% (68/74) with an average of 8 CTCs/7.5 ml and a range of 1–52 CTCs/7.5 ml in peripheral blood ( & Table S12).
In addition, the average numbers of CTCs detected from lung, liver, renal and colorectal cancer samples in this study were compared with that of the CellSearch system. The above results showed that the average numbers of CTCs with our method were higher than that with the CellSearch system except in liver cancer (Table S13).
Analysis of triploid, tetraploid and polyploidy of chromosome 8 on CTCs
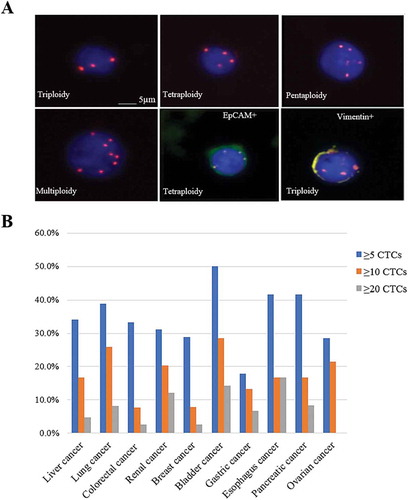
One criteria used in this study to characterize CTCs is the quantification of chromosome aneuploid (). The CTCs was classified as triploid, tetraploid and polyploid, as shown in .
Table 2. Number of CTCs in analysis of triploid, tetraploid and polyploidy of chromosome 8.
Figure 1. CTCs distributions among ten prevalent cancers. (A) Images of CTCs with different chromosome 8 ploidies. CTCs nuclei were stained with DAPI (blue) and the chromosome 8 was illustrated with centromere probe 8 spectrum orange (red dots). (B) The CTC detection numbers are categorized to three groups, as more than five CTCs, ten CTCs and twenty CTCs in the patients with liver cancer, lung cancer, colorectal cancer, renal cancer, breast cancer, bladder cancer, gastric cancer, esophagus cancer, pancreatic cancer and ovarian cancer.
The percentage of positive CTC patients and average numbers of triploid, tetraploid and polyploid detected from 10 types of cancer including liver cancer, lung cancer, colorectal cancer, renal cancer, breast cancer, bladder cancer, gastric cancer, esophagus cancer, pancreatic cancer, ovarian cancer and other cancers were shown in and , respectively. There were significant differences between triploidy and tetraploidy (2.1 ± 0.48 & 0.7 ± 0.19, P < 0.05) as well as between tetraploidy and polyploidy (0.7 ± 0.19 & 2.4 ± 0.55, P < 0.05) in the patients with stage I and II. The numbers of polyploidy (2.4 ± 0.55 & 2.6 ± 0.91, P < 0.05) and small CTCs (3.4 ± 0.66 & 3.3 ± 1.17, P < 0.05) between patients with stage I & II and stage III & IV were compared, respectively, both of which showed a significant difference ().
Table 3. Statistical analysis of ploidies and sizes of CTC in liver cancer patients with stage I & II and III & IV.
To reveal the properties of CTCs among all 19 types of cancer in stage I & II and III & IV, triploidy and the number of small CTCs were compared but showed no significant difference (P > 0.05). Nevertheless, the number of large CTCs (1.7 ± 0.32 & 4.8 ± 1.01, P < 0.05), CTM (0.02 ± 0.025 & 0.3 ± 0.1, P < 0.05), total CTCs (4.5 ± 0.62 & 10.2 ± 1.92, P < 0.05) and the CTCs phenotypes such as tetraploidy (0.6 ± 0.15 & 1.7 ± 0.30, P < 0.05), polyploidy (2.0 ± 0.43 & 4.8 ± 1.01, P < 0.05) were significantly different ().
Table 4. Statistical analysis of ploidies and sizes of CTC in all 19 cancers with stage I & II and III & IV.
Positive expression rates of Vimentin, EpCAM and Vimentin & EpCAM on CTC positive patients
Among all these 479 patients and 564 blood samples, two tumor biomarkers were mainly used for CTCs characterization, EpCAM and Vimentin. The overall positive rates of Vimentin (2.4 ± 0.67%) and EpCAM/Vimentin (24.9 ± 6.08%) among the CTC positive patients were statistically different (P < 0.05, ). Groups with statistically sufficient cancers were classified and summarized in .
Table 5. Positive Expression rates of Vimentin, EpCAM and Vimentin/EpCAM on CTCs in liver cancer and all cancers.
Analysis of the differences between the groups with more than 5, 10 and 20 of CTCs
564 blood samples were also divided into several groups according to the numbers of CTCs (5, 10, and 20) (). In the group with more than five CTCs, there were over 30% CTC positive patients in liver cancer (43/126), lung cancer (33/85), colorectal cancer (13/39), renal cancer (23/74), bladder cancer (14/28), esophagus cancer (5/12) and pancreatic cancer (5/12). The CTC positive patients were below 30% in breast cancer (11/38), gastric cancer (8/45) and ovarian cancer (4/14).
In the group with more than ten CTCs, the CTC positive patients were over 20% in bladder cancer (8/28), lung cancer (22/85) and renal cancer 1 (15/74), while the rates were below 10% in colorectal cancer and breast cancer. Other cancers had the rates with an interval of 10–20%.
Higher numbers of CTCs were also found in certain cancers, e.g., bladder cancer (4/28) and esophagus cancer (2/12), which accounted for quite a low proportion with a range of 0 to 17% (). There results suggest that the detection of CTCs in bladder and esophagus cancer would serve as an available marker for progression and treatment.
Among 19 types of cancers, only the number of CTCs in liver cancer showed the correlation with cancer stages. 56.5% of liver cancer patients with more than five CTCs were in stage Ⅰ and Ⅱ and the other patients were in stage Ⅲ and Ⅳ. In the group with more than ten CTCs, 44.4% of patients were in stage Ⅰ and Ⅱ and the remaining 55.6% were in stage Ⅲ and Ⅳ, while none of patients with more than twenty CTCs were in stage Ⅰ and Ⅱ. Therefore, the high numbers of CTCs indicate the late stages of cancers.
Discussions
Detection of CTCs depended on the sensitivity of the enrichment techniques. It has been reported that the overall percentage of CTC positive patients detected with the CellSearch was 71.1%Citation8. In our study, the overall positive rate of CTC detection was 89.0%. Individual % of CTC positive patients was varied among cancers with a minimum rate of 75.0%, which is in consistence with other negative depletion method such as Cyttel with the positive rates of 84% in lung cancerCitation9 and 68.2% in pancreatic cancer.Citation10 Our method showed significantly higher positive incidences of CTCs in lung cancer (92.9%) and pancreatic cancer (91.7%), liver cancer (84.9%), colorectal cancer (84.6%), renal cancer (91.9%) and breast cancer (94.7%), bladder cancer (92.9%), gastric cancer (95.6%), esophagus cancer (91.7%), pancreatic cancer (91.7%) and ovarian cancer (92.9%). Based on the comparison of CellSearch and SE-iFISH in Table S12, the SE-iFISH method showed relatively higher detection sensitivity of CTCs than the CellSearch method.
The detection of triploidy, tetraploidy and polyploidy of chromosome 8 in CTCs in ten types of cancers such as liver, lung, colorectal, renal, breast, bladder, gastric, esophagus, pancreatic and ovarian cancers, confirmed the existence of heterogeneous and dynamic CTCs. Of these ploidies, triploid and polyploid CTCs were the most prevalent phenotypes, and tetraploid was frequently shown in lung, colorectal, pancreatic, bladder and gastric cancers. Among 19 different carcinomas, tetraploid CTCs, polyploid CTCs, big CTCs, CTM and total numbers of CTCs in patients with stage Ⅲ and Ⅳ were statistically higher than patients with stage Ⅰ and Ⅱ (P < 0.05). In liver cancer, it was also found that the number of small CTCs in patients with stage Ⅰ and Ⅱ were statistically higher than patients with stage Ⅲ and Ⅳ (P < 0.05). In addition, patients in stage Ⅰ and Ⅱ had higher numbers of triploid CTCs compared with the numbers of tetraploid CTCs (P < 0.05). Meanwhile, the numbers of tetraploid CTCs were statistically lower than that of polyploid CTCs (P < 0.05). Furthermore, all the aneuploid CTCs showed no statistical difference among patients with stage Ⅲ and Ⅳ. As triploid CTCs and small CTCs were more aggressive (frequently observed), these results may imply that patients in stage Ⅰ and Ⅱ had higher potential to metastasis than patients in stage Ⅲ and Ⅳ.
EpCAM and Vimentin were tumor biomarkers of epithelial and mesenchymal cells, respectively. Interestingly, most CTCs were found to express EpCAM but not vimentin, confirming the epithelial phenotype of these CTCs. Additionally, vimentin was primarily distributed in small CTCs and CTM. Previous studies implied that small CTCs may be closely related to EMT (Epithelial-mesenchymal transition) and responsible for cancer metastasis and relapse.Citation11 Considering the generation of CTCs were mainly the consequence of EMT,Citation12 the combination of EpCAM and Vimentin had significantly higher positive rates than single detection with Vimentin (P < 0.05). The results strongly indicate that these two tumor biomarkers could serve as the indicator for tumor metastasis and relapse.
It had been reported that quantified chromosome ploidy had various clinical significances, including therapeutic sensitivity, tumor metastasis and relapse.Citation6,Citation7 Therefore, the karyotypic characterization of chromosome aneuploid is particularly important in CTCs.
Studies have shown that aneuploid CTCs was related with clinical outcomes of gastric cancer patients. More tetraploid and polyploid CTCs may imply the developed or acquired chemo-resistance, while triploid CTCs were associated with the primary chemo-resistance.Citation6,Citation7,Citation13 Our results revealed that patients with stage Ⅲ and Ⅳ had more CTCs with tetraploidy. CTM with two or more CTCs was rarely found but had high ability to metastasize.Citation14 The decreased expression of EpCAM on CTCs in breast cancer and colorectal cancer shows the increase of the potential of tumor growth and metastasis.Citation15-Citation18 Some CTCs were proven to be derived from EMT and expressed vimentin. Vimentin-positive CTCs have been thought to be closely related to tumor metastasis and therapeutic resistance.Citation11 Thus, CTCs real-time monitoring as a non-invasive method could exhibit great potential in evaluating therapeutic efficacy.Citation11
According to the CTCs statistics from ten types of cancers (), the patients with more than ten CTCs were very prevalent. In our data, four cancers have significantly high amounts of CTCs in peripheral blood, including lung cancer (25.9%), renal cancer (20.3%), bladder cancer (28.6%), ovarian cancer (21.4%). These findings suggest that detection of CTCs may be an available tumor biomarker for immunotherapy or targeted therapy. One application of CTC test is to monitor the efficacy of treatment. In our studies, there were 10 patients with varied cancer types who received a prognostic test. These patients had pre done CTC tests before and after specific therapeutics such as radiotherapy, chemotherapy, surgery, Chinese medicine, immunotherapy, targeted therapy, cell therapy and microwave therapy, and five patients with different cancer types received ongoing monitoring ranging from 6 months to 2 years. CTC numbers among all five patients have shown a dramatic change during cancer treatment and a deceased trend ultimately. These results support the use of CTCs to monitor treatment efficacy. The CTC numbers decreased in 5 patients by this test. However, the other 5 patients showed an increased CTC numbers and continued follow-up monitoring.
In summary, this study revealed that higher numbers of CTCs, tetraploid, polyploid and large CTCs are associated with patients with stage Ⅲ and Ⅳ. CTCs enumeration can be utilized as a biomarker for evaluation of therapeutic effect. Likewise, the quantification of chromosome aneuploid performed by iFISH for CTCs may be shown to be supportive as a predictive biomarker in monitoring disease progression.
Disclosure of potential conflict of interest statement
The authors have no conflicts of interest to report for this work.
Author contributions
Zhenlong Ye, Zhuo Chen, Shuo Ma, Qian Zhang, Qijun Qian designed the project, Zhenlong Ye, Shuo Ma, Zhuo Chen, Zhong Li and Liang Cheng revised the manuscript, Na Ding, Yongmei Ding and Qian Zhang recorded the information of patients and collected the samples, Shuo Ma, Xinyue Wang, Zenghui Xu and Xiaoxia Zhang conducted the experiments, Shuo Ma, Zhuo Chen, Yongmei Ding and Xinyue Wang wrote the manuscript, Qian Zhang and Qijun Qian supported the project.
Supplemental Material
Download MS Word (217.5 KB)Supplementary material
Supplemental data for this article can be accessed on the publisher's website.
Additional information
Funding
References
- Cristofanilli M, Budd GT, Ellis MJ, Stopeck A, Matera J, Miller MC, Reuben JM, Doyle GV, Allard WJ, Terstappen LW, et al. Circulating tumor cells, disease progression, and survival in metastatic breast cancer. N Engl J Med. 2004;351:781–791. PMID:15317891. doi:10.1056/NEJMoa040766
- Zhang S, Li L, Wang T, Bian L, Hu H, Xu C, Liu B, Liu Y, Cristofanilli M, Jiang Z.. Real-time HER2 status detected on circulating tumor cells predicts different outcomes of anti-HER2 therapy in histologically HER2-positive metastatic breast cancer patients. BMC Cancer 2016; 16:526.PMID:27456503, doi:10.1186/s12885-016-2578-5
- Pantel K, Brakenhoff RH, Brandt B. Detection, clinical relevance and specific biological properties of disseminating tumour cells. Nat Rev Cancer. 2008;8:329–340. PMID:18404148. doi:10.1038/nrc2375
- Harris L, Fritsche H, Mennel R, Norton L, Ravdin P, Taube S, Somerfield MR, Hayes DF, Bast RC Jr. American Society of Clinical O. American Society of Clinical Oncology 2007 update of recommendations for the use of tumor markers in breast cancer. J Clin Oncol. 2007;25:5287–5312. PMID:17954709. doi:10.1200/JCO.2007.14.2364
- Yu M, Stott S, Toner M, Maheswaran S, Haber DA. Circulating tumor cells: approaches to isolation and characterization. J Cell Biol. 2011;192:373–382. PMID:21300848. doi:10.1083/jcb.201010021
- Li Y, Zhang X, Ge S, Gao J, Gong J, Lu M, Zhang Q, Cao Y, Wang DD, Lin PP, et al. Clinical significance of phenotyping and karyotyping of circulating tumor cells in patients with advanced gastric cancer. Oncotarget. 2014;5:6594–6602. PMID:25026283. doi:10.18632/oncotarget.2175
- Wu W, Zhang Z, Gao XH, Shen Z, Jing Y, Lu H, Li H, Yang X, Cui X, Li Y, et al. Clinical significance of detecting circulating tumor cells in colorectal cancer using subtraction enrichment and immunostaining-fluorescence in situ hybridization (SE-iFISH). Oncotarget 2017; 8:21639-49.PMID:28423493, doi:10.18632/oncotarget.15452
- Hillig T, Horn P, Nygaard AB, Haugaard AS, Nejlund S, Brandslund I, Soletormos G. In vitro detection of circulating tumor cells compared by the CytoTrack and CellSearch methods. Tumour Biol. 2015;36:4597–4601. PMID:25608842. doi:10.1007/s13277-015-3105-z
- Chen YY, Xu GB. Erratum to: effect of circulating tumor cells combined with negative enrichment and CD45-FISH identification in diagnosis, therapy monitoring and prognosis of primary lung cancer. Med Oncol. 2015;32:190. PMID:26021469. doi:10.1007/s12032-015-0629-4
- Zhang Y, Wang F, Ning N, Chen Q, Yang Z, Guo Y, Xu D, Zhang D, Zhan T, Cui W. Patterns of circulating tumor cells identified by CEP8, CK and CD45 in pancreatic cancer. Int J Cancer. 2015;136:1228–1233. PMID:25042121. doi:10.1002/ijc.29070
- Coumans FA, Doggen CJ, Attard G, de Bono JS, Terstappen LW. All circulating EpCAM+CK+CD45- objects predict overall survival in castration-resistant prostate cancer. Ann Oncol. 2010;21:1851–1857. PMID:20147742. doi:10.1093/annonc/mdq030
- Bonnomet A, Syne L, Brysse A, Feyereisen E, Thompson EW, Noel A, Foidart JM, Birembaut P, Polette M, Gilles C. A dynamic in vivo model of epithelial-to-mesenchymal transitions in circulating tumor cells and metastases of breast cancer. Oncogene. 2012;31:3741–3753. PMID:22120722. doi:10.1038/onc.2011.540
- Li Y, Gong J, Zhang Q, Lu Z, Gao J, Li Y, Cao Y, Shen L. Dynamic monitoring of circulating tumour cells to evaluate therapeutic efficacy in advanced gastric cancer. Br J Cancer. 2016;114:138–145. PMID:26784122. doi:10.1038/bjc.2015.417
- Aceto N, Toner M, Maheswaran S, Haber DA. En route to metastasis: circulating tumor cell clusters and epithelial-to-mesenchymal transition. Trends Cancer. 2015;1:44–52. PMID:28741562. doi:10.1016/j.trecan.2015.07.006
- Gosens MJ, van Kempen LC, van de Velde CJ, van Krieken JH, Nagtegaal ID. Loss of membranous Ep-CAM in budding colorectal carcinoma cells. Mod Pathol. 2007;20:221–232. PMID:17361206. doi:10.1038/modpathol.3800733
- Driemel C, Kremling H, Schumacher S, Will D, Wolters J, Lindenlauf N, Mack B, Baldus SA, Hoya V, Pietsch JM, et al. Context-dependent adaption of EpCAM expression in early systemic esophageal cancer. Oncogene. 2014;33:4904–4915. PMID:24141784. doi:10.1038/onc.2013.441
- Zhang L, Ridgway LD, Wetzel MD, Ngo J, Yin W, Kumar D, Goodman JC, Groves MD, Marchetti D. The identification and characterization of breast cancer CTCs competent for brain metastasis. Sci Transl Med. 2013;5:180ra48. PMID:23576814. doi:10.1126/scitranslmed.3005109
- Zhang L, Ridgway LD, Wetzel MD, Ngo J, Yin W, Kumar D, Goodman JC, Groves MD, Marchetti D. The identification and characterization of breast cancer CTCs competent for brain metastasis. Sci Transl Med. 2013;5:180ra48. PMID:23576814. doi:10.1126/scitranslmed.3005109