
ABSTRACT
Immunoglobulin heavy chain (IgH) translocations are common and early oncogenic events in B cell and plasma cell malignancies including B cell non-Hodgkin’s lymphoma (NHL) and multiple myeloma (MM). IgH translocations bring oncogenes into close proximity with potent enhancer elements within the IgH locus, leading to oncogene up-regulation. As IgH enhancer activity is tightly controlled by B cell lineage-specific signaling and transcriptional networks, we hypothesized that IgH enhancers are potentially druggable targets/elements. To test this, we developed a molecular imaging-based high-throughput screening platform for discovering inhibitors of IgH enhancer-driven transcriptional activity. As proof of concept, we identified a low micromolar potency molecule (compound 30666) that inhibited immunoglobulin production by MM cells and blocked expression of an array of IgH translocation-induced oncogenes (CCND1, FGFR3/MMSET, and MYC) in MM and NHL cell lines. Prolonged exposure to 30666 significantly reduced the viability of IgH translocation-positive NHL and MM cells, but was less effective against cells lacking IgH translocations. Compound 30666 exhibited suitable pharmacological properties, including metabolic stability in liver microsomes and oral bioavailability in mice, and demonstrated preclinical anti-MM activity in a plasmacytoma mouse model. Our work suggests that IgH enhancers are attractive and potentially druggable targets for IgH translocation driven malignancies.
Introduction
IgH gene translocations are a hallmark of B and plasma cell dyscrasias. These cytogenetic abnormalities are detectable in the majority of multiple myeloma (MM) cases,Citation1 in > 80% of plasma cell leukemias,Citation2 most subtypes of non-Hodgkin lymphoma (NHL),Citation3,Citation4 > 70% of primary amyloidosis,Citation5–Citation7 50% of monoclonal gammopathy of undetermined significance (MGUS) cases,Citation1 and in some cases of POEMS syndrome.Citation8 The IgH locus is inherently unstable in cells of the B lineage. Lymphoid specific mechanisms (i.e., VDJ recombination, somatic hypermutation, and class switch recombination) couple DNA double strand breaks with recombination to modify Ig genes. While this elegant system gives rise to a diversity of high affinity antibodies, it also leaves B and plasma cells vulnerable to aberrant and potentially oncogenic translocations.Citation9 IgH translocations juxtapose the promoters of oncogenes with transcriptional enhancers within the IgH locus. Under normal conditions, IgH enhancers play a critical role in IgH gene rearrangement and transcription; in a pathological situation, these enhancers exert similar effects on oncogenes that are mistakenly translocated to the IgH locus.
IgH translocations are early transformation events in MM,Citation5,Citation10,Citation11 and their incidence increases along the disease spectrum from 50% in patients with MGUS, to 60% in intramedullary MM, 80% in extramedullary MM, and 90% of MM cell lines.Citation1 Other factors such as RAS mutations, c-Myc dysregulation, 13q deletions, and other mutational events are thought to contribute to disease progression.Citation12,Citation13 However, studies have shown that targeted inhibition of IgH-induced oncogenes by RNA interference or small molecules induces death and growth arrest of MM cells,Citation14,Citation15 suggesting that these translocations are necessary for the initiation as well as the maintenance and progression of MM. A heterogeneous group of partner chromosomes and oncogenes are involved in IgH translocations. In the case of MM, they include FGFR3, MMSET, CCND1, MAF, MAFB, CCND3, and others. This heterogeneity presents a challenge to the development of a single targeted therapeutic strategy, as only 15–20% of patients, at most, have the same oncogenic driver. Thus, a therapeutic agent targeting one oncogene or oncogenic pathway would have predicted efficacy in only a fraction of the overall patient population. By contrast, an approach targeting the IgH gene itself has the potential to block the induction of all IgH translocation-induced oncogenes regardless of the partner chromosome and affected oncogene.
Non-coding DNA (e.g., enhancers) accounts for more than half of the evolutionarily conserved sequences in the human genome.Citation16 The functional significance of these regulatory sequences and their role in human disease has become more evident,Citation17 particularly with the development of analytical tools for studying genome-wide regulatory sequences and their binding factors.Citation18–Citation20 IgH gene transcription is perhaps the most well-studied system for understanding tissue-restricted gene control and the role of non-coding regulatory DNA in that process. It is known that IgH transcription is coordinated by a set of promoters and cis-acting enhancers, which consist of the Eμ intronic enhancer and a cluster of 3ʹ enhancers collectively known as the 3ʹ regulatory region (3ʹRR).Citation21 IgH promoters and enhancers share a common octamer sequence motif, 5ʹ-ATTTGCAT-3ʹ or its inversion, which together with ubiquitous and lymphoid specific DNA binding proteins, promote the B lineage specific transcription of the IgH gene.Citation22 Transgenic mice with defective IgH enhancer sequences are deficient in IgH recombination and Ig production.Citation23,Citation24 The role of IgH enhancers in oncogenesis is also evident from gene knock-in studies, where the Eμ or the 3ʹ enhancers were juxtaposed with c-Myc or Bcl-2, leading to the development of lymphomas and plasmacytomas in mice.Citation25–Citation27 Taken together, these genetically engineered mouse studies demonstrate the critical role of IgH enhancers in normal B and plasma cell development, as well as in the development of malignancies originating from this cell compartment. This role appears to be conserved between mice and humans given the considerable rate of IgH gene translocations observed in patients with MM and other B and plasma cell disorders.
We reasoned that IgH enhancers were attractive molecular drug targets for several reasons:Citation1 they are the unifying elements in a heterogeneous collection of translocations that involve multiple partner chromosomes and oncogenes;Citation2 they are regulated in a highly specific manner, suggesting that they are druggable; andCitation3 they are only active in B and plasma cells, suggesting they may be targeted with specificity for this particular cellular compartment. In this study, we set out to establish the druggability of IgH gene enhancer signaling. To accomplish this we developed a molecular imaging based HTS platform for discovering small molecules that inhibit IgH enhancer driven transcriptional activity. From an unbiased screen of approximately 20,000 compounds spanning multiple publically available compound collections, we identified experimental compound 30666. This chemotype selectively inhibited IgH enhancer induced gene transcription, repressed the expression of IgH translocation induced oncogenes, and selectively killed MM and B cell NHL cell lines harboring a heterogeneous array of IgH translocations. This compound demonstrated favorable pharmacokinetics and signs of preclinical anti-MM activity in mice. All together, this work supports the concept of drugging IgH gene enhancers for therapy of blood cancers expressing IgH translocations, and presents compound 30666 as an early lead chemotype.
Materials and methods
Cell lines
MM (U266, MM.1S, KMS18, NCIH929, RPMI8226, ANBL6), B cell NHL cell lines (BJAB, Ramos, Raji, Granta519, UPN2), as well as Karpas299 and K562 cell lines were obtained from American Type Culture Collection (Manassas, VA, USA) and maintained in RPMI-1640 (Gibco, Grand Island, NY, USA) supplemented with 10% fetal bovine serum (Gemini Bio Products, Sacramento, CA, USA) and antibiotics. MRC5 and HFF normal fibroblasts, and HCT116 and T98G cells were grown in DMEM supplemented with fetal bovine serum and antibiotics. Proteasome inhibitor resistant MM.1S BzR cells were provided by Dr. Brian Van Ness (University of Minnesota).
HTS assay for inhibitors of igh enhancer activity
BJAB cells were transfected with the IgH enhancer/promoter driven luciferase reporter (IGHE’-Luc) plasmid at a fixed ratio of 3 μg DNA per 1 × 10⁶ cells using the Nucleofector 2b device (Lonza, Walkersville, MD, USA) set to program E-023. The IGHE’-Luc reporter was a generous gift from Dr. Dean Tantin (University of Utah), and encodes the firefly luciferase gene under the transcriptional control of an IgH promoter sequence (VH186.2) and the Eμ IgH intronic enhancer [28]. Control reporter plasmids, pGL3-Basic and pGL3-CMV-Luc, were purchased from Addgene (Cambridge, MA, USA) and transfected using a protocol identical to the one described above. BJAB cells were transfected and then transferred to microtiter plates using a Biomek NXP automated liquid handler (Beckman Coulter, Atlanta, GA, USA). After 8 hours, small molecules from compound libraries (NCI Diversity Set II, NCI Developmental Therapeutics Program, Rockville, MD, USA; Chembridge DIVERSet, San Diego, CA, USA) were added to a final concentration of 3 μM. Following a 16-hour incubation time in the presence of drug, D-luciferin (Gold Biotechnology, St. Louis, MO, USA) was added to a final concentration of 100 μg/ml. Bioluminescence counts per well were measured using a Xenogen In Vivo Imaging System (Perkin Elmer; Waltham, MA, USA). For positive hits (i.e., wells in which reporter signal was inhibited), viability of cells within that well was measured using the Cell Titer Glo bioluminescence-based cell viability assay system (Promega, Madison, WI, USA).
Western blotting
Antibodies for the detection of cyclin D1, FGFR3, and c-Myc were purchased from Cell Signaling Technologies (Beverly, MA, USA). Antibodies for the detection of β-actin and human IgG were purchased from Sigma-Aldrich (St. Louis, MO, USA). Antibodies for the detection of human IgE and MMSET proteins were purchased from Santa Cruz Biotechnology (Dallas, TX, USA).
qPCR
For the quantification of CCND1, MYC, and GAPDH expression, TaqMan® Gene Expression Assays for each genetic target were purchased from Life Technologies (Grand Island, NY, USA), and relative expression was quantified using a QuantStudio 12KFlex instrument (Life Technologies, Grand Island, NY, USA).
Cell cycle and cell death analysis
Cells were fixed in 70% EtOH, and DNA was stained with propidium iodide dye. DNA content was quantified by flow cytometry using excitation and emission wavelengths of 488 nm and 610 nm, respectively. Cells containing less than diploid (2N) DNA content (i.e., the Sub-G1 population), were represented as the percentage of total cells. Cell cycle analysis was performed using Modfit software (Verity Software House, Topsham, ME, USA).
Pharmacokinetics, metabolic stability, and pKa determination
Pharmacokinetic (PK) studies were conducted in accordance with the Institutional Animal Care and Use Committee (IACUC) and state and federal guidelines for the humane treatment and care of laboratory animals. Male C57BL/6 mice (8–12 weeks old, 25–30 g weight) were purchased from Charles River Laboratories (Wilmington, MA, USA). Mice were divided into 2 groups designated to receive compound 30666 (5 mg/kg) by intraperitoneal (i.p.) injection or via oral gavage (p.o.). Blood samples were collected from retro-orbital plexus of three mice at time 0 (i.e., pre-dose), and 0.08, 0.25, 0.5, 1, 2, 4, 8 and 24 hours post injection for the group receiving 30666 via the i.p. route of administration. For animals treated with oral 30666, blood samples were collected at 0, 0.25, 0.5, 1, 2, 4, 6, 8 and 24 hours. Samples were collected in K2EDTA solution as an anticoagulant. Plasma was immediately harvested from blood by centrifugation at 4000 rpm for 10 min at 4ºC and stored below −70ºC until bioanalysis. Concentrations of 30666 in the plasma of mouse blood was determined by liquid chromatography-tandem mass spectrometry (LC-MS/MS). The system was equipped with a 4000QTRAP mass spectrometer (AB/MDS SCIEX, Concord, Ontario, Canada) and a Shimadzu Prominence HPLC system with a SLC-20AD solvent delivery unit, SIL-HTc auto sampler, and CTO-20AC column oven (Shimadzu, Kyoto, Japan).
For metabolic stability testing in human liver microsomes, pooled human liver microsomes (Sigma-Aldrich, St. Louis, MO, USA) were used. Reactions were carried out by the addition of compound 30666 (1 μM) or terfenadine (1 μM, assay control) and initiated by adding NADPH (1 mM). Reactions were terminated by the addition of ice-cold acetonitrile at 0, 5, 15, 30 and 60-minute time points. Reactions without NADPH and heat inactivated microsomes minus NADPH were included to rule out non-NADPH metabolism or chemical instability in the incubation buffer. Samples were monitored for parent compound disappearance by LC-MS/MS in MRM mode.
Acid dissociation constant (pKa) determination was conducted using GLpKa instrumentation (Sirius, East Sussex, UK). Briefly, this was accomplished by titrating compound 30666 in a double titration fashion, using MeOH as the co-solvent, from pH 1.8 to pH 12.0. Spectrophotometric DPAS co-solvent method coupled with Yasuda-Shedlovsky extrapolation was used to calculate aqueous pKa.
Anti-MM efficacy studies in mice
SCID Hairless Outbred (SHO) mice (Charles River Laboratories) were housed and maintained in accordance with the IACUC and state and federal guidelines for the humane treatment and care of laboratory animals. Sub-cutaneous MM xenograft tumors were established as described previously.Citation28 Briefly, 3 × 10⁶ RPMI-8226-Luc cells were co-injected with 1 × 10⁵ irradiated (8 Gy) NIH-3T3 murine fibroblasts into the rear flanks of SHO mice. Treatment with compound 30666 was initiated after tumors were palpable, reached a volume of 150 mm3, and produced a bioluminescent signal via non-invasive optical imaging. Mice were imaged using the Xenogen IVIS system with Living Image software (Perkin Elmer, Waltham, MA, USA) immediately after i.p. injection of D-luciferin (150 mg/kg). The detection of a bioluminescence signal was used to confirm the presence of viable tumor cells as a confirmation of successful tumor take. Compound 30666 was administered daily by i.p. injection at a dose of 5 mg/kg in a vehicle of PBS containing 5% Cremophor. Tumors were measured twice per week using digital calipers. Tumor volumes were calculate using the following equation: Volume = (Length x Width x Width) x 0.5. Animal body weIGHt was measured twice weekly to assess drug treatment toxicity.
Results
HTS for small molecule inhibitors of IgH enhancer driven transcriptional activity
In order to measure IgH enhancer induced transcriptional activity we used a firefly luciferase reporter under the control of variable IgH gene promoter and the intronic Eμ enhancer (IGHE’-Luc). This reporter construct maps to a 700 bp fragment of the Eμ enhancer including a core 220 bp region containing all functionally characterized transcription factor binding sites.Citation29–Citation32 To first confirm the lineage specific activity of our reporter, we validated that the IgH enhancer driven reporter was active in cells from B and plasma cell malignancies but not cells of different origin as demonstrated by others.Citation33,Citation34 We confirmed robust reporter induction in B cell NHL cell lines (BJAB, Granta, and Raji) and MM cells (NCI-H929 and RPMI-8226) but not solid tumor cell lines (HCT116 and T98G) (). Having demonstrated B lineage specific regulation of the IgH gene enhancer-driven reporter system, we set out to adapt this system for HTS to discover small molecule inhibitors of IgH transcriptional activity. Several layers of screening were incorporated in the screening platform to rule out false positive hits. A control reporter driven by the SV40 viral promoter and enhancer, and a second control reporter regulated by the cytomegalovirus (CMV) were included to identify and exclude compounds that have general effects on transcription, that have direct effects on luciferase activity, or other sources of false positivity. In addition, cell viability was confirmed for each positive hit to confirm the presence of live cells and to rule out purely cytotoxic compounds. To minimize the impact of drug cytotoxicity, a short treatment time of 16 hours was used for initial screening. Using this system, we first tested the activity of known anti-MM agents that are approved for clinical use or are under evaluation in clinical trials. These agents included the proteasome inhibitor bortezomib, the glucocorticoid dexamethasone, the immunomodulatory agent lenalidomide, and the multi-kinase inhibitor sorafenib. None of these agents showed inhibition of the IgHE’-Luc reporter relative to the control reporter (), demonstrating that this molecular mechanism is unaffected by these FDA-approved agents and further suggesting that this is a novel molecular target/pathway for the treatment of IgH translocation positive B and plasma cell malignancies. We screened approximately 20,000 compounds spanning multiple publically available libraries including the NCI Diversity Set II and the Chembridge DIVERSet. From this set, we identified one compound, which we named 30666 (7-[[(4-methyl-2-pyridinyl)amino](2-pyridinyl)methyl]-8-quinolinol; C21H18N4O; ), that showed highly specific inhibition of IgH enhancer transcriptional activity in the low micromolar concentration range (IC50 of 2.1 ± 0.2 μM). Furthermore, we identified multiple structurally related derivatives of 30666 that exhibited potency that was comparable to 30666 at concentrations within one log range ().
Figure 1. Compound 30666 inhibits IgH gene enhancer transcriptional activity.
(A) The indicated cell lines were transfected with a control firefly luciferase reporter (pGL3) or a reporter driven by a variable IgH promoter and Eμ intronic IgH enhancer sequence (IGHE’-Luc). Reporter activity is shown as folds above control reporter. A representative bioluminescence image is shown on the right.(B) IgH enhancer activity was measured following treatment with agents that are approved for the treatment of MM (bortezomib, Btz, 5 nM; dexamethasone, Dexa, 10 μM; lenalidomide, Lenalid, 100 μM) or the multi-kinase inhibitor sorafenib (2 μM). A control reporter is shown as an internal standard to account for any non-specific drug activity. Compound 30666 was included as a positive control.(C) BJAB cells expressing IgH enhancer driven reporter (IGHE’-Luc) or control reporter were treated with a dose range of compound 30666 for 16 hours. Reporter activity is shown as a percentage of control (DMSO) treated cells. The chemical structure of compound 30666 (7-[[(4-methyl-2-pyridinyl)amino](2-pyridinyl)methyl]-8-quinolinol, C21H18N4O) is shown in the inset.(D) BJAB cells expressing IGHE’-Luc (left panel) or control reporter (right panel) were treated with a dose range of 30666 derivatives for 16 hours. Reporter activity is shown as a percentage of control (DMSO) treated cells. Chemical structures for the 30666 derivatives are shown with modifications highlighted in red.
methyl]-8-quinolinol, C21H18N4O) is shown in the inset.(D) BJAB cells expressing IGHE’-Luc (left panel) or control reporter (right panel) were treated with a dose range of 30666 derivatives for 16 hours. Reporter activity is shown as a percentage of control (DMSO) treated cells. Chemical structures for the 30666 derivatives are shown with modifications highlighted in red.](/cms/asset/8eddacc3-a5a8-4b55-8ae8-1f0eda50ad55/kcbt_a_1538615_f0001_oc.jpg)
Compound 30666 represses the expression of IgH translocation-induced oncogenes
Given that IgH gene enhancers are known to induce the transcription of oncogenes that are overexpressed in cells that have IgH gene translocations, we reasoned that compound 30666 would repress the expression of these endogenous oncogenes. Furthermore, the fact that these enhancers are common elements across all IgH translocations, which affect a heterogeneous set of oncogenes, we hypothesized that an inhibitor of IgH enhancer activity would block the expression of all oncogenes regardless of the translocation partner. To test this hypothesis, we treated various MM and NHL cell lines representing the most common 14q32 translocations with a dose range of 30666 and measured the expression of the translocated/overexpressed oncogene. We found that 30666 blocked the expression of all the translocated oncogenes that were tested in a dose dependent manner at concentrations less than 5 μM. For example, U266 MM cells overexpress the cyclin D1 protein due to a structurally atypical IgH translocation. Compound 30666 inhibited cyclin D1 expression in these cells (), as well as in Granta-519 cells (), a mantle cell lymphoma (MCL) cell line that also overexpress cyclin D1 due to the t(11;14) translocation. Bortezomib (Btz) had no effect on cyclin D1 expression (), drawing a comparison between this MM standard of care agent and experimental compound 30666. Likewise, in KMS18 MM cells, 30666 reduced the expression of FGFR3 and MMSET proteins which are dually overexpressed as a result of the t(4;14) reciprocal translocation (). Compound 30666 also blocked expression of c-Myc in mouse myeloma cells derived from iMycCα/3ʹKE-BclXL transgenic mice (), in which c-Myc expression is juxtaposed with, and therefore under the control of, the 3ʹ IgH enhancer element.Citation35,Citation36 At the mRNA level, we observed repression of MYC expression in t(8;14) positive Burkitt’s lymphoma cells (Ramos) and a modest but statistically significant reduction in CCND1 expression in U266 MM cells (), suggesting that the effects of 30666 on oncogene expression occur at the transcriptional level rather than by affecting protein stability or protein translation. By comparison, 30666 had no effect on the expression of oncogenes that are characteristic of other hematological malignancies that lack IgH translocations. For instance, BCR-Abl expression was unaffected by 30666 treatment in Ph+ K562 chronic myelogenous leukemia cells (), nor was NPM-ALK expression affected by treatment in Karpas299 t(2;5) positive anaplastic large cell lymphoma cells (). These experiments demonstrate that 30666 affects the expression of a particular set of genes that are involved in IgH translocations, rather than having a global and non-specific effect on gene transcription.
Figure 2. Lead compound 30666 represses the expression of IgH translocation induced oncogenes.
(A) U266 MM cells harboring the t(11;14) IgH translocation, which results in the overexpression of the CCND1 oncogene, were treated with a dose range (0, 0.32, 0.63, 1.25, 2.5, 5.0 μM) of 30666. Western blots are shown. The MM standard of care agent, Btz (5 nM), was included for comparison.(B) t(11;14) positive Granta519 MCL cells were treated as in (A). Western blots are shown.(C) [Left panel] KMS18 MM cells, which harbor the t(4;14) reciprocal translocation resulting in the up-regulation of FGFR3 and MMSET oncogenes, were treated as in (A) and (B). Western blots are shown.[Right panel] 595sp mouse MM cells, which overexpress MYC and BCL2L1 due to gene rearrangements with the mouse IGH and IGL genes, respectively, were treated with a dose range of 30666 as in (A). Western blots are shown.(D) Ramos cells, which overexpress MYC due to the t(8;14) IgH translocation, were treated with 30666 (3 μM) for 24 hours. MYC mRNA was quantified relative to GAPDH by qPCR (*P < 0.05). U266 MM cells were also treated with 30666 (3μM) for 24 hours and CCND1 mRNA levels measured by qPCR (*P < 0.05).(E) [Top panel] K562 chronic myelogenous leukemia (CML) cells, which express the BCR-Abl oncogene due to the presence of the Philadelphia chromosome, were treated with increasing concentrations of 30666 for 24 hours. Western blots are shown.[Bottom panel] Karpas 299 cells, a t(2;5)-positive anaplastic T cell lymphoma cell line that expresses a fusion NPM-ALK gene, were treated with increasing concentrations of 30666 for 24 hours. Western blots are shown.(F) IgG secreting SA13 human hybridoma cells were treated with a dose range of 3066 (0, 1.25, 2.5, 5.0, 10 μM) for 24 hours. Western blots are shown at left (HC: Ig heavy chain; LC: Ig light chain).(G) IgE secreting U266 MM cells were treated as in (E). Western blots (left) and viable cell counts (right) are shown.
![Figure 2. Lead compound 30666 represses the expression of IgH translocation induced oncogenes.(A) U266 MM cells harboring the t(11;14) IgH translocation, which results in the overexpression of the CCND1 oncogene, were treated with a dose range (0, 0.32, 0.63, 1.25, 2.5, 5.0 μM) of 30666. Western blots are shown. The MM standard of care agent, Btz (5 nM), was included for comparison.(B) t(11;14) positive Granta519 MCL cells were treated as in (A). Western blots are shown.(C) [Left panel] KMS18 MM cells, which harbor the t(4;14) reciprocal translocation resulting in the up-regulation of FGFR3 and MMSET oncogenes, were treated as in (A) and (B). Western blots are shown.[Right panel] 595sp mouse MM cells, which overexpress MYC and BCL2L1 due to gene rearrangements with the mouse IGH and IGL genes, respectively, were treated with a dose range of 30666 as in (A). Western blots are shown.(D) Ramos cells, which overexpress MYC due to the t(8;14) IgH translocation, were treated with 30666 (3 μM) for 24 hours. MYC mRNA was quantified relative to GAPDH by qPCR (*P < 0.05). U266 MM cells were also treated with 30666 (3μM) for 24 hours and CCND1 mRNA levels measured by qPCR (*P < 0.05).(E) [Top panel] K562 chronic myelogenous leukemia (CML) cells, which express the BCR-Abl oncogene due to the presence of the Philadelphia chromosome, were treated with increasing concentrations of 30666 for 24 hours. Western blots are shown.[Bottom panel] Karpas 299 cells, a t(2;5)-positive anaplastic T cell lymphoma cell line that expresses a fusion NPM-ALK gene, were treated with increasing concentrations of 30666 for 24 hours. Western blots are shown.(F) IgG secreting SA13 human hybridoma cells were treated with a dose range of 3066 (0, 1.25, 2.5, 5.0, 10 μM) for 24 hours. Western blots are shown at left (HC: Ig heavy chain; LC: Ig light chain).(G) IgE secreting U266 MM cells were treated as in (E). Western blots (left) and viable cell counts (right) are shown.](/cms/asset/8d9bc1f4-97c6-4006-be53-e198bf67aa78/kcbt_a_1538615_f0002_oc.jpg)
IgH translocations typically affect the non-functional IgH allele, leaving the functional allele intact and capable of expressing the normal IgH gene.Citation37 IgH gene enhancers play an important role in IgH transcription in Ig secreting cells.Citation23,Citation38–Citation40 Therefore, we next tested whether 30666 treatment could affect the expression and secretion of Ig in Ig-secreting cells. Indeed we found that compound 30666 reduced the expression of IgG heavy and light chains in SA13 cells, a human hybridoma cell line that secretes a monoclonal IgG antibody against tetanusCitation41 (), and similar results were observed in IgE secreting U266 MM cells (). Importantly, 30666 had these effects on Ig production after a 24-hour treatment time that had no significant effect on cell viability or proliferation (). Therefore these effects are not due to a reduction in cell number, but rather a molecular effect of 30666 that targets Ig production. Taken together, these results demonstrate that compound 30666 blocks the expression of endogenous genes that are under the transcriptional control of IgH gene enhancers, including IgH translocation induced oncogenes and normal Ig genes.
Lead compound 30666 exhibits selective cytotoxicity in IgH translocation positive cells
Given that 30666 blocked the expression of oncogenes that are known to promote survival and proliferation, we next investigated effects on cell death and viability in various cells treated with the drug for extended periods (i.e., > 48 hours). We treated a panel of MM and B cell NHL cell lines with a dose range of 30666 and then measured effects on cell viability. Normal cells [i.e., human foreskin fibroblasts (HFF) and lung fibroblasts (MRC5)] were included for comparison, along with human embryonic kidney (HEK) cells and malignant cells from hematological malignancies that are negative for IgH translocations [i.e., Karpas299, Jurkat, and MOLT-4 (T cell origin); and K562, KG1, and Kasumi (myeloid cell origin)]. We found that in cells positive for IgH translocations, 30666 reduced viability with an average effective concentration 50 (EC50) of 4.0 ± 0.7 μM (N = 10; -B). By comparison, IgH translocation negative cells and normal cells were less sensitive to 30666 with an average EC50 of 51 ± 23 μM (N = 12). While there was a clear trend toward a difference in sensitivity to 30666 between cells with and without IgH translocations, the difference in EC50 did not reach statistical significance due to variability within the IgH translocation negative group (; P = 0.061). For example, some cell types were highly resistant to 30666 (i.e., Karpas 299, K562, and fibroblasts) with EC50s ranging from 30–240 μM, whereas some T and myeloid cell lines were more sensitive with EC50s < 10 μM. By comparison, cells harboring IgH translocations were uniformly sensitive with EC50s < 7 μM. To determine whether compound 30666 reduced cell viability by actively inducing cell death, we analyzed cellular sub-G1 DNA content by flow cytometry. We observed a significant increase in the fraction of sub-G1 DNA containing cells in a panel of IgH translocation positive MM and NHL cell lines (), demonstrating that the mechanism of anti-tumor activity of 30666 is, at least in part, due to the induction of cell death. In line with this conclusion, we conducted full cell cycle analysis in two cell lines and observed only minor changes in cell cycle (a modest increase in the proportion of cells in the G2/M phase) following 30666 treatment (data not shown). We next investigated the anti-MM activity of 30666 in cells that are resistant to standard of care therapies. We used proteasome inhibitor (PI) resistant cells (MM.1S BzR), which were selected using a method that has been described previously.Citation42 We found that 30666 had identical cytotoxic activity in PI sensitive and resistant cells (), suggesting that mechanisms of resistance that hinder other MM agents do not affect the activity of 30666. We then evaluated the activity of 30666 in primary patient plasma cells harvested from MM bone marrow aspirates. We noted significant activity of the compound against a t(4;14) positive sample from a patient whose disease had progressed to a refractory stage (). Malignant plasma cells from this patient were resistant to the glucocorticoid, dexamethasone, at concentrations as high as 100 μM. We also investigated whether compound 30666 could cooperate with FDA-approved agents to induce death of MM cells. We co-treated PI resistant MM.1S BzR cells with a fixed dose of 30666 (1 μM) and a dose range of two FDA-approved PIs (bortezomib and carfilzomib), a glucocorticoid (dexamethasone), an immunomodulatory drug (IMiD; lenalidomide), and a pan HDAC inhibitor (panobinostat). While the combination of 30666 with the various standard of care agents was highly effective in killing MM cells, the effects appeared to be mostly additive rather than synergistic (data not shown). To summarize, these findings demonstrate that compound 30666, in addition to blocking the transcriptional activity of IgH gene enhancers and repressing the expression of driver oncogenes that are induced by IgH translocations, reduces the viability of IgH translocation positive cancer cells. This effect is primarily due to the active induction of cell death and is evident in cell models of resistance and primary patient MM plasma cells.
Figure 3. Compound 30666 exhibits potent and selective activity against hematological cancer cells harboring IgH gene translocations.
(A) The indicated cell lines were treated with a dose range of 30666 for 48 hours. Cell viability data is shown. Cells marked by red regression lines and type are positive for IgH translocations [IgH Tx(+)] whereas cell lines marked in black are negative [IgH Tx(-)].(B) EC50 values were extrapolated from dose curves in (A). A student’s t-test was used to measure statistical significance.(C) The indicated cell lines were treated with DMSO (control) or 30666 (3 μM) for 48 hours. Cell death was measured by propidium iodide staining and flow cytometric analysis of DNA content. Data is represented as the percentage of dead cells (i.e., those with sub-G1 DNA content) per population.(D) Parental MM.1S cells or Btz resistant MM.1S cells (MM.1S BzR) were treated with a dose range of 30666 (top panel) or Btz (bottom panel). Cell viability data are shown.(E) CD138+ primary MM patient plasma cells were isolated from bone marrow aspirates and cultured in the presence of 30666 or dexamethasone. Cell viability data are shown for a 48 hour time point.
![Figure 3. Compound 30666 exhibits potent and selective activity against hematological cancer cells harboring IgH gene translocations.(A) The indicated cell lines were treated with a dose range of 30666 for 48 hours. Cell viability data is shown. Cells marked by red regression lines and type are positive for IgH translocations [IgH Tx(+)] whereas cell lines marked in black are negative [IgH Tx(-)].(B) EC50 values were extrapolated from dose curves in (A). A student’s t-test was used to measure statistical significance.(C) The indicated cell lines were treated with DMSO (control) or 30666 (3 μM) for 48 hours. Cell death was measured by propidium iodide staining and flow cytometric analysis of DNA content. Data is represented as the percentage of dead cells (i.e., those with sub-G1 DNA content) per population.(D) Parental MM.1S cells or Btz resistant MM.1S cells (MM.1S BzR) were treated with a dose range of 30666 (top panel) or Btz (bottom panel). Cell viability data are shown.(E) CD138+ primary MM patient plasma cells were isolated from bone marrow aspirates and cultured in the presence of 30666 or dexamethasone. Cell viability data are shown for a 48 hour time point.](/cms/asset/3f0e591b-2a42-413d-b709-658540927518/kcbt_a_1538615_f0003_oc.jpg)
Compound 30666 exhibits favorable pharmacokinetic properties and anti-MM activity in vivo
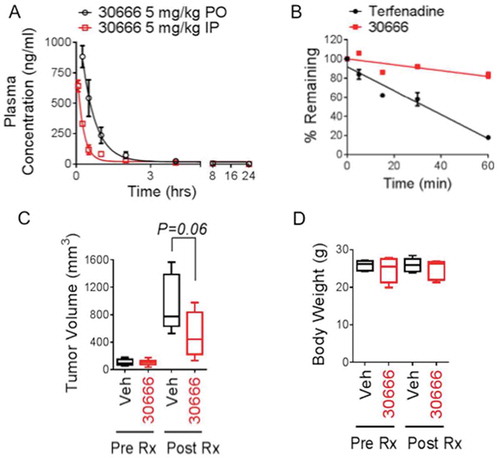
We next investigated the pharmacological properties and activity of compound 30666 in vivo. We first conducted pharmacokinetic studies in mice to evaluate the bioavailability of the compound following dosing by different routes of administration. Compound 30666 was absorbed rapidly, reaching a maximum plasma concentration (Cmax) of 642 ± 47 ng/ml (~ 1.9 μM) at 5 minutes (Tmax) after a single dose (5 mg/kg) was administered via the intraperitoneal route (). To gain a more complete understanding of the physiochemical properties of compound 30666, we conducted studies to identify the acid dissociation constant (pKa) of the drug. Using the spectrophotometric D-PAS co-solvent method, four pKa values were identified at 3.204, 3.946, 5.402 and 10.37. The pKa values identified in the acidic range suggested that 30666 would be stable and readily absorbed from the acidic environment of the gut, making it a good candidate for oral administration. To test this possibility, we conducted a second PK study to evaluate the oral bioavailability of 30666. Indeed, 30666 was rapidly absorbed after a single orally administered dose (5 mg/kg), reaching a Cmax of 884 ± 91 ng/ml (~ 2.6μM) at a Tmax of 15 minutes (). Additional studies were conducted to test the metabolic stability of 30666 in human liver microsomes. In these studies, compound 30666 exhibited moderate to high stability with a half-life > 60 minutes, compared to the control compound, terfenadine, which showed a half-life of 25 minutes (). Having identified pharmacological properties of compound 30666 that predicted favorable pharmacological properties in vivo, we next conducted preclinical efficacy studies in immunocompromised mice using a plasmacytoma model that we have used previously to assess the anti-MM activity of experimental small molecules.Citation28 Mice were treated continuously for 14 days with daily 30666 at 5 mg/kg (i.p.). Tumor volumes and animal body weights were monitored until the study endpoint of 42 days (28 days post treatment). Treatment with compound 30666 showed a clear trend toward inhibition of tumor growth (), although the difference between groups did not reach statistical significance (P = 0.06, N = 10). The drug was well tolerated as there were no visible signs of toxicity using the body condition scoring method, nor were there significant differences in body weight between vehicle and 30666 treated groups (). These results indicate that 30666 exhibits generally favorable pharmaceutical properties for an early stage lead compound including good metabolic stability, oral bioavailability, tolerability, a good PK profile characterized by rapid absorption and clearance of the drug from the blood of mice, and a trend in anti-tumor activity was evident.
Figure 4. Pharmacokinetics and in vivo anti-MM efficacy of compound 30666.
(A) C57BL/6 mice were given a single dose of 5 mg/kg 30666 via oral gavage (PO, black circles) or intraperitoneal (IP, red squares) injection. Blood was drawn at 0.25, 0.5, 1, 2, 4, 8, and 24 hours after dosing, and plasma concentrations of 30666 were quantified by LC-MS/MS. The average (mean ± S.E.) plasma concentration is shown plotted against time for each route of administration (N = 3 mice per time point).(B) The metabolic stability of 30666 was determined by incubating the compound in the presence of human liver microsomes. The disappearance of 30666 or control compound (terfenadine) was measured by LC-MS/MS at 0, 5, 15, 30, and 60-minute intervals.(C) Plasmacytomas were induced in SCID Hairless Outbred mice by subcutaneous injection of RPMI-8226 human MM cells. Once tumors reached a plapable size of 150 mm3, treatments with daily 30666 (5 mg/kg, i.p.) or vehicle (PBS + 5% Cremophor) were initiated. Mice were treated for 14 days. Tumor volume data are shown at the study endpoint (28 days post initiation of drug treatment). A student’s t-test statistical analysis was used (N = 10).(D) Body weight analysis from animals treated in (C) is shown. Animals were weighed prior to treatment with 30666 (Pre-Rx) and on day 15 after 14 days of 30666 treatment (Post-Rx). There was no significant difference in body weight between groups either before or after drug treatment (N = 5).
Discussion
IgH gene translocations are the most common and one of the earliest oncogenic events in the development of nearly all B and plasma cell dyscrasias.Citation43 This collection of diseases includes MM, NHL, and others, and accounts for approximately 100,000 new diagnoses each year in the U.S alone.Citation44 The prevalence of these events is attributed to the instability of the IgH gene in cells of the B lineage.Citation45 The IgH gene locus is particularly vulnerable to recombination errors throughout the phases of B cell differentiation, as cycles of DNA strand breaks and homologous recombination are programmed molecular events that promote antibody diversification. As such, oncogenic IgH translocations appear to result from an illegitimate recombination event that fuses one of several oncogenes with potent enhancer elements within the IgH locus. It has been proposed that these enhancers then augment the activity of translocated oncogene promoters, inducing oncogene up-regulation and subsequent transformation of the cell.Citation1 IgH translocations affect an assorted group of partner chromosomes and genes. A single targeted therapeutic approach that attacks a specific oncogene or oncogenic signaling pathway offers limited utility, but a strategy targeting the IgH gene itself would, in theory, have utility across all of the unique translocations.
The activity of the IgH gene is tightly regulated via B lineage specific signaling and transcription factor networks that engage specific DNA binding motifs in IgH enhancers and promoters. From an evolutionary perspective, this high level of regulation ensures that the expression of the large multi-subunit Ig proteins are confined to the B cell lineage. We hypothesized that this complex and highly specific framework of regulation presents a druggable therapeutic opportunity, and we set out to discover small molecules capable of interfering with IgH enhancer driven transcriptional activation. To accomplish this, we developed a cell-based phenotypic HTS platform that measures IgH enhancer driven transcription of an optical imaging reporter gene. This platform was used to screen chemical libraries for small molecules that specifically inhibit IgH enhancer driven transcriptional activity in B and plasma cell malignancies harboring IgH gene translocations. After screening > 20,000 compounds, we identified a compound (30666) that inhibited IgH enhancer driven transcription with low micromolar potency, but not other enhancer/promoter driven systems. As proof-of-mechanism in cellular models, this compound repressed the expression of several IgH translocation induced oncogenes in a heterogeneous group of MM and MCL cell lines representing the various IgH translocation cytogenetic subclasses. This supports the hypothesis that a strategy to target critical regulatory elements within the IgH gene (i.e., the enhancers) would block the expression of IgH-induced oncogenes regardless of the partner chromosome and oncogene involved in the translocation. Importantly, these effects on oncogene expression occurred rapidly and preceded any cytotoxic effects of the molecule. Compound 30666 inhibited the production and secretion of immunoglobulins by human MM and hybridoma cell lines, an effect that is consistent with an inhibitor of IgH enhancer activity, given the critical role that these enhancers play in the expression of the normal IgH gene. By comparison, 30666 had no effects on non-IgH translocation-induced oncogenes that are drivers of non-B lineage hematological malignancies (i.e., BCR-Abl and ALK in CML and T cell lymphoma, respectively). Extended periods of treatment (> 48 hours) with 30666 significantly reduced the viability of MM and NHL cell lines harboring IgH translocations. The loss of viability was primarily due to the induction of apoptosis, but we also observed a modest G2/M block of the cell cycle suggesting that 30666 induces cell death and, to a lesser extent, cell cycle arrest. We observed selective killing of cells with IgH translocations; however, some of the cell lines that lack IgH translocations, including T cell lymphoma and myeloid cell leukemia cell lines, were also sensitive to the drug, suggesting that the precise mechanisms through which 30666 inhibits IgH enhancer activity may be a mechanism that regulates cellular processes in cells of non-B cell origin. By comparison, normal and immortalized fibroblasts, and the majority of IgH translocation negative blood cancer cell lines were virtually insensitive to 30666. In a mouse subcutaneous plasmacytoma xenograft model, 30666 was overtly non-toxic at a dose of 5 mg/kg and demonstrated a modest anti-tumor response. While this dose generated peak plasma maximum concentrations of around 1.5 μM, as determined by our PK studies, the solubility of the molecule was a limiting factor that prevented us from dosing the animals beyond 5 mg/kg. Therefore, while 30666 exhibited many favorable pharmaceutical properties, additional chemical optimization steps are required prior to further evaluation in preclinical mouse models.
What is not clear from our study is the precise mechanism through which compound 30666 inhibits IgH gene enhancer signaling. Structurally, IgH enhancers are stretches of non-coding DNA that regulate gene transcription by recruiting specific transcription factors and regulatory proteins through sequence specific DNA binding domains. The most likely target of 30666 is a protein or complex that interacts with the enhancers or a signaling event that regulates the activity or subcellular localization of one or more of those enhancer binding proteins. Numerous studies have delineated the major mechanisms and factors that mediate the activity of IgH enhancers. For example, IgH promoters are weak promoters that require the activity of two sets of distal enhancers to recruit basal transcriptional machinery and initiate transcription. Within these enhancers, specific transcription factor binding motifs have been resolved,Citation46,Citation47 and various lineage specific transcription factors and co-factors that are required for robust Ig transcription have been identified.Citation48–Citation53 Tissue- and stage-specific factors that bind to the enhancer regions (Eµ and 3ʹRR) and modulate transcription and rearrangement of the IgH gene have likewise been reported. For example, a host of DNA interacting proteins that bind to IgH enhancer sequences and mediate their activity have been identified, including E2A,Citation54 Oct1 and Oct2 and OCA-B,Citation46–Citation52 Pax5,Citation55 and ubiquitous factors such as Yin Yang 1 (YY1)Citation56,Citation57 and CTCF.Citation55,Citation58 Other potential molecular targets that regulate IgH enhancers, directly or indirectly, have been suggested as well. These include epigenetic regulators such as histone deacetylasesCitation59 and histone methyltransferases,Citation60 and components of signal transduction pathways, such as NF-kb.Citation61,Citation62 The extensive literature base on the control of IgH enhancer activity and the potential role of this pool of candidate molecular targets and signaling pathways suggests the existence of multiple, potentially druggable mechanisms that could be exploited to inhibit IgH enhancer activity. Which, if any, of these mechanisms are engaged by 30666 is not known and is the focus of ongoing studies by our group. Overall, this study provides evidence that targeting IgH gene enhancers represents a promising therapeutic approach for the treatment of B and plasma cell maligancies.
Conflict of interest statement
N.G.D. has an equity interest in Leukogene Therapeutics Inc.
Additional information
Funding
References
- Bergsagel PL, Kuehl WM. Chromosome translocations in multiple myeloma. Oncogene. 2001;20:5611–5622. doi:10.1038/sj.onc.1204641.
- Tiedemann RE, Gonzalez-Paz N, Kyle RA, Santana-Davila R, Price-Troska T, Van Wier SA, Al E, Ketterling RP, Gertz MA, Henderson K, et al. Genetic aberrations and survival in plasma cell leukemia. Leukemia. 2008;22:1044–1052. doi:10.1038/leu.2008.4.
- Kuppers R, Dalla-Favera R. Mechanisms of chromosomal translocations in B cell lymphomas. Oncogene. 2001;20:5580–5594. doi:10.1038/sj.onc.1204640.
- Bernicot I, Douet-Guilbert N, Le Bris MJ, Morice P, Abgrall JF, Berthou C, Morel F, De Braekeleer M. Characterization of IGH rearrangements in non-Hodgkin’s B-cell lymphomas by fluorescence in situ hybridization. Anticancer Res. 2005;25:3179–3182.
- Hayman SR, Bailey RJ, Jalal SM, Ahmann GJ, Dispenzieri A, Gertz MA, Greipp PR, Kyle RA, Lacy MQ, Rajkumar SV, et al. Translocations involving the immunoglobulin heavy-chain locus are possible early genetic events in patients with primary systemic amyloidosis. Blood. 2001;98:2266–2268.
- Perfetti V, Coluccia AM, Intini D, Malgeri U, Vignarelli MC, Casarini S, Merlini G, Neri A. Translocation T(4;14)(p16.3;q32) is a recurrent genetic lesion in primary amyloidosis. Am J Pathol. 2001;158:1599–1603. doi:10.1016/S0002-9440(10)64115-6.
- Bochtler T, Hegenbart U, Cremer FW, Heiss C, Benner A, Hose D, Moos M, Bila J, Bartram CR, Ho AD, et al. Evaluation of the cytogenetic aberration pattern in amyloid light chain amyloidosis as compared with monoclonal gammopathy of undetermined significance reveals common pathways of karyotypic instability. Blood. 2008;111:4700–4705. doi:10.1182/blood-2007-11-122101.
- Bryce AH, Ketterling RP, Gertz MA, Lacy M, Knudson RA, Kumar S, Kyle RA, Fonseca R, Greipp PR, Lust JA, et al. A novel report of cig-FISH and cytogenetics in POEMS syndrome. Am J Hematol. 2008;83:840–841. doi:10.1002/ajh.21285.
- Shaffer AL, Rosenwald A, Staudt LM. Lymphoid malignancies: the dark side of B-cell differentiation. Nat Rev Immunol. 2002;2:920–932. doi:10.1038/nri953.
- Bergsagel PL, Kuehl WM. Molecular pathogenesis and a consequent classification of multiple myeloma. J Clin Oncol. 2005;23:6333–6338. doi:10.1200/JCO.2005.05.021.
- Schmitz R, Renne C, Rosenquist R, Tinguely M, Distler V, Menestrina F, Lestani M, Stankovic T, Austen B, Bräuninger A, et al. Insights into the multistep transformation process of lymphomas: igH-associated translocations and tumor suppressor gene mutations in clonally related composite Hodgkin’s and non-Hodgkin’s lymphomas. Leukemia. 2005;19:1452–1458. doi:10.1038/sj.leu.2403841.
- Chesi M, Bergsagel PL. Many multiple myelomas: making more of the molecular mayhem. Hematology Am Soc Hematol Educ Program. 2011;2011:344–353. doi:10.1182/asheducation-2011.1.344.
- Egan JB, Shi CX, Tembe W, Christoforides A, Kurdoglu A, Sinari S, Middha S, Asmann Y, Schmidt J, Braggio E, et al. Whole-genome sequencing of multiple myeloma from diagnosis to plasma cell leukemia reveals genomic initiating events, evolution, and clonal tides. Blood. 2012;120:1060–1066. doi:10.1182/blood-2012-01-405977.
- Martinez-Garcia E, Popovic R, Min DJ, Sweet SM, Thomas PM, Zamdborg L, Heffner A, Will C, Lamy L, Staudt LM, et al. The MMSET histone methyl transferase switches global histone methylation and alters gene expression in t(4;14) multiple myeloma cells. Blood. 2011;117:211–220. doi:10.1182/blood-2010-07-298349.
- Raje N, Hideshima T, Mukherjee S, Raab M, Vallet S, Chhetri S, Cirstea D, Pozzi S, Mitsiades C, Rooney M, et al. Preclinical activity of P276-00, a novel small-molecule cyclin-dependent kinase inhibitor in the therapy of multiple myeloma. Leukemia. 2009;23:961–970. doi:10.1038/leu.2008.378.
- Mouse Genome Sequencing C, Waterston RH, Lindblad-Toh K, Birney E, Rogers J, Abril JF, Agarwal P, Agarwala R, Ainscough R, Alexandersson M, et al. Initial sequencing and comparative analysis of the mouse genome. Nature. 2002;420:520–562. doi:10.1038/nature01262.
- Visel A, Rubin EM, Pennacchio LA. Genomic views of distant-acting enhancers. Nature. 2009;461:199–205. doi:10.1038/nature08451.
- Gerstein MB, Kundaje A, Hariharan M, Landt SG, Yan KK, Cheng C, Mu XJ, Khurana E, Rozowsky J, Alexander R, et al. Architecture of the human regulatory network derived from ENCODE data. Nature. 2012;489:91–100. doi:10.1038/nature11245.
- Thurman RE, Rynes E, Humbert R, Vierstra J, Maurano MT, Haugen E, Sheffield NC, Stergachis AB, Wang H, Vermot B, et al. The accessible chromatin landscape of the human genome. Nature. 2012;489:75–82. doi:10.1038/nature11232.
- Neph S, Vierstra J, Stergachis AB, Reynolds AP, Haugen E, Vernot B, Thurman RE, John S, Sandstrom R, Johnson AK, et al. An expansive human regulatory lexicon encoded in transcription factor footprints. Nature. 2012;489:83–90. doi:10.1038/nature11212.
- Yancopoulos GD, Alt FW. Regulation of the assembly and expression of variable-region genes. Annu Rev Immunol. 1986;4:339–368. doi:10.1146/annurev.iy.04.040186.002011.
- Staudt LM, Lenardo MJ. Immunoglobulin gene transcription. Annu Rev Immunol. 1991;9:373–398. doi:10.1146/annurev.iy.09.040191.002105.
- Vincent-Fabert C, Fiancette R, Pinaud E, Truffinet V, Cogne N, Cogne M, Denizot Y. Genomic deletion of the whole IgH 3ʹ regulatory region (hs3a, hs1,2, hs3b, and hs4) dramatically affects class switch recombination and Ig secretion to all isotypes. Blood. 2010;116:1895–1898. doi:10.1182/blood-2010-01-264689.
- Kuzin II, Bagaeva L, Young FM, Bottaro A. Requirement for enhancer specificity in immunoglobulin heavy chain locus regulation. J Immunol. 2008;180:7443–7450.
- Corcoran LM, Cory S, Adams JM. Transposition of the immunoglobulin heavy chain enhancer to the myc oncogene in a murine plasmacytoma. Cell. 1985;40:71–79.
- Wang J, Boxer LM. Regulatory elements in the immunoglobulin heavy chain gene 3ʹ-enhancers induce c-myc deregulation and lymphomagenesis in murine B cells. J Biol Chem. 2005;280:12766–12773. doi:10.1074/jbc.M412446200.
- Dildrop R, Ma A, Zimmerman K, Hsu E, Tesfaye A, DePinho R, Alt Fw. IgH enhancer-mediated deregulation of N-myc gene expression in transgenic mice: generation of lymphoid neoplasias that lack c-myc expression. Embo J. 1989;8:1121–1128.
- Dolloff NG, Allen JE, Dicker DT, Aqui N, Vogl D, Malysz J, Talamo G, El-Deiry WS. Sangivamycin-like molecule 6 exhibits potent anti-multiple myeloma activity through inhibition of cyclin-dependent kinase-9. Mol Cancer Ther. 2012;11:2321–2330. doi:10.1158/1535-7163.MCT-12-0578.
- Tantin D, Sharp PA. Mouse lymphoid cell line selected to have high immunoglobulin promoter activity. Mol Cell Biol. 2002;22:1460–1473.
- Mills FC, Fisher LM, Kuroda R, Ford AM, Gould HJ. DNase I hypersensitive sites in the chromatin of human mu immunoglobulin heavy-chain genes. Nature. 1983;306:809–812.
- Rabbitts TH, Forster A, Baer R, Hamlyn PH. Transcription enhancer identified near the human C mu immunoglobulin heavy chain gene is unavailable to the translocated c-myc gene in a Burkitt lymphoma. Nature. 1983;306:806–809.
- Calame K, Sen R. Chapter 6 - Transcription of Immunoglobulin Genes. In: Neuberger THWAS, editor Molecular Biology of B Cells. Burlington (MA, USA): Academic Press; 2003. p. 83–100.
- Banerji J, Olson L, Schaffner W. A lymphocyte-specific cellular enhancer is located downstream of the joining region in immunoglobulin heavy chain genes. Cell. 1983;33:729–740.
- Gillies SD, Morrison SL, Oi VT, Tonegawa S. A tissue-specific transcription enhancer element is located in the major intron of a rearranged immunoglobulin heavy chain gene. Cell. 1983;33:717–728.
- Cheung WC, Kim JS, Linden M, Peng L, Van Ness B, Polakiewicz RD, Janz S. Novel targeted deregulation of c-Myc cooperates with Bcl-X(L) to cause plasma cell neoplasms in mice. J Clin Invest. 2004;113:1763–1773. doi:10.1172/JCI20369.
- Boylan KL, Gosse MA, Staggs SE, Janz S, Grindle S, Kansas GS, Van Ness BG. A transgenic mouse model of plasma cell malignancy shows phenotypic, cytogenetic, and gene expression heterogeneity similar to human multiple myeloma. Cancer Res. 2007;67:4069–4078. doi:10.1158/0008-5472.CAN-06-3699.
- Gonzalez D, Gonzalez M, Balanzategui A, Sarasquete ME, Lopez-Perez R, Chillon MC, García-Sanz R, San Miguel JF. Molecular characteristics and gene segment usage in IGH gene rearrangements in multiple myeloma. Haematologica. 2005;90:906–913.
- Wuerffel R, Wang L, Grigera F, Manis J, Selsing E, Perlot T, Alt FW, Cogne M, Pinaud E, Kenter AL. S-S synapsis during class switch recombination is promoted by distantly located transcriptional elements and activation-induced deaminase. Immunity. 2007;27:711–722. doi:10.1016/j.immuni.2007.09.007.
- Pinaud E, Khamlichi AA, Le Morvan C, Drouet M, Nalesso V, Le Bert M, Al E. Localization of the 3ʹ IgH locus elements that effect long-distance regulation of class switch recombination. Immunity. 2001;15:187–199.
- Lieberson R, Ong J, Shi X, Eckhardt LA. Immunoglobulin gene transcription ceases upon deletion of a distant enhancer. Embo J. 1995;14:6229–6238.
- Bobo B, Phelan D, Rebhahn J, Piepenbrink MS, Zheng B, Mosmann TR, Kobie JJ, DeLouise LA. Microbubble array diffusion assay for the detection of cell secreted factors. Lab Chip. 2014;14:3640–3650. doi:10.1039/c4lc00580e.
- Stessman HA, Lulla A, Xia T, Mitra A, Harding T, Mansoor A, Myers CL, Van Ness BG, Dolloff NG. High-throughput drug screening identifies compounds and molecular strategies for targeting proteasome inhibitor-resistant multiple myeloma. Leukemia. 2014;28:2263–2267. doi:10.1038/leu.2014.214.
- Krem MM, Press OW, Horwitz MS, Tidwell T. Mechanisms and clinical applications of chromosomal instability in lymphoid malignancy. Br J Haematol. 2015;171:13–28. doi:10.1111/bjh.13507.
- Cancer facts & figures 2015. Atlanta (GA, USA): American Cancer Society; 2015.
- Mitelman F, Johansson B, Mertens F. The impact of translocations and gene fusions on cancer causation. Nat Rev Cancer. 2007;7:233–245. doi:10.1038/nrc2091.
- Matthias P. Lymphoid-specific transcription mediated by the conserved octamer site: who is doing what?. Semin Immunol. 1998;10:155–163. doi:10.1006/smim.1998.0117.
- Roy AL, Sen R, Roeder RG. Enhancer-promoter communication and transcriptional regulation of Igh. Trends Immunol. 2011;32:532–539. doi:10.1016/j.it.2011.06.012.
- Tang H, Sharp PA. Transcriptional regulation of the murine 3ʹ IgH enhancer by OCT-2. Immunity. 1999;11::517–526.
- Luo Y, Fujii H, Gerster T, Roeder RG. A novel B cell-derived coactivator potentiates the activation of immunoglobulin promoters by octamer-binding transcription factors. Cell. 1992;71:231–241.
- Kim U, Qin XF, Gong S, Stevens S, Luo Y, Nussenzweig M, Roeder RG. The B-cell-specific transcription coactivator OCA-B/OBF-1/Bob-1 is essential for normal production of immunoglobulin isotypes. Nature. 1996;383:542–547. doi:10.1038/383542a0.
- Stevens S, Ong J, Kim U, Eckhardt LA, Roeder RG. Role of OCA-B in 3ʹ-IgH enhancer function. J Immunol. 2000;164:5306–5312.
- Ren X, Siegel R, Kim U, Roeder RG. Direct interactions of OCA-B and TFII-I regulate immunoglobulin heavy-chain gene transcription by facilitating enhancer-promoter communication. Mol Cell. 2011;42:342–355. doi:10.1016/j.molcel.2011.04.011.
- Duan H, Xiang H, Ma L, Boxer LM. Functional long-range interactions of the IgH 3ʹ enhancers with the bcl-2 promoter region in t(14;18) lymphoma cells. Oncogene. 2008;27:6720–6728. doi:10.1038/onc.2008.286.
- Bain G, Gruenwald S, Murre C. E2A and E2-2 are subunits of B-cell-specific E2-box DNA-binding proteins. Mol Cell Biol. 1993;13:3522–3529.
- Chatterjee S, Ju Z, Hassan R, Volpi SA, Emelyanov AV, Birshtein BK. Dynamic changes in binding of immunoglobulin heavy chain 3ʹ regulatory region to protein factors during class switching. J Biol Chem. 2011;286:29303–29312. doi:10.1074/jbc.M111.243543.
- Liu H, Schmidt-Supprian M, Shi Y, Hobeika E, Barteneva N, Jumaa H, Pelanda R, Reth M, Skok J, Rajewsky K, et al. Yin Yang 1 is a critical regulator of B-cell development. Genes Dev. 2007;21:1179–1189. doi:10.1101/gad.1529307.
- Gordon SJ, Saleque S, Birshtein BK, Yang Y. 1 is a lipopolysaccharide-inducible activator of the murine 3ʹ Igh enhancer, hs3. J Immunol. 2003;170:5549–5557.
- Garrett FE, Emelyanov AV, Sepulveda MA, Flanagan P, Volpi S, Li F, Loukinov D, Eckhardt LA, Lobanenkov VV, Birshtein BK. Chromatin architecture near a potential 3ʹ end of the igh locus involves modular regulation of histone modifications during B-Cell development and in vivo occupancy at CTCF sites. Mol Cell Biol. 2005;25:1511–1525. doi:10.1128/MCB.25.4.1511-1525.2005.
- Lu ZP, Ju ZL, Shi GY, Zhang JW, Sun J. Histone deacetylase inhibitor Trichostatin A reduces anti-DNA autoantibody production and represses IgH gene transcription. Biochem Biophys Res Commun. 2005;330:204–209. doi:10.1016/j.bbrc.2005.02.147.
- Tusi BK, Deng C, Salz T, Zeumer L, Li Y, So CW, Morel LM, Qiu Y, Huang S. Setd1a regulates progenitor B-cell-to-precursor B-cell development through histone H3 lysine 4 trimethylation and Ig heavy-chain rearrangement. FASEB J. 2015;29:1505–1515. doi:10.1096/fj.14-263061.
- Michaelson JS, Singh M, Snapper CM, Sha WC, Baltimore D, Birshtein BK. Regulation of 3ʹ IgH enhancers by a common set of factors, including kappa B-binding proteins. J Immunol. 1996;156:2828–2839.
- Sepulveda MA, Emelyanov AV, Birshtein BK. NF-kappa B and Oct- 2synergize to activate the human 3ʹ Igh hs4 enhancer in B cells. J Immunol. 2004;172:1054–1064.