
ABSTRACT
Triple-negative breast cancer (TNBC) has a poor prognosis mainly due to insensitivity or resistance to standard anthracycline- and taxane-based chemotherapy, urgently calling for new adjuvants to reverse drug resistance. Dual-target murine double minute 2 (MDM2) and murine double minute X (MDMX) inhibitor has been proved to play a critical part against cancer, particularly focusing on the tremendous potential to enhance the efficacy of doxorubicin (DOX), however little was reported in TNBC. In the present study, we investigated the synergistic antitumor effect of the MDM2/MDMX inhibitor with DOX using three TNBC cell lines, two in situ transplantation tumor models and 214 clinical samples. We observed that the MDM2/MDMX inhibitor combined with DOX could not only inhibit cell vitality and migration and invasion abilities, but also highly inhibit tumor growth in TNBC nude mice. Besides, co-treatment of MDM2/MDMX inhibitor and DOX suppressed epithelial to mesenchymal transition (EMT) through increasing the TAK1-binding protein 1 (TAB1), transforming growth factor β-activated kinase 1 (TAK1) and p38 mitogen-activated protein kinase (MAPK) expression. Small interfering RNA-mediated TAB1 knockdown induced the EMT, desensitized cells to DOX and enhanced the migration and invasion abilities. High MDM2/MDMX expression was positively associated with weak TAB1 expression in 214 TNBC tumor tissues confirmed by immumohistochemical staining and MDM2/MDMX/TAB1 expression was significantly related to TNBC patient survival. These findings indicate that dual-target MDM2/MDMX inhibitor could increase the sensitization of doxorubicin and inhibit migration and invasion abilities in TNBC cells through p38 MAPK pathway activation caused EMT suppression and hence could be useful in TNBC treatments in future.
Introduction
Breast cancer remains the most common cancer and the second lethal cancer for women in America.Citation1 There were about 272,400 breast cancer cases newly diagnosed, and about 70,700 cases died from breast cancer in 2015 in China.Citation2 Triple-negative breast cancer (TNBC), characterized by absence or minimal expression of estrogen receptor (ER) and progesterone receptor (PR) and lack of the human epidermal growth factor receptor 2 (Her2) amplification, is an aggressive subtype accounting for 15%–20% of all breast cancer cases. Although endocrinotherapy is ineffective and little targeted therapies are available, TNBC patients respond well to standard anthracycline- and taxane-based chemotherapy.Citation3,Citation4 Even so, TNBC patients still have a poor long-term prognosis due to insensitivity or resistance to first-line chemotherapeutic drug doxorubicin (DOX), further leading to high rates of tumor recurrence and metastasis.Citation5 Therefore, it’s imperative to explore new adjuvants to reverse resistance and increase sensitization of doxorubicin.
The tumor suppressor p53 plays a crucial role in many intracellular processes responding to stress signals,Citation6 but its mutation or functionally inactivation expedites tumorigenesis and progression.Citation7 P53 reactivation offers an attractive anticancer strategyCitation8 by the application of two major p53 negative regulators MDM2 and MDMX.Citation9–Citation11 However, targeting the p53-MDM2 interaction merely to reactivate p53 has proved to be insufficient in MDMX overexpressed cancers,Citation12,Citation13 and optimal p53 reactivation may only be achieved by targeting both MDM proteins simultaneously.Citation14 Several relevant works focus on dual-target MDM2/MDMX inhibitors recently. Yong S. Chang et al reported that ATSP-7041 possessed robust drug-like properties and on-mechanism in vitro and in vivo activity.Citation15 Jiang-Jiang Qin et al designed Inulanolide A, which disrupted MDM2-MDMX binding, and showed its inhibitory effects on the proliferation and invasion of prostate cancer cells.Citation16 Joana Soares et al described the synthesis of DIMP53-1 and exhibited its multi-functional activity targeting major hallmarks of cancer through its anti-proliferative, proapoptotic, antiangiogenic, anti-invasive, and antimigratory properties.Citation17 Obviously, the availability of the reported dual-target MDM2/MDMX inhibitors is still limited and they mostly concentrate on in vitro and in vivo fundamental research.
Thereupon, we designed a new dual-target MDM2/MDMX inhibitor using E. coli, which contains the transactivator peptide for transduction across membranes to raise efficiency. This protein could not only suppress cell viability, promote cell cycle arrest and apoptosis of MCF-7 and ZR-75–30 cells, Citation18 but also reverse DOX resistance in the wild-type p53 breast cancer cells in our precious study. Owing to the comprehensive role of p53 pathway,Citation6 we also expect the potential therapeutical effect of the dual-target MDM2/MDMX inhibitor in the frequently DOX-resistant TNBC. An interesting question was posed out as to whether dual-target MDM2/MDMX inhibitor could increase the curative effect of DOX in TNBC. As the role of MDM2/MDMX inhibitor has not been thoroughly studied in TNBC, we first investigated it using DOX-resistant DOX /DOX cells and three sensitive TNBC cell lines DOX, HCC1937 and MDA-MB-468 cells, verified the protein’s synergistic effect with DOX in vivo using TNBC nude mouse models, and explored the underlying mechanism with small interfering RNA (siRNA) and 214 TNBC clinical specimens.
Results
P53- and epithelial to mesenchymal transition (EMT)-related protein expression in DOX-resistant TNBC cells
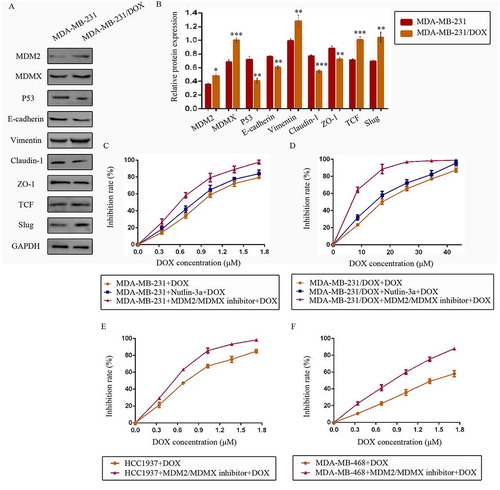
At first, we explored the possible mechanism of DOX resistance in DOX /DOX cells. Western bolt was used to detect cellular protein expression. For p53 pathway, tumor suppressor p53 expression was lower, whereas its negative regulators MDM2 and MDMX were higher in MDA-MB-231/DOX cells compared with the parental sensitive cells. As critical proteins or transcription factors of EMT pathway, low-expressed E-cadherin, Claudin-1, ZO-1 and over-expressed Vimentin, TCF, Slug was observed in MDA-MB-231/DOX cells (,)). These results provided the evidence that DOX resistance of MDA-MB-231/DOX cells was connected with p53 loop and EMT pathway.
Figure 1. The expression levels of the p53- and EMT-related proteins in drug-resistant cells and the corresponding drug-sensitive cells were determined using western blot analysis. The results are representative of three independent experiments (a) and quantified data are presented as the mean ± SD. *P < 0.05, **P < 0.01, ***P < 0.001 vs. the corresponding drug-sensitive cells (b). GAPDH was used as a loading control. Cells were treated with the indicated agents for 24 h, and cell survival was measured by an SRB assay in order to prove that the MDM2/MDMX inhibitor enhanced DOX-induced cytotoxicity in TNBC cells. The growth curves of specific treatments are shown: MDA-MB-231 treated with DOX alone or in combination with the nutlin-3a or MDM2/MDMX inhibitor (c), MDA-MB-231/DOX treated with DOX alone or in combination with the nutlin-3a or MDM2/MDMX inhibitor (d), HCC1937 treated with DOX alone or in combination with the MDM2/MDMX inhibitor (e) and MDA-MB-468 treated with DOX alone or in combination with the MDM2/MDMX inhibitor (f). The concentrations of nutlin-3a used in MDA-MB-231 and MDA-MB-231/DOX cells were 25.36 µM and 25.69 µM respectively. The concentration of the MDM2/MDMX inhibitor in MDA-MB-231, MDA-MB-231/DOX, HCC1937 and MDA-MB-468 cells was 33.16 nM, 38.28 nM, 36.78 nM and 41.49 nM respectively.
MDM2/MDMX inhibitor could sensitize TNBC cells to DOX
Since we have investigated the antitumor activity of MDM2/MDMX inhibitor in previous research,Citation18 our objective was to investigate its synergistic effect with DOX in the current study. Cells were treated with different concentrations of MDM2/MDMX inhibitor or a well-studied small-molecule p53-MDM2 inhibitor nutlin-3a as a comparison. Drug concentration-inhibition rate curves were plotted after Sulforhodamine B (SRB) assays, showing that both nutlin-3a and MDM2/MDMX inhibitor inhibited the viability of TNBC cells in a dose-dependent manner, but MDM2/MDMX inhibitor had a stronger antitumor effect. The IC10 values of MDM2/MDMX inhibitor and nutlin-3a were calculated, which were used as the working concentrations in the following experiments to avoid amounts of tumor cells dying from the inhibitors’ toxicity. The IC10 values of the MDM2/MDMX inhibitor in MDA-MB-231, MDA-MB-231/DOX, HCC1937 and MDA-MB-468 cells were 33.16 ± 0.52 nM, 38.28 ± 5.69 nM, 36.78 ± 4.66 nM and 41.49 ± 0.46 nM respectively, and correspondingly the IC10 values of nutlin-3a in MDA-MB-231 and MDA-MB-231/DOX were 25.36 ± 4.77 µM and 25.69 ± 4.01 µM.
Cells were exposed to various concentrations of DOX with/without combination of nutlin-3a or MDM2/MDMX inhibitor, and the DOX concentration-cell viability curves in different TNBC cells were also plotted (–)). The IC50 values of DOX in MDA-MB-231 and MDA-MB-231/DOX cells were 0.88 ± 0.03 µM and 17.07 ± 0.33 µM separately, with a resistant fold of 19.40. The IC50 values of DOX in HCC1937 and MDA-MB-468 cells were 0.71 ± 0.05 µM and 1.45 ± 0.12 µM separately. MDM2/MDMX inhibitor separately decreased the IC50 values of DOX in MDA-MB-231, HCC1937 and MDA-MB-468 cells to 0.57 ± 0.03 µM, 0.52 ± 0.02 µM and 0.76 ± 0.03 µM, demonstrating that it could sensitize TNBC cells to DOX. MDM2/MDMX inhibitor decreased the IC50 values of DOX in MDA-MB-231/DOX to 6.86 ± 0.52 µM, indicating that it could significantly reverse the DOX resistance of MDA-MB-231/DOX cells. In addition, nutlin-3a also decreased the IC50 values of DOX in MDA-MB-231 and MDA-MB-231/DOX cells to 0.76 ± 0.02 µM and 13.91 ± 1.29 µM separately. However, MDM2/MDMX inhibitor was obviously a superior synergist with DOX in TNBC cells.
MDM2/MDMX inhibitor in combination with DOX could inhibit migration and invasion of TNBC cells
Transwell assays showed that co-treatment of MDM2/MDMX inhibitor and DOX significantly reduced transmenbrance cell number, which represented the ability of cell invasion in vitro, compared with the control groups, the DOX only groups and the MDM2/MDMX inhibitor alone groups in both DOX-resistant and sensitve TNBC cells (,)).
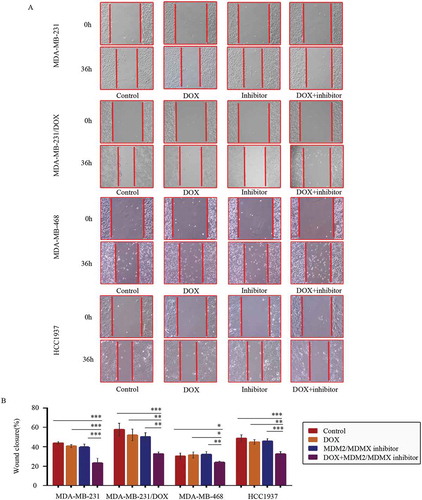
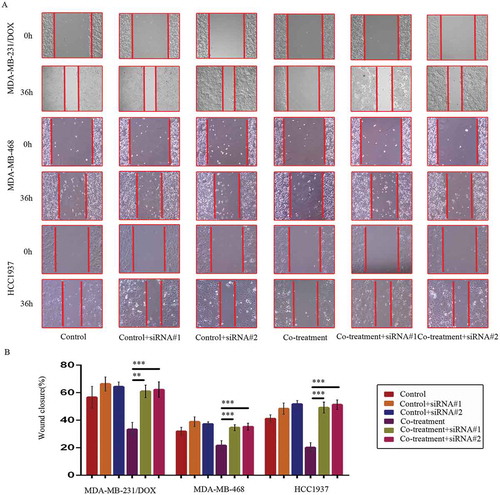
At 36 h after the wound-healing scratches were made, the gap widths of the co-treatment groups were significantly larger than the control groups, the DOX only groups and the MDM2/MDMX inhibitor alone groups in all TNBC cell lines (,)), indicating that the MDM2/MDMX inhibitor in combination with DOX could inhibit migration of both DOX-resistant and sensitve TNBC cells.
Figure 2. MDM2/MDMX inhibitor in combination with DOX inhibit TNBC cell invasion. Cells were treated with the indicated agents for 24 h, and cell invasion was detected using transwell assay. The concentrations of each agent were used as follow: DOX 0.29 µM in MDA-MB-231 cells, 5.14 µM in MDA-MB-231/DOX cells, 0.36 µM in MDA-MB-468 cells and 0.22 µM in HCC1937 cells, the MDM2/MDMX inhibitor 33.16 nM in MDA-MB-231 cells, 38.28 nM in MDA-MB-231/DOX cells, 41.49 nM in MDA-MB-468 cells and 36.78 nM in HCC1937 cells. The representative charts (a) and quantified data (b) of transwell are separately shown. The values presented are indicative of the mean ± SD for each group. *P < 0.05, **P < 0.01, ***P < 0.001 (n = 3) vs. the control group, the DOX only group or the MDM2/MDMX inhibitor group.
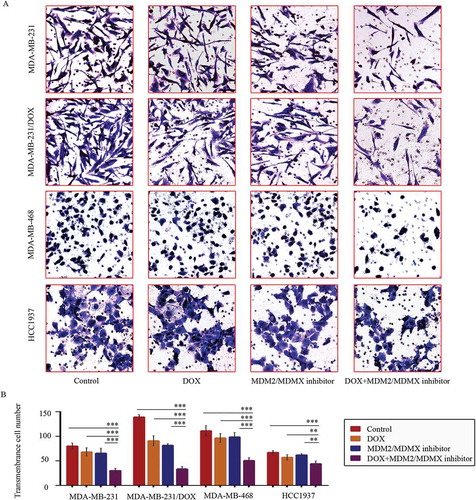
Figure 3. MDM2/MDMX inhibitor in combination with DOX inhibit TNBC cell migration. Cells were treated with the indicated agents for 24 h, and cell migration was detected using wound healing assay. The concentrations of each agent were used as follow: DOX 0.29 µM in MDA-MB-231 cells, 5.14 µM in MDA-MB-231/DOX cells, 0.36 µM in MDA-MB-468 cells and 0.22 µM in HCC1937 cells, the MDM2/MDMX inhibitor 33.16 nM in MDA-MB-231 cells, 38.28 nM in MDA-MB-231/DOX cells, 41.49 nM in MDA-MB-468 cells and 36.78 nM in HCC1937 cells. The representative charts (a) and quantified data (b) of wound healing assay are separately shown. The values presented are indicative of the mean ± SD for each group. *P < 0.05, **P < 0.01, ***P < 0.001 (n = 3) vs. the control group, the DOX only group or the MDM2/MDMX inhibitor group.
MDM2/MDMX inhibitor in combination with DOX inhibit tumor growth and EMT in vivo
Two TNBC in situ xenograft models were constructed in nude mice to explore the synergistic effect of MDM2/MDMX inhibitor with DOX in vivo. Mice were assigned to four groups and received different treatments as the average tumor volume reached ~200 mm3. The body weights of mice and tumor volumes were recorded every other day. No significant loss of body weight was detected among mice in the combination group, suggesting that the regimen of combined treatment at the indicated dose did not cause toxicity in mice.
For the MDM-MB-231 model, tumor volumes in the co-treatment group, DOX alone group and MDM2/MDMX inhibitor alone group were all significantly smaller than the control group on day 3 after treatment, but there wasn’t any difference in the three groups. However since day 6, tumor volumes in the co-treatment group began to be significantly smaller than any other groups until mice executed. Tumor volumes in DOX alone group and MDM2/MDMX inhibitor alone group remained significantly smaller than the normal saline group, revealing that DOX or MDM2/MDMX inhibitor alone could also inhibit tumor growth, but their effects were inferior to the co-treatment group (,)). The inhibition rates (IRs) of the DOX alone group, MDM2/MDMX inhibitor alone group and co-treatment group were 33.8%, 38.1% and 65.5% separately.
Figure 4. MDM2/MDMX inhibitor could enhance the curative effect of DOX in TNBC nude mice. Each mice was injected 1 × 10⁷ TNBC cells re-suspended in PBS mixed with matrigel into the mammary fat pad. When the tumors were approximately 200 mm3, tumor-bearing mice were randomly divided into four groups (six in each group) and treated with the following regimens: Normal saline; DOX alone (2.5 mg/kg, iv, twice per week); MDM2/MDMX inhibitor alone (10 mg/kg, iv, d1–3); and the combination of MDM2/MDMX inhibitor and DOX. The body weights of mice and tumor volumes were recorded every other day. The tumor volumes (a, c) and original tumors (b, c) are shown. The values presented are the mean ± SD for each group. *P < 0.05, **P < 0.01, ***P < 0.001 (n = 6) vs. the control group, the DOX only group or the MDM2/MDMX inhibitor alone group.
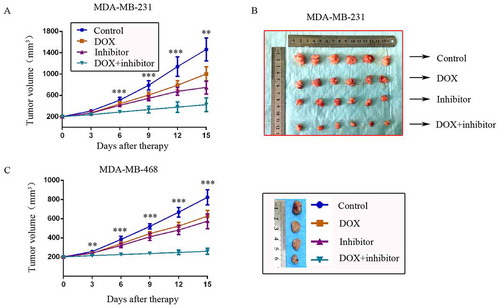
For the MDM-MB-468 model, although DOX or MDM2/MDMX inhibitor alone could also inhibit tumor growth, tumor volumes in the co-treatment group were significantly smaller than any other groups since day 3 until mice executed ()). The IRs of the DOX alone group, MDM2/MDMX inhibitor alone group and co-treatment group were 29.2%, 37.3% and 71.1% separately.
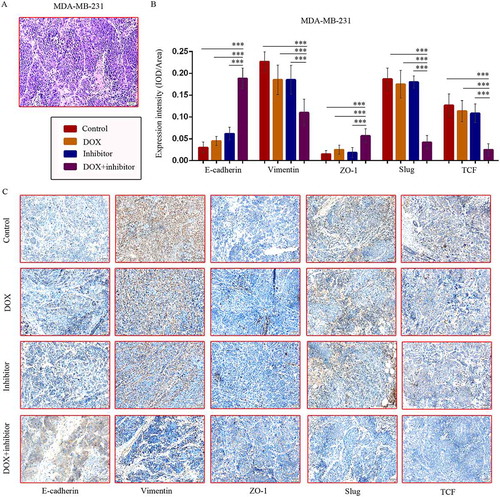
In addition, hematoxylin-eosin ()) and immunohistochemical (IHC) staining of tumor tissue sections from the MDM-MB-231 model showed increased E-cadherin and ZO-1 protein levels, and decreased Vimentin, Slug, TCF levels in co-treatment group tumor tissues (,)), representing repressed EMT.
Figure 5. MDM2/MDMX inhibitor in combination with DOX could suppress EMT in TNBC nude mice. TNBC nude mice were killed and tumor tissues were excised and fixed in 10% neutral buffered formalin for pathological analysis. Representative hematoxylin-eosin (a) and IHC (c) staining for E-cadherin, Vimentin, ZO-1, Slug and TCF are also presented. Bars: 50μm. Expression intensity was calculated as IOD/Area (b). The values presented are the mean ± SD for each group. *P < 0.05, **P < 0.01, ***P < 0.001 (n = 6) vs. the control group, the DOX only group or the MDM2/MDMX inhibitor alone group.
MDM2/MDMX inhibitor in combination with DOX could attenuate EMT in vitro
EMT has been reported as a pivotal program associated with invasion and metastasis in human cancers.Citation19–Citation21 Morever, emerging evidences arise proving that EMT has a molecular and phenotypic association with chemoresistance.Citation22–Citation24 Xiaofeng Zheng et al reported that Snail or Twist induced EMT program promotes chemoresistance in pancreatic cancer.Citation25 Kari R. Fischer et al suggested co-treatment of EMT-targeting strategy in conjunction with conventional chemotherapies to confront breast cancer.Citation26 According to these reports, we could assume that EMT program concerned with DOX resistance and migration and invasion, which could be inhibited by co-treatment with MDM2/MDMX inhibitor and DOX in the current study.
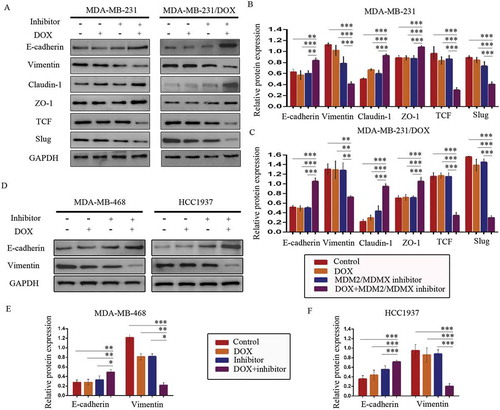
Co-treatment with MDM2/MDMX inhibitor and DOX increased E-cadherin, Claudin-1, ZO-1 expression, meanwhile decreased Vimentin, TCF, Slug protein levels in both DOX-resistant and sensitve TNBC cells (–)), which revealed that MDM2/MDMX inhibitor in combination with DOX actually inhibited the EMT pathway of TNBC cells. Combining the research on EMT program promoting metastasis and chemoresistance,Citation19–Citation26 we could make a conclusion that MDM2/MDMX inhibitor sensitized TNBC cells to DOX and inhibited the migration and invasion abilities by suppressing EMT program.
Figure 6. MDM2/MDMX inhibitor in combination with DOX could suppress EMT in TNBC cells. Cells were treated with the indicated agents for 24 h and lysed. The concentrations of each agent were used as follow: DOX 0.29 µM in MDA-MB-231 cells, 5.14 µM in MDA-MB-231/DOX cells, 0.36 µM in MDA-MB-468 cells and 0.22 µM in HCC1937 cells, the MDM2/MDMX inhibitor 33.16 nM in MDA-MB-231 cells, 38.28 nM in MDA-MB-231/DOX cells, 41.49 nM in MDA-MB-468 cells and 36.78 nM in HCC1937 cells. Western blot analysis was performed and confirmed that co-treatment with MDM2/MDMX inhibitor and DOX could suppress EMT in TNBC cells. The representative charts (a, d) and quantified data (b-c, e-f) are shown. *P < 0.05, **P < 0.01, ***P < 0.001 (n = 3) vs. the control group, the DOX group or the MDM2/MDMX inhibitor group. The values presented are indicative of the mean ±SD for each group. GAPDH was used as a loading control.
MDM2/MDMX inhibitor inhibited TNBC cells by activating p38 mitogen-activated protein kinase (MAPK) pathway
P38, as a subgroup of MAPKs, is activated by a variety of environmental stresses and inflammatory cytokines, and implicated in a wide range of complex biologic processes.Citation27,Citation28 TAK1-binding protein 1 (TAB1), an activator of transforming growth factor β-activated kinase 1 (TAK1) and of p38 MAPK, was reported to inhibit the E3 ligase activity of MDM2 toward p53 and MDMX, thereby enhancing p53 activation.Citation29
According to the interaction of MDM2/MDMX and TAB1, we speculated that MDM2/MDMX inhibitor might bring about a change of TAB1/TAK1/p38 MAPK pathway. Subsequently, western blot analysis was applied to confirm that co-treatment of MDM2/MDMX inhibitor and DOX could actually lead to TAB1, TAK1 and p38 MAPK overexpression in MDA-MB-231/DOX cells (,)), demonstrating that the curable effects of MDM2/MDMX inhibitor was through activating TAB1/TAK1/p38 MAPK pathway.
Figure 7. MDM2/MDMX inhibitor in combination with DOX works through activating TAB1/TAK1/p38 MAPK pathway in TNBC cells. Cells were treated with the indicated agents for 24 h and lysed. The concentrations of each agent were used as follow: DOX 5.14 µM in MDA-MB-231/DOX cells, 0.36 µM in MDA-MB-468 cells and 0.22 µM in HCC1937 cells, the MDM2/MDMX inhibitor 38.28 nM in MDA-MB-231/DOX cells, 41.49 nM in MDA-MB-468 cells and 36.78 nM in HCC1937 cells. Western blot analysis was performed and confirmed that co-treatment with MDM2/MDMX inhibitor and DOX could lead to TAB1/TAK1/p38 MAPK overexpression in MDA-MB-231/DOX cells. The representative charts (a) and quantified data (b) are shown. *P < 0.05, **P < 0.01, ***P < 0.001 (n = 3) vs. the control group, the DOX group or the MDM2/MDMX inhibitor group. Cells were transfected with siRNA#1 or siRNA#2 following co-treatment with MDM2/MDMX inhibitor and DOX for 24 hours to detect the effect of TAB1 knockdown by western blot, with appropriate agent dosages at 1:2 (siRNA: Lipofectamine 2000; μg:μg). Western blot analysis of TAB1, TAK1, p38 MAPK, E-cadherin, Vimentin, Claudin-1, ZO-1, TCF and Slug expression including the representative charts (c, f) and the quantified data (d-e, g) are shown. *P < 0.05, **P < 0.01, ***P < 0.001 (n = 3) vs. co-treatment group transfected with siRNA#1 or siRNA#2. The values presented are indicative of the mean ± SD for each group. GAPDH was used as a loading control.
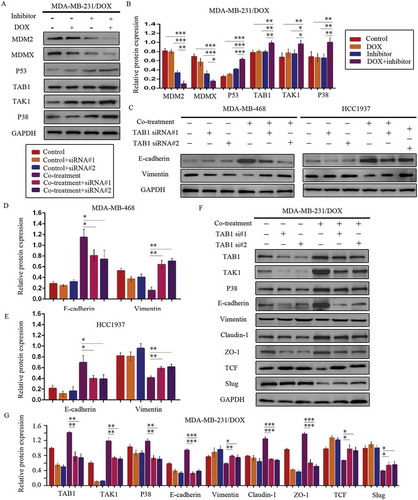
Since the relationship between p38 MAPK and EMT,Citation30–Citation32 we speculated that the activation of TAB1/TAK1/p38 MAPK pathway caused by MDM2/MDMX inhibitor inhibited EMT program, sequentially increased DOX sensibility and inhibited the migration and invasion abilities of TNBC cells. To investigate the moderating effect of TAB1/TAK1/p38 MAPK pathway on EMT, we used siRNA to knockdown TAB1 in TNBC cells. Western blot analysis revealed that siRNA-mediated TAB1 knockdown reserved EMT suppression caused by the MDM2/MDMX inhibitor ()).
We investigated DOX sensibility and migration and invasion situation of TNBC cells caused by siRNA-mediated TAB1 knockdown. After TAB1 knockdown by siRNA#1, the IC50 values of DOX in MDA-MB-231/DOX, HCC1937 and MDA-MB-468 cells increased to 11.74 ± 1.34 µM, 0.66 ± 0.03 µM and 1.31 ± 0.05 µM separately. Cells displayed decreased sensibility to DOX, and moreover, increased ability of migration and invasion ( & ). These results demonstrated that MDM2/MDMX inhibitor suppressed the EMT, enhanced the DOX sensibility, and inhibited cell migration and invasion of TNBC cells through activating TAB1/TAK1/p38 MAPK pathway.
Figure 8. SiRNA-mediated TAB1 knockdown increased invasion ability of TNBC cells. Cells were transfected with siRNA#1 or siRNA#2 following co-treatment with MDM2/MDMX inhibitor and DOX for 24 hours with appropriate agent dosages at 1:2 (siRNA: Lipofectamine 2000; μg:μg). The concentrations of agents were used as follow: DOX 5.14 μM in MDA-MB-231/DOX cells, 0.36 μM in MDA-MB-468 cells and 0.22 μM in HCC1937 cells, the MDM2/MDMX inhibitor 38.28 nM in MDA-MB-231/DOX cells, 41.49 nM in MDA-MB-468 cells and 36.78 nM in HCC1937 cells. Representative images (a) and quantified data (b) of transwell assay are shown. The values presented are the means ± SD for each group. *P < 0.05, **P < 0.01, ***P < 0.001 (n = 3) vs. co-treatment group transfected with siRNA#1 or siRNA#2.
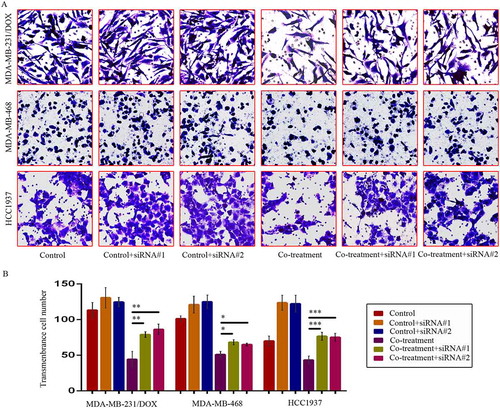
Figure 9. SiRNA-mediated TAB1 knockdown increased migration ability of TNBC cells. Cells were transfected with siRNA#1 or siRNA#2 following co-treatment with MDM2/MDMX inhibitor and DOX for 24 hours with appropriate agent dosages at 1:2 (siRNA: Lipofectamine 2000; μg:μg). The concentrations of agents were used as follow: DOX 5.14 μM in MDA-MB-231/DOX cells, 0.36 μM in MDA-MB-468 cells and 0.22 μM in HCC1937 cells, the MDM2/MDMX inhibitor 38.28 nM in MDA-MB-231/DOX cells, 41.49 nM in MDA-MB-468 cells and 36.78 nM in HCC1937 cells. Representative images (a) and quantified data (b) of wound healing assay are shown. The values presented are the means ± SD for each group. *P < 0.05, **P < 0.01, ***P < 0.001 (n = 3) vs. co-treatment group transfected with siRNA#1 or siRNA#2.
Correlations between MDM2/MDMX expression and clinicopathological characteristics of TNBC patients
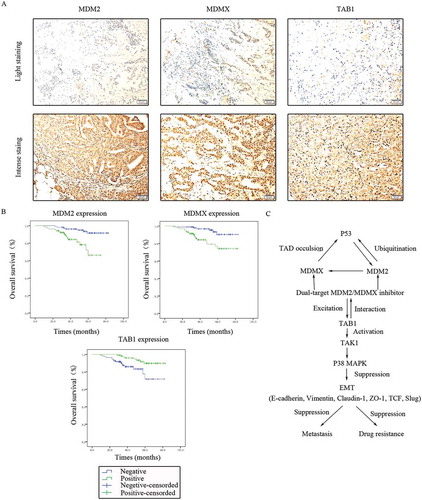
MDM2/MDMX expression in 214 TNBC tissues was also investigated with IHC staining. MDM2 was observed in both the cytoplasm and nucleus, however MDMX was only expressed in the nuclei ()). Patient baseline data and connections between MDM2/MDMX expression and clinicopathological characteristics were shown in . Nevertheless, the results did not show any statistically significant relationship between MDM2/MDMX expression and patient clinicopathological characteristics.
Table 1. Associations between MDM2/MDMX expression and the clinicopathological characteristics of 214 TNBC patients.
Figure 10. Clinical significance of MDM2/MDMX/TAB1 expression in TNBC tissues. (a) Representative IHC staining for MDM2/MDMX/TAB1 expression in TNBC tissues. Bars: 50μm. (b) Kaplan-Meier survival curves for MDM2/MDMX/TAB1 expression in 214 TNBC patients. Mutual regulations between the molecules are shown (c).
MDM2/MDMX/TAB1 expression was associated with TNBC patient survival
TAB1 expression in 214 TNBC tissues was detected using IHC staining with the same method, which could be observed in the cytoplasm ()). Univariate analysis showed that overall survival of TNBC patients was significantly associated with the following prognostic factors: age at diagnosis (P = 0.031), TNM stage (P < 0.001), lymphatic metastasis (P = 0.016), distant metastasis (P < 0.001), MDM2 (P = 0.001), MDMX (P = 0.002) and TAB1 (P = 0.006) (). Multivariate analysis revealed that only MDM2 (P = 0.046) remained independently associated with the survival time, which could be a useful prognostic biomarker for patient survival of TNBC (). The Kaplan-Meier survival curves for MDM2/MDMX/TAB1 expression revealed that patients with negative MDM2/MDMX as well as positive TAB1 had better prognosis ()).
Table 2. Univariate analysis of TNBC patient prognosis (n = 214).
Table 3. Multivariate analysis of TNBC patient prognosis (n = 214).
MDM2/MDMX expression was positively correlated with TAB1 expression in TNBC tissues
Correlations between MDM2/MDMX and TAB1 expression were emphatically explored, which are shown in . Positive MDM2 expression was significantly associated with negative TAB1 expression (P < 0.001) and consistently, MDMX overexpression was also related to TAB1’s low expression in TNBC patients (P = 0.002), which proved MDM2/MDMX inhibitor works through activating TAB1/TAK1/p38 MAPK pathway clinically. Mutual regulations between the molecules were shown in ).
Table 4. Associations between MDM2/MDMX and TAB1 expression in 214 TNBC tissues.
Discussion
As a promising anti-cancer strategy, dual-target MDM2/MDMX inhibitor could not only promote cell cycle arrest and apoptosis, but also reverse multidrug resistance.Citation18 However, the anti-tumor effects were presented only in the wild-type p53 breast cancer cells MCF-7 and ZR-75–30. MDM-MB-231, MDA-MB-468 and HCC1937 are representative TNBC cell lines with mutant-type p53, and they were chosen in the current study in order to demonstrate that MDM2/MDMX inhibitor could play a role in human TNBC cells as well.
We compared p53- and EMT-related protein expression in DOX resistant cells with the parallel sensitive cells using western blot. As a tumor suppressor related to drug resistance,Citation33 p53 gene was sure to have a low expression and the two negative regulators MDM2 and MDMX also had high protein levels in the MDA-MB-231/DOX cells. E-cadherin, Vimentin, ZO-1, Claudin-1, Slug and TCF are critical proteins or transcription factors in the EMT procedure,Citation34–Citation40 which were chosen as biomarkers of EMT activation or restrain. We could find overexpressed Vimentin, TCF, Slug and low-expressed E-cadherin, Claudin-1, ZO-1 in MDA-MB-231/DOX cells, which proved the connection between activatory EMT and DOX resistance.
As a small molecule inhibitor targeting p53–MDM2 interaction, nutlin-3a research has made great progress and the derivative RG7112 is in phase I clinical trial.Citation41 Nevertheless, it didn’t work well in MDMX-overpressed breast cancer. Therefore, we set nutlin-3a as a matched group to verify the dual-target MDM2/MDMX inhibitor’s superiority. Contrast to nutlin-3a, MDM2/MDMX inhibitor could not only inhibit cell vitality more effectively, but also sensitize TNBC cells to DOX more efficiently.
Our study is different from several reports that associated p38 MAPK signalling with the induction of EMT. Hong J et al reported that p38 MAPKs induced EMT and invasiveness in mammary epithelial cells through the phosphorylation of Twist1.Citation42 In addition, Hipp S et al showed that high expression levels of Snail in primary tumours combined with high expression levels of the phosphorylated p38 MAPK((Thr180/Tyr182)) in metastasis lead to an increased risk for death in ovarian carcinoma patients.Citation43 Of course, p38 MAPK has been also proposed to promote E-cadherin expression in human peritoneal mesothelial cells, which is similar to my conclusion.Citation44 The associations between p38 MAPK signalling and EMT need to be explored further.
We used siRNA to knockdown TAB1 in order to explore whether TAB1 knockdown could attenuate the effect of MDM2/MDMX inhibitor, which may be however inadequate to prove the mechanism of TAB1/TAK1/p38 MAPK pathway. Thus, we plan to construct the TAB1 overexpressed lentiviral to explore whether TAB1 overexpression could enhance the effect of MDM2/MDMX inhibitor. In addition, the detail MDM2/MDMX inhibitor act on TAB1 is not clear. Is it direct action or indirect effect? We need to carry out a co-immunoprecipitation -western blot analysis to explore the interreaction of MDM2/MDMX and TAB1.
A retrospective study was performed to verify the underlying mechanism that MDM2/MDMX inhibitor activated TAB1/TAK1/p38 MAPK pathway in TNBC. A total of 214 TNBC patients were enrolled in our research. IHC staining method was used to investigate MDM2/MDMX/TAB1 protein expression in TNBC tissues. The results showed the correlation between MDM2/MDMX expression and TAB1 expression, demonstrating that MDM2/MDMX inhibitor acts through regulating TAB1/TAK1/p38 MAPK pathway. In addition, survival analysis revealed not only age at diagnosis, TNM stage, lymphatic metastasis and distant metastasis, which affected patient prognosis meritedly, but also different MDM2/MDMX/TAB1 expression patients had different prognosis. Correspondingly, tumor promotor MDM2/MDMX positive expression represented worse prognosis and potential tumor suppresser TAB1 positive expression mapped a longer overall survival. The only independent prognostic factor MDM2 may be developed to be a prognostic biomarker to guide clinical treatment in TNBC.
Strangely, there are not any statistically significant relationship between MDM2/MDMX expression and patient clinicopathological characteristics. We searched The Cancer Genome Atlas (TCGA) and found there are no differences between MDM2/MDMX/TAB1 expression and breast cancer prognosis in their data, which may need to be tested in a larger sample.
In summary, our results indicated that MDM2/MDMX inhibitor sensitized human TNBC cells to DOX and inhibited cell migration and invasion by activating TAB1/TAK1/p38 MAPK pathway, suggesting that MDM2/MDMX inhibitor in combination with chemotherapy may represent a novel therapeutic strategy for cancer treatment. However, a prospective randomized study of MDM2/MDMX inhibitor versus standard therapy are required to have an absolutely unbiased estimate of comparative progression rates.
Patients and methods
Reagents
The dual-target MDM2/MDMX inhibitory protein synthesized through E. coli contains the transactivator (TAT) peptide for transduction across membranes and the scaffold protein (thioredoxin) displaying the MDM2/MDMX inhibitory peptide pDI (protein disulfideisomerase). The synthetic procedure including vector construction, gene expression, protein purification and refolding was described in detail in previous literature. Afterwards, co-immunoprecipitation-western blot analysis showed the protein was able to be immunoprecipitated by anti-MDM2 and anti-MDMX antibodies, indicating that this protein is functional. Enzyme-linked immunosorbent assay (ELISA) proved that the recombinant dual-target MDM2/MDMX inhibitor strongly inhibited interaction of MDM2/MDMX with p53, which was in a dose-dependent manner.Citation18
Cell culture
Human TNBC DOX-resistant cell line MDA-MB-231/DOX was purchased from Enogene Biotech. Human TNBC DOX-sensitive cell lines MDA-MB-231, HCC1937 and MDA-MB-468 were acquired from the Translational Medical Center of the First Affiliated Hospital of Xi’an Jiaotong University. MDA-MB-231/DOX cells were cultured in DMEM medium (HyClone), MDA-MB-231 cells were cultured in L-15 medium (KeyGEN BioTECH), and HCC1937 and MDA-MB-468 cells were cultured in RPMI medium (HyClone) at 37°C in a humidified atmosphere of 5% CO2. Media contained 10% fetal bovine serum (FBS, HyClone), 100 U/ml penicillin and 100 μg/ml streptomycin (Life Technologies). In addition, MDA-MB-231/DOX cells’ media contained 1.72 μM DOX (Topscience) to remain resistant to DOX.
Western blotting analysis
Cells were disposed with RIPA lysis buffer (Thermo Fisher Scientific) containing protease and phosphatase inhibitors (Roche) on the ice and scraped for several times to obtain whole cell lysates, which were later centrifuged at 16,000 x g for 30 min at 4°C. Protein concentration of the supernatant was determined using a Pierce BCA protein assay kit (Thermo Fisher Scientific; 23227). Each cell lysate with equal protein amount was separated by 10% sodium dodecyl sulfate–polyacrylamide gelelectrophoresis (SDS-PAGE) followed by transfer onto a polyvinyl difluoride (PVDF) membrane (Millipore Corp.). Membranes were subsequently blocked in 5% fat-free milk in Tris-buffered saline (TBS) containing 0.1% Tween-20 at room temperature for 1 h and incubated with primary antibodies at 4°C overnight. The following primary antibodies were used: MDM2 (Abcam;ab16895; 1:1,000), MDMX (Abcam; ab16058; 1:2,000), p53 (Abcam; ab32389; 1:2,000), E-cadherin (Proteintech; 20874–1-AP; 1:1,000), Vimentin (Proteintech; 10366–1-AP; 1:2,000), Claudin-1 (Cell Signaling; #13255; 1:1,000), ZO-1 (Cell Signaling; #8193; 1:1,000), TCF (Cell Signaling; #3396; 1:1,000), Slug (Cell Signaling; #9585; 1:1,000), TAB1 (Abcam; ab76412; 1:2,000), TAK1 (Proteintech; 12330–2-AP; 1:1,000), p38 MAPK (Proteintech; 14064–1-AP; 1:1,000). GAPDH (Proteintech; HRP-60004; 1:5,000) was the loading control. Finally, we incubated the membranes with corresponding HRP-conjugated secondary antibodies (Cell Signaling; #7044; 1:5,000) at room temperature for 1 h and visualized the blots with the enhanced chemiluminescence kit (ECL, Millipore Corp) detection system. Gray values of all the protein bands were analyzed by Image J software.
SRB assay
Cells were seeded in 96-well plates (1 × 10⁴ cells/well) until adherence and treated with several drug concentration gradients for 24 h in triplicate. Dimethyl sulfoxide (DMSO, Sigma-Aldrich) was used as vehicle control and PBS was used as blank control. After fixed with 50% (w/v) trichloroacetic acid, cells were stained with 0.4% (w/v in acetic acid) SRB (Sigma-Aldrich) solution for 30 min at room temperature, washed with 1% acetic acid, and finally dissolved in 10 mM Tris base solution for optical density (OD) determination at 540 nm using a microplate reader (Bio-Rad) in sequence. Inhibition rates were determined with the following formula: inhibition rate = [1 – (OD test/OD negative control)] × 100%. With X-axis representing drug concentration gradients and Y-axis presenting inhibition rates, the dose–response curves were plotted to observe the drug toxicity. The half maximal inhibitory concentration (IC50) values were calculated using Statistical Package for the Social Sciences software (SPPS, version 18.0).
Transwell invasion assay
Transwell plates (8-μm pore size, Corning) containing polycarbonate filters coated with 50 μl of matrigel matrix (BD Biosciences; 1:6 dilution) were used to assess cell invasion. Pretreated cells (5 × 10⁴ cells suspended in 200μl serum-free medium/well) were seeded onto upper chambers, while 600μl medium containing 10% FBS was added to the bottom chambers. Following a 48 h incubation period at 37°C, cells that migrated through the matrigel and adhered onto the lower chamber were fixed with 4% paraformaldehyde (w/v) for 30 min, stained with 0.1% crystal violet in PBS for 20 min and photoed under a microscope (Nikon-Eclipse). The number of invasive cells was quantified by counting the number of cells in five randomly chosen fields at a 200-fold magnification.
Wound healing assay
When pretreated cells grew as monolayers, artificial scratch wounds were created by a sterile 10µL pipette tip. Detached cells were washed away with PBS. Before and after a 36h incubation period in serum-free media, the horizontal distance between the sides of the wound was measured. Data acquired from three areas of the wound on each plate were used to calculate the mean gap width at a given time. The percent of wound closure was then calculated using the following equation: percent wound closure (%) = [1 ˗ (Lt/L0)] × 100%.
Xenograft model
TNBC in situ transplantation tumor models were built in four-week-old female athymic BALB/c nude mice housed under specific-pathogen-free conditions. Each mouse was injected equal number of TNBC cells (1 × 10⁷) below the mammary fat pad. The body weights of mice and tumor volumes were estimated every other day using the formula: V (cm3) = a × b2/2 (where a was the largest diameter and b was the smallest diameter). Mice were randomly distributed into four groups (six in each group) and separately treated with normal saline, DOX alone, MDM2/MDMX inhibitor alone and combination of DOX with MDM2/MDMX inhibitor when the tumor size reached about 200 mm3. Mice were euthanized at 15 days with the tumor tissues excised, weighed, fixed in 4% paraformaldehyde, and embedded in paraffin. The IRs were calculated the following formula: IR = (1 ˗ mean tumor weight of the experimental group/mean tumor weight of the control group) × 100%. All above mouse experiments complied with protocols approved by the Ethics Committee for Animal Experimentation of the Medical College of Xi’an Jiaotong University, in accordance with the National Institutes of Health Guide for the Care and Use of Laboratory Animals.
Immunohistochemistry (IHC)
Serial sections (4-µm) were cut from tumor tissues and antigen retrieval was performed using a microwave at high power in 10 mM of citrate buffer, pH 6.0 for 5min, followed by middle power for 15 min. IHC staining was performed with a streptavidin–biotin peroxidase kit (Zhongshan Golden Bridge Biotechnology; SP-9001) according to the manufacturer’s instructions. They were then visualized by diaminobenzidine tetrahydrochloride (Zhongshan Golden Bridge Biotechnology; ZLI-9018), counterstained with hematoxylin, dehydrated, mounted and imaged using a high-power microscope (Nikon-Eclipse). The sections were incubated by the following primary antibodies in a humid incubation chamber at 4°C overnight: E-cadherin (Proteintech; 20874–1-AP; 1:400), Vimentin (Cell Signaling; #3396; 1:100), ZO-1 (Cell Signaling; #8193; 1:100), TCF (Cell Signaling; #3396; 1:100), Slug (Cell Signaling; #9585; 1:50). For the negative control, phosphate buffered saline was used instead of the primary antibody. Expression intensities were quantified as the sum of the integrated optical densities(IOD)/sum of the area of threshold pixels for all signals measured in each image using IPP 6.0 software (Media Cybernetics).
SIRNA and transfection
Cells were treated with combination of DOX with MDM2/MDMX inhibitor for 24 h, and then transfected with siRNA targeting TAB1 synthesized by GenePharma using Lipofectamine 2000 at 1:2 (siRNA: Lipofectamine 2000; μg:μg) according to the manufacturer’s instructions. Cells were collected after 72 h and the efficiency of RNA interference was checked with western blot assays. To knock down endogenous TAB1, the following target sequences were constructed in a siRNA vector: siRNA#1-TAB1-Homo-219: sense: 5′- GGAGUGAGAACAACUGCUUTT −3′, antisense: 5′- AAGCAGUUGUUCUCACUCCTT −3′; siRNA#2-TAB1-Homo-685: sense: 5′- GGAUGAGCUCUUCCGUCUUTT −3′, antisense: 5′- AAGACGGAAGAGCUCAUCCTT −3′. A scrambled siRNA sequence was used as a negative control: 5′- UUCUCCGAACGUGUCACGUTT −3′, antisense: 5′- ACGUGACACGUUCGGAGAATT −3′.
TNBC tissue samples
We retrospectively reviewed 214 patients histologically diagnosed as TNBC between January, 2010 and December, 2014. All patients were females aged 24–74 years (mean age, 49.07 years). None had received anti-cancer treatment prior to tumor excision. All patients were classified according to the p-TNM staging system of the American Joint Committee on CancerCitation45 and the classification system of the World Health Organization.Citation46 Patients were followed up until death or the end of the study (Jan 2017). Survival time was calculated from the date of diagnosis to death or the end of follow-up. The clinical study was approved by the Ethics Committees of the First Affiliated Hospital of Xi’an Jiaotong University.
For IHC staining to investigate MDM2 (Abcam; ab16895; 1:100), MDMX (Abcam; ab154324; 1:100) and TAB1 (Abcam; ab76412; 1:200) expression in TNBC tissues, the procedure has been described in the above IHC section. The Sinicrope scoring methodCitation47 was used to evaluate both the proportion of stained cells and staining intensity in certain fields. The score of stained cells was 0 for less than 5%, 1 for 6%–25%, 2 for 26%–50%, 3 for 51%–75%, and 4 for more than 75%. Correspondingly, the intensity was classified as 0 for negative staining, 1 for weak staining, 2 for moderate staining, and 3 for strong staining. The proportion multiplied by staining intensity to calculate an immuno-reactive score for each tumor specimen. For MDM2, MDMX and TAB1 expression, a final score of 0–2 indicated negative expression and 3–12 indicated positive expression.
Statistical analysis
SPSS software was used to carry out the statistical analysis. Differences between groups were analyzed using the student t-test or one-way ANOVA and least-significant difference (LSD) according to group count. Differences between clinicopathological variables were confirmed by Chi-square test. Survival analysis was performed by Kaplan-Meier estimates and log-rank tests, and Cox proportional hazards regression model could identify independent prognosis factors. All statistical tests were two sided. P < 0.05 was considered statistically significant.
Disclosure of Potential Conflicts of Interest
No potential conflicts of interest were disclosed.
Additional information
Funding
References
- Siegel RL, Miller KD, Jemal A. Cancer statistics, 2018. CA Cancer J Clin. 2018;68:7–30. doi:10.3322/caac.21442.
- Chen W, Zheng R, Baade PD, Zhang S, Zeng H, Bray F, Jemal A, Yu XQ, He J. Cancer statistics in China, 2015. CA Cancer J Clin. 2016;66:115–132. doi:10.3322/caac.21338.
- Gluz O, Liedtke C, Gottschalk N, Pusztai L, Nitz U, Harbeck N. Triple-negative breast cancer–current status and future directions. Ann Oncol. 2009;20:1913–1927. doi:10.1093/annonc/mdp492.
- Lehmann BD, Pietenpol JA. Identification and use of biomarkers in treatment strategies for triple-negative breast cancer subtypes. J Pathol. 2014;232:142–150. doi:10.1002/path.4280.
- Giai M, Biglia N, Sismondi P. Chemoresistance in breast tumors. Eur J Gynaecol Oncol. 12;1991:359–373.
- Harris SL, Levine AJ. The p53 pathway: positive and negative feedback loops. Oncogene. 2005;24:2899–2908. doi:10.1038/sj.onc.1208615.
- Hollstein M, Sidransky D, Vogelstein B, Harris CC. p53 mutations in human cancers. Science (New York, NY). 1991;253:49–53. doi:10.1126/science.1905840.
- Ventura A, Kirsch DG, McLaughlin ME, Tuveson DA, Grimm J, Lintault L, Newman J, Reczek EE, Weissleder R, Jacks T. Restoration of p53 function leads to tumour regression in vivo. Nature. 2007;445:661–665. doi:10.1038/nature05541.
- Toledo F, Wahl GM. Regulating the p53 pathway: in vitro hypotheses, in vivo veritas. Nat Rev Cancer. 2006;6:909–923. doi:10.1038/nrc2012.
- Boehme KA, Blattner C. Regulation of p53–insights into a complex process. Crit Rev Biochem Mol Biol. 2009;44:367–392. doi:10.3109/10409230903401507.
- Wade M, Li YC, Wahl GM. MDM2, MDMX and p53 in oncogenesis and cancer therapy. Nat Rev Cancer. 13;2013:83–96.
- Hu B, Gilkes DM, Farooqi B, Sebti SM, Chen J. MDMX overexpression prevents p53 activation by the MDM2 inhibitor nutlin. J Biol Chem. 2006;281:33030–33035. doi:10.1074/jbc.C600147200.
- Haupt S, Vijayakumaran R, Miranda PJ, Burgess A, Lim E, Haupt Y. The role of MDM2 and MDM4 in breast cancer development and prevention. J Mol Cell Biol. 2017;9:53–61. doi:10.1093/jmcb/mjx007.
- Marine JC, Francoz S, Maetens M, Wahl G, Toledo F, Lozano G. Keeping p53 in check: essential and synergistic functions of Mdm2 and Mdm4. Cell Death Differ. 2006;13:927–934. doi:10.1038/sj.cdd.4401912.
- Chang YS, Graves B, Guerlavais V, Tovar C, Packman K, To KH, Olson KA, Kesavan K, Gangurde P, Click Here to Enter Text. A, et al. Stapled alpha-helical peptide drug development: a potent dual inhibitor of MDM2 and MDMX for p53-dependent cancer therapy. Proc Natl Acad Sci U S A. 2013;110:E3445–54. doi:10.1073/pnas.1303002110.
- Qin JJ, Li X, Wang W, Zi X, Zhang R. Targeting the NFAT1-MDM2-MDMX network inhibits the proliferation and invasion of prostate cancer cells, independent of p53 and androgen. Front Pharmacol. 2017;8:917. doi:10.3389/fphar.2017.00917.
- Soares J, Espadinha M, Raimundo L, Ramos H, Gomes AS, Gomes S, Loureiro JB, Inga A, Reis F, Gomes C, et al. DIMP53-1: a novel small-molecule dual inhibitor of p53-MDM2/X interactions with multifunctional p53-dependent anticancer properties. Mol Oncol. 2017;11:612–627. doi:10.1002/1878-0261.12051.
- Geng QQ, Dong DF, Chen NZ, Wu YY, Li EX, Wang J, Wang S-M. Induction of p53 expression and apoptosis by a recombinant dual-target MDM2/MDMX inhibitory protein in wild-type p53 breast cancer cells. Int J Oncol. 2013;43:1935–1942. doi:10.3892/ijo.2013.2138.
- De Craene B, Berx G. Regulatory networks defining EMT during cancer initiation and progression. Nat Rev Cancer. 2013;13:97–110. doi:10.1038/nrc3447.
- Zavadil J, Haley J, Kalluri R, Muthuswamy SK, Thompson E. Epithelial-mesenchymal transition. Cancer Res. 2008;68:9574–9577. doi:10.1158/0008-5472.CAN-08-2316.
- Kalluri R, Weinberg RA. The basics of epithelial-mesenchymal transition. J Clin Invest. 2009;119:1420–1428. doi:10.1172/JCI39104.
- Singh A, Settleman J. EMT, cancer stem cells and drug resistance: an emerging axis of evil in the war on cancer. Oncogene. 2010;29:4741–4751. doi:10.1038/onc.2010.215.
- Zhang Y, Toy KA, Kleer CG. Metaplastic breast carcinomas are enriched in markers of tumor-initiating cells and epithelial to mesenchymal transition. Modern Pathol. 2012;25:178–184. doi:10.1038/modpathol.2011.167.
- Creighton CJ, Li X, Landis M, Dixon JM, Neumeister VM, Sjolund A, Rimm DL, Wong H, Rodriguez A, Herschkowitz JI, et al. Residual breast cancers after conventional therapy display mesenchymal as well as tumor-initiating features. Proc Natl Acad Sci U S A. 2009;106:13820–13825. doi:10.1073/pnas.0905718106.
- Zheng X, Carstens JL, Kim J, Scheible M, Kaye J, Sugimoto H, Click Here to Enter Text. -C-C, LeBleu VS, Kalluri R. Epithelial-to-mesenchymal transition is dispensable for metastasis but induces chemoresistance in pancreatic cancer. Nature. 2015;527:525–530. doi:10.1038/nature16064.
- Fischer KR, Durrans A, Lee S, Sheng J, Li F, Wong STC, Choi H, El Rayes T, Ryu S, Troeger J, et al. Epithelial-to-mesenchymal transition is not required for lung metastasis but contributes to chemoresistance. Nature. 2015;527:472–476. doi:10.1038/nature15748.
- Johnson GL, Lapadat R. Mitogen-activated protein kinase pathways mediated by ERK, JNK, and p38 protein kinases. Science (New York, NY). 2002;298:1911–1912. doi:10.1126/science.1072682.
- Koul HK, Pal M, Koul S. Role of p38 MAP Kinase Signal Transduction in Solid Tumors. Genes Cancer. 2013;4:342–359. doi:10.1177/1947601913507951.
- Zhu Y, Regunath K, Jacq X, Prives C. Cisplatin causes cell death via TAB1 regulation of p53/MDM2/MDMX circuitry. Genes Dev. 2013;27:1739–1751. doi:10.1101/gad.212258.112.
- Witte D, Otterbein H, Forster M, Giehl K, Zeiser R, Lehnert H, Ungefroren H. Negative regulation of TGF-beta1-induced MKK6-p38 and MEK-ERK signalling and epithelial-mesenchymal transition by Rac1b. Sci Rep. 2017;7:17313. doi:10.1038/s41598-017-15170-6.
- Zhao X, Wu X, Qian M, Song Y, Wu D, Zhang W. Knockdown of TGF-β1 expression in human umbilical cord mesenchymal stem cells reverts their exosome-mediated EMT promoting effect on lung cancer cells. Cancer Lett. 2018;428:34–44. doi:10.1016/j.canlet.2018.04.026.
- del Barco Barrantes I, Nebreda AR. Roles of p38 MAPKs in invasion and metastasis. Biochem Soc Trans. 2012;40:79–84. doi:10.1042/BST20110676.
- Shetzer Y, Solomon H, Koifman G, Molchadsky A, Horesh S, Rotter V. The paradigm of mutant p53-expressing cancer stem cells and drug resistance. Carcinogenesis. 2014;35:1196–1208. doi:10.1093/carcin/bgu073.
- Wheelock MJ, Johnson KR. Cadherins as modulators of cellular phenotype. Annu Rev Cell Dev Biol. 2003;19:207–235. doi:10.1146/annurev.cellbio.19.011102.111135.
- Christofori G. Changing neighbours, changing behaviour: cell adhesion molecule-mediated signalling during tumour progression. Embo J. 2003;22:2318–2323. doi:10.1093/emboj/cdg228.
- Hazan RB, Qiao R, Keren R, Badano I, Suyama K. Cadherin switch in tumor progression. Ann N Y Acad Sci. 1014;2004:155–163.
- Helfand BT, Chang L, Goldman RD. Intermediate filaments are dynamic and motile elements of cellular architecture. J Cell Sci. 2004;117:133–141. doi:10.1242/jcs.00936.
- Reichert M, Muller T, Hunziker W. The PDZ domains of zonula occludens-1 induce an epithelial to mesenchymal transition of Madin-Darby canine kidney I cells. Evidence for a Role of beta-catenin/Tcf/Lef Signaling. The Journal of Biological Chemistry. 275;2000:9492–9500.
- Bolos V, Peinado H, Perez-Moreno MA, Fraga MF, Esteller M, Cano A. The transcription factor slug represses E-cadherin expression and induces epithelial to mesenchymal transitions: a comparison with snail and E47 repressors. J Cell Sci. 116;2003:499–511.
- Aigner K, Dampier B, Descovich L, Mikula M, Sultan A, Schreiber M, Mikulits W, Brabletz T, Strand D, Obrist P, et al. The transcription factor ZEB1 (deltaEF1) promotes tumour cell dedifferentiation by repressing master regulators of epithelial polarity. Oncogene. 2007;26:6979–6988. doi:10.1038/sj.onc.1210508.
- Vassilev LT, Vu BT, Graves B, Carvajal D, Podlaski F, Filipovic Z, Kong N, Kammlott U, Lukacs C, Klein C, et al. In vivo activation of the p53 pathway by small-molecule antagonists of MDM2. Science (New York, NY). 2004;303:844–848. doi:10.1126/science.1092472.
- Hong J, Zhou J, Fu J, He T, Qin J, Wang L, Liao L, Xu J. Phosphorylation of serine 68 of twist1 by MAPKs stabilizes twist1 protein and promotes breast cancer cell invasiveness. Cancer Res. 2011;71:3980–3990. doi:10.1158/0008-5472.CAN-10-2914.
- Hipp S, Berg D, Ergin B, Schuster T, Hapfelmeier A, Walch A, Avril S, Schmalfeldt B, Höfler H, Becker K-F. Interaction of snail and p38 mitogen-activated protein kinase results in shorter overall survival of ovarian cancer patients. Virchows Archiv. 2010;457:705–713. doi:10.1007/s00428-010-0986-5.
- Strippoli R, Benedicto I, Foronda M, Perez-Lozano ML, Sanchez-Perales S, Lopez-Cabrera M, Del Pozo MÁ. p38 maintains E-cadherin expression by modulating TAK1-NF-kappa B during epithelial-to-mesenchymal transition. J Cell Sci. 2010;123:4321–4331. doi:10.1242/jcs.071647.
- Edge SB, Compton CC. The American joint committee on cancer: the 7th edition of the AJCC cancer staging manual and the future of TNM. Ann Surg Oncol. 2010;17:1471–1474. doi:10.1245/s10434-010-0985-4.
- Lebeau A, Kriegsmann M, Burandt E, Sinn HP. Invasive breast cancer: the current WHO classification. Der Pathologe. 2014;35:7–17. doi:10.1007/s00292-013-1841-7.
- Sinicrope FA, Ruan SB, Cleary KR, Stephens LC, Lee JJ, Levin B. bcl-2 and p53 oncoprotein expression during colorectal tumorigenesis. Cancer Res. 55;1995:237–241.