
ABSTRACT
There is no efficacious standard of care therapy for uveal melanoma. Unlike cutaneous disease, uveal melanoma does not exhibit RAS mutations but instead contains mutations with ~90% penetrance in either Gαq or Gα11. Previously we demonstrated that neratinib caused ERBB1/2/4 and RAS internalization into autolysosomes which resulted in their proteolytic degradation. In PDX isolates of uveal melanoma, neratinib caused the internalization and degradation of Gαq and Gα11 in parallel with ERBB1 breakdown. These effects were enhanced by the HDAC inhibitor entinostat. Similar data were obtained using GFP/RFP tagged forms of K-RAS V12. Down regulation of Gαq and Gα11 expression and RAS-GFP/RFP fluorescence required Beclin1 and ATG5. The [neratinib + entinostat] combination engaged multiple pathways to mediate killing. One was from ROS-dependent activation of ATM via AMPK-ULK1-ATG13-Beclin1/ATG5. Another pathway was from CD95 via caspase 8-RIP1/RIP3. A third was from reduced expression of HSP70, HSP90, HDAC6 and phosphorylation of eIF2α. Downstream of the mitochondrion both caspase 9 and AIF played roles in tumor cell execution. Knock down of ATM/AMPK/ULK-1 prevented ATG13 phosphorylation and degradation of RAS and Gα proteins. Over-expression of activated mTOR prevented ATG13 phosphorylation and suppressed killing. Knock down of eIF2α maintained BCL-XL and MCL-1 expression. Within 6h, [neratinib + entinostat] reduced the expression of the immunology biomarkers PD-L1, ODC, IDO-1 and enhanced MHCA levels. Our data demonstrate that [neratinib + entinostat] down-regulates oncogenic RAS and the two key oncogenic drivers present in most uveal melanoma patients and causes a multifactorial form of killing via mitochondrial dysfunction and toxic autophagy.
Abbreviations: ERK: extracellular regulated kinase; PI3K: phosphatidyl inositol 3 kinase; ca: constitutively active; dn: dominant negative; ER: endoplasmic reticulum; AIF: apoptosis inducing factor; AMPK: AMP-dependent protein kinase; mTOR: mammalian target of rapamycin; JAK: Janus Kinase; STAT: Signal Transducers and Activators of Transcription; MAPK: mitogen activated protein kinase; PTEN: phosphatase and tensin homologue on chromosome ten; ROS: reactive oxygen species; CMV: empty vector plasmid or virus; si: small interfering; SCR: scrambled; IP: immunoprecipitation; VEH: vehicle; HDAC: histone deacetylase.
Introduction
Uveal melanoma, a rare cancer of the eye with an incidence of approximately 1 person per 100,000 of population, has been recognized for over 200 years, but at present, no good standard of care therapeutic approach has been developed for these patients outside of external beam radiotherapy and the use of radioactive isotopes as part of brachytherapy.Citation1 At initial presentation, most patients do not have evident metastatic disease, however eventually, approximately 50% of patients have blood borne metastatic spread most often resulting in lesions within the liver as well as in the lungs, bone and at subcutaneous sites.Citation1,Citation2 Patients with metastatic disease have survival times of less than one year. Clearly, novel approaches are urgently required to prolong patient survival.
Uveal melanoma has been characterized as having a variety of genetic alterations including monosomy of chromosome 3 or with amplification of the long arm of chromosome 8.Citation2,Citation3 In approximately 90% of all uveal melanomas, the G-protein coupled receptor (GPCR) associated proteins Gαq and Gα11 are mutated in a mutually exclusive manner; these proteins are considered essential in the development of the disease and then to act as drivers of oncogenesis and metastatic spread.Citation2 In an analogous fashion to the more widely reported mutant RAS proteins, mutated Gαq and Gα11 also have a very low GTPase activity.Citation2,Citation4 However, although Gαq and Gα11 are mutated in ~90% of uveal melanomas, the mutational status of these GTP binding proteins does not precisely correlate with patient survival.Citation2,Citation5 Gαq and Gα11 “mutations” occur to a similar extent in tumors in situ and in those that have metastasized; the importance of whether Gαq or Gα11 is mutated has been found to more closely correlate with outcomes. Uveal melanoma tumors in situ and that tend to remain in situ generally have mutation of Gαq Q209, with a penetrance of ~80% at this site. However, in metastatic disease the Gα11 Q209 mutation has ~60% penetrance whereas it has only a ~ 10% penetrance for disease in situ.Citation6–Citation12
In uveal melanoma cells Gαq and Gα11 are coupled to the serotonin (5-HT) receptors 2A and 2B (HTR2A and HTR2B).Citation13 5-HT2B, is overexpressed in uveal melanoma cells shown to correlate with a high metastatic risk. Gαq and Gα11 are also coupled to endothelin receptor types A and B (EDNRA and EDNRB).Citation14,Citation15 In approximately 10% of uveal melanomas, no mutations in Gαq and Gα11 are found. However, in a manner previously described for wild type RAS proteins in cancer, upstream activating mutations in receptors can lead to constitutive activation of downstream wild type Gαq and Gα11. Whole exome sequencing data has identified an L129G-activating mutation in the cysteinyl leukotriene receptor 2 (CYSLTR2) GPCR.Citation15,Citation16 The mutation causes constitutive activation of wild type Gαq signaling. The activating mutation of an aspartic acid at position 630 to tyrosine in phospholipase Cβ4 (PLCB4) gene has also been found in wild-type Gαq and Gα11 uveal melanoma cells.Citation17,Citation18 PLCB4 is a direct downstream target of Gαq and Gα11.
We have recently published several manuscripts examining the biology of the irreversible ERBB1/2/4 inhibitor neratinib.Citation19–Citation23 Our most notable discovery was that not only did neratinib catalytically inhibit ERBB1/2/4, it also triggered their rapid internalization and subsequent proteolytic degradation. Growth factor receptors such as ERBB1/2/4 are often thought to exist on the surface of cells in large quaternary complexes with other receptors and transducing proteins. Thus, not only did neratinib cause ERBB1/2/4 degradation, it was also capable of causing mutant RAS proteins to be internalized and degraded. The ability of neratinib to trigger this event was enhanced by HDAC inhibitors, which was attributed to inactivation of chaperone proteins and a more intense prolonged autophagic digestive process. It has been described by multiple laboratories that GPCRs through several mechanisms can trans-activate the ERBB1/2/4 family of RTKs.Citation24,Citation25 Thus, we hypothesized that Gαq and Gα11 may be components of large cell surface quaternary signaling complexes. In the present studies we have demonstrated that neratinib down-regulates the expression of Gαq and Gα11 in multiple PDX uveal melanoma isolates from metastatic sites, causing tumor cell death.
Results
In other tumor cell types, we have discovered that neratinib can combine with HDAC inhibitors to kill cancer cells.Citation19,Citation21 PDX isolates of uveal melanoma cells were morphologically similar to an established uveal melanoma cell line (). At physiologic concentrations, neratinib (C max ~150 nM) and entinostat (C max ~100 nM) interacted in an additive to greater than additive fashion to kill four uveal melanoma PDX isolates, as well as one established cell line ().
Figure 1. Neratinib and entinostat interact to kill uveal melanoma cells. (a). Images of four PDX isolates of human uveal melanoma cells and of one established uveal melanoma cell line. (b). Uveal melanoma cells were treated for 12h or 24h with vehicle control, neratinib (100 nM), entinostat (50 nM) or the drugs in combination. At each time point, the cells were isolated, and viability determined via trypan blue exclusion assays (n = 3 ± SD).
The plasma membrane associated proteins Gαq and Gα11 are the prime oncogenic drivers in uveal melanoma cells. Within six hours of drug exposure, both neratinib and entinostat reduced the levels of Gαq and Gα11 (), with the combination of drugs significantly lower than either individually. Morphologically within the cells, neratinib caused both Gαq and Gα11 staining to become speckled/mackerel-like (, upper images). The G alpha proteins were also observed to be contained in distinct punctate structures (white arrows). Expanded size images of vehicle and drug treated cells are presented in where the overall decline in Gαq and Gα11 staining is obvious, as are the formation of small vesicles. Both ERBB1 and ERBB2 are expressed in the uveal melanoma cells, though their expression levels were lower than we have observed, for example, in NSCLC cells.Citation26 Both neratinib and entinostat reduced the expression of ERBB1 ().
Figure 2. Neratinib, entinostat and the drug combination reduce the protein levels of Gαq and Gα11. (a). Uveal melanoma cells were treated for 6h with vehicle control, entinostat (50 nM), neratinib (100 nM) or the drugs in combination. Cells were fixed in place and immune-staining performed to detect the total expression of Gαq and Gα11. Analyses for densitometric scanning of fluorescence intensity were performed at 10X magnification on > 120 cells per condition (n = 3 ± SD) * p < 0.05 less than exposure to either neratinib or entinostat; images of PDX4 are representative, and at 60X magnification. (b). Additional images from studies in Panel A for isolate PDX2. (c). Uveal melanoma cells were treated for 6h with vehicle control, entinostat (50 nM), neratinib (100 nM) or the drugs in combination. Cells were fixed in place and immune-staining performed to detect the total expression of ERBB1. Analyses for densitometric scanning of fluorescence intensity were performed at 10X magnification on > 120 cells per condition (n = 3 ± SD).
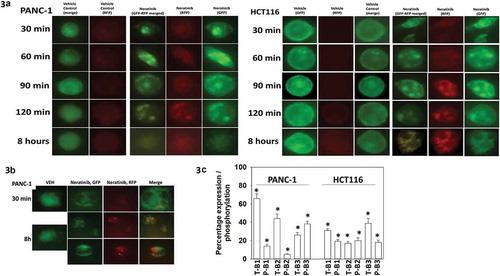
We have previously published, using plasmids to express K-RAS V12 – GFP and K-RAS V12 – RFP that neratinib can rapidly denude the plasma membrane of fluorescent RAS staining and cause the formation of intracellular vesicles.Citation23 PANC-1 pancreatic and HCT116 colorectal tumor cells both express a mutated form of K-RAS; transfection of these cells with the plasmids to express K-RAS V12 – GFP and K-RAS V12 – RFP, followed 24h afterwards by neratinib exposure, caused the formation of intracellular vesicles that co-stained for GFP and for RFP (). In some, but not all, of the treated PANC-1 cells eight hours after neratinib exposure, exhibited K-RAS V12 – GFP and K-RAS V12 – RFP staining that did not co-localize (). This data implies that autophagic flux was occurring, with autophagosomes fusing with acidic endosomes; in the acidic endosome GFP fluorescence is quenched whereas that of RFP is not. In parallel to examining K-RAS V12 entering vesicular structures, we determined the impact of neratinib exposure on the expression and phosphorylation of ERBB1, ERBB2 and ERBB3. In both PANC-1 and HCT116 cells, neratinib modestly reduced ERBB1 expression but more strongly reduced the levels of ERBB2 and ERBB3 (; Figure S1). The phosphorylation of ERBB1/2/3 were all reduced by neratinib. These findings are very similar to data previously presented by ourselves using H1975 NSCLC cells.Citation19
Figure 3. Neratinib causes the rapid formation of intracellular vesicles that stain for K-RAS V12-GFP and K-RAS V12-RFP. (a). PANC-1 pancreatic and HCT116 colorectal tumor cells were transfected with plasmids to express K-RAS V12-GFP and K-RAS V12-RFP. Twenty-four h after transfection cells were treated with vehicle control or with neratinib (100 nM). Cells were imaged at 60X magnification over the time course shown in the Figure (representative images from three studies are shown). (b). Additional studies were performed in an identical fashion to Panel A. Cells were imaged at 30 min and after 8h at 60X magnification representative images from three studies are shown). (c). PANC-1 pancreatic and HCT116 colorectal tumor cells were treated with vehicle control or with neratinib (100 nM) for 6h. Cells were fixed and stained to determine the phosphorylation and expression of ERBB1, ERBB2 and ERBB3. Analyses for densitometric scanning of fluorescence intensity at 3h were performed at 10X magnification on > 120 cells per condition (n = 3 ± SD) * p < 0.05 less than vehicle control exposure.
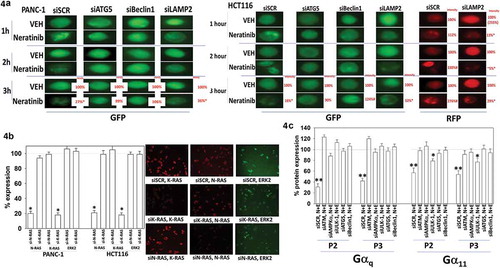
In pancreatic and colon cancer cells transfected to express K-RAS V12 – GFP and K-RAS V12 – RFP, knock down of Beclin1 and ATG5 but not LAMP2 prevented the formation of GFP+ vesicles and the degradation of the RAS proteins after drug exposure (). In HCT116 cells, as the levels of GFP+ vesicle staining declined, the staining of RFP+ vesicles increased, again arguing for a form of autophagic flux. Based on immunofluorescence assays of endogenous protein, neratinib rapidly caused staining for mutant K-RAS and wild type N-RAS in pancreatic cancer cells to become punctate (Figure S2). Based on data presented in Waters et al we used two validated siRNA tools to knock down the expression of K-RAS or N-RAS in pancreatic and colon cancer cells.Citation27 In our assays, knock down of wild type N-RAS reduced wild type N-RAS staining by ~80%, but did not alter staining for mutant K-RAS or for ERK2. Knock down of mutant K-RAS reduced mutant K-RAS staining, also by ~80%, but did not alter staining for wild type N-RAS or ERK2 (). We next transfected uveal melanoma cells with siRNA molecules to knock down autophagy regulatory proteins and 24h later, treated the cells with neratinib. Knock down of ATM, AMPKα, ULK-1, Beclin1 or ATG5 prevented neratinib from reducing the expression of Gαq and Gα11 (). Gαs is also known to be mutated in some tumor types, e.g. pancreatic, however, unlike Gαq and Gα11, our drug combination failed to significantly reduce Gαs levels (data not shown).Citation28–Citation32
Figure 4. Degradation of K-RAS requires autophagosome formation. (a). PANC-1 pancreatic and HCT116 colorectal tumor cells were transfected with plasmids to express K-RAS V12-GFP and K-RAS V12-RFP. In parallel, cells were transfected with a scrambled siRNA control or with siRNA molecules to knock down the expression of ATG5, Beclin1 or LAMP2. Twenty-four h after transfection cells were treated with vehicle control or with neratinib (100 nM). Cells were imaged at 60X magnification over the time course shown in the Figure (representative images from three studies are shown). Analyses for densitometric scanning of fluorescence intensity at 3h were performed at 10X magnification on > 120 cells per condition (n = 3 ± SD) * p < 0.05 less than vehicle control exposure. (b). PANC-1 and HCT116 cells were transfected with a scrambled control or with siRNA molecules to knock down the expression of K-RAS or N-RAS. Twenty-four h after transfection, cells were fixed in place and immune-staining performed to detect the fluorescence intensity under each condition. Analyses for densitometric scanning of fluorescence intensity at 3h were performed at 10X magnification on > 120 cells per condition (n = 3 ± SD) * p < 0.05 less than vehicle control exposure. (c). Uveal melanoma cells were transfected with a scrambled siRNA control or with siRNA molecules to knock down the expression of ATG5 or Beclin1. Twenty-four h after transfection cells were treated with vehicle control or with neratinib (100 nM). Cells were imaged at 60X magnification over the time course shown in the Figure (representative images from three studies are shown). Analyses for densitometric scanning of fluorescence intensity at 3h were performed at 10X magnification on > 120 cells per condition (n = 3 ± SD) * p < 0.05 less than vehicle control exposure; ** p < 0.01 less than vehicle control exposure.
We then selected two of the PDX models of metastatic disease, one from the brain (P3) and one from the liver (P2), in which to perform more detailed molecular analyses. In both models we observed the drug combination activating an ATM-AMPK-ULK1-ATG13 and an eIF2α pathway that were also associated with inactivation of mTORC1 and mTORC2 (). All these events predict for elevated formation of autophagosomes, and in agreement the drug combination increased the levels of the autophagy regulatory proteins ATG5 and Beclin1.Citation33 The expression of ERBB1, ERBB2, K-RAS, N-RAS, Gαq and Gα11 were reduced by the drug combination which were associated with inactivation of AKT and p70 S6K in both isolates. In one isolate inactivation of ERK1/2 was observed whereas in the other, inactivation of JNK1/2; either change will reduce the activity of the AP-1 transcription factor; either change will slow tumor growth.Citation34 The activity of NFκB was weakly modulated by the drug combination whereas the activities of STAT3 and STAT5 were significantly reduced. The expression of multiple ‘protective’ proteins were reduced by the drug combination including MCL-1 and BCL-XL, whose expression is regulated by STAT3, and the expression of the toxic BH3 domain protein BIM was increased. The levels of β-catenin were modestly reduced, implying the protective epithelial mesenchymal transition was not induced.
Figure 5. Neratinib and entinostat combine to activate autophagy, down-regulate cyto-protective signaling and promote mitochondrial dysfunction. PDX2 and PDX3 uveal melanoma cells were treated for 8h with vehicle control, neratinib (100 nM), entinostat (50 nM) or the drugs in combination. Cells were fixed in place and immune-staining performed to detect the fluorescence intensity for each antibody/biomarker under each condition. Analyses for densitometric scanning of fluorescence intensity at 8h were performed at 10X magnification on > 120 cells per condition (n = 3 ± SD) * p < 0.05 less than entinostat or neratinib exposure in PDX2 AND PDX3; * p < 0.05 greater than entinostat or neratinib exposure in PDX2 AND PDX3.
Based on the multitude of changes in cell signaling parameters, we performed molecular screening studies in an agnostic fashion to define modes of tumor cell killing (). In overview, our data linked drug-induced changes in signaling to cell death in a manner like that observed in other cell types and with different drug combinations. Knock down of ATM, AMPKα, ULK1, Beclin1 or ATG5 significantly reduced [neratinib + entinostat] lethality. Knock down of CD95, FADD, RIP-1, RIP-3 or expression of the caspase 8 inhibitor c-FLIP-s significantly reduced killing.Citation35,Citation36 The drug combination, in concordance with the data of other using HDAC inhibitors, increased the total protein expression of CD95 and enhanced receptor ‘capping’ on the cell surface (not shown). Over-expression of the mitochondrial protective protein BCL-XL suppressed [neratinib + entinostat] lethality to approximately the same level of death observed by neratinib alone in control transfected cells. In general agreement with this finding, knock down of MCL-1 or BCL-XL enhanced drug combination lethality whereas knock down of BAX and BAK was protective. Knock down of Beclin1, ATM, ULK1 or CD95 all partially inhibited the drug combination-induced activation of BAX and BAK (not shown). Downstream of the mitochondrion, killing was reduced by either expression of dominant negative caspase 9 or by knock down of apoptosis inducing factor (AIF).
Figure 6. [Neratinib + entinostat] lethality requires expression of eIF2α and CD95 and is enhanced by knock down of protective mitochondrial proteins. PDX2 and PDX3 uveal melanoma cells were transfected with an empty vector plasmid (CMV) or to express c-FLIP-s, BCL-XL or dominant negative caspase 9, or alternatively were transfected with a scrambled siRNA or with siRNA molecules to knock down the expression of the proteins indicated in each graph. Twenty-four h after transfection, cells were treated with vehicle control, neratinib (100 nM), entinostat (50 nM) or the drugs in combination for 12h. At each time point, the cells were isolated, and viability determined via trypan blue exclusion assays (n = 3 ± SD). * p < 0.05 less than corresponding value in CMV/SCR transfected cells; ** p 0.01 less than corresponding value in CMV/SCR transfected cells; # p < 0.05 greater than corresponding value in CMV/SCR transfected cells.
![Figure 6. [Neratinib + entinostat] lethality requires expression of eIF2α and CD95 and is enhanced by knock down of protective mitochondrial proteins. PDX2 and PDX3 uveal melanoma cells were transfected with an empty vector plasmid (CMV) or to express c-FLIP-s, BCL-XL or dominant negative caspase 9, or alternatively were transfected with a scrambled siRNA or with siRNA molecules to knock down the expression of the proteins indicated in each graph. Twenty-four h after transfection, cells were treated with vehicle control, neratinib (100 nM), entinostat (50 nM) or the drugs in combination for 12h. At each time point, the cells were isolated, and viability determined via trypan blue exclusion assays (n = 3 ± SD). * p < 0.05 less than corresponding value in CMV/SCR transfected cells; ** p 0.01 less than corresponding value in CMV/SCR transfected cells; # p < 0.05 greater than corresponding value in CMV/SCR transfected cells.](/cms/asset/0f0fd427-1671-423b-b2b6-fe4ab14b7f0c/kcbt_a_1551747_f0006_b.gif)
Further studies then attempted to connect altered survival with altered cell signaling processes. The PDX2 isolate was transfected with a scrambled control siRNA, or with siRNA molecules to knock down the expression of ATM, AMPKα, ULK-1 or eIF2α, and then treated with [neratinib + entinostat] for eight hours. Alterations in twenty different response biomarkers were determined using the Hermes WiScan System (Figure S3). Our data confirmed that ATM-AMPK-ULK1 signaling played a key role in controlling ATG13 phosphorylation. In the absence of ATM-AMPK-ULK-1 signaling, neither mTORC1 nor mTORC2 were inactivated and the ability of the drug combination to reduce ERBB1, ERBB2, K-RAS, N-RAS, Gαq and Gα11 expression declined. Interestingly, under all transfection conditions, STAT3 was always at least partially inactivated compared to control; ATM-AMPK signaling was shown to abolish STAT5 inactivation, however knock down of either ULK-1 or eIF2α were ineffective. Knock down of eIF2α did not significantly alter the ability of [neratinib + entinostat] to activate ATM and AMPK, increase the phosphorylation of ULK-1 S317, and reduce phosphorylation of mTORC1, mTORC2 and ULK-1 S757. However, despite ULK-1 S317 phosphorylation decreasing and ULK-1 S757 phosphorylation increasing, i.e. implying a complete catalytic activation of ULK-1, no increase in ATG13 S318 phosphorylation was observed in cells lacking eIF2α. Furthermore, the ability of [neratinib + entinostat] to increase Beclin1 and ATG5 expression was reduced in the absence of eIF2α. It is possible that without a strong increase in the expression of Beclin1 and ATG5, activated ULK-1 cannot act upon its substrate ATG13 to cause serine 318 phosphorylation. As knock down of eIF2α also blocked the drug-induced suppression of MCL-1 and BCL-XL expression, which would maintain the sequestration of Beclin1 away from its functional role in autophagosome formation, multiple over-lapping eIF2α-dependent factors may be collectively responsible for a lack of ATG13 phosphorylation and autophagosome formation.
Based on our data, the regulation of mTOR activity and its control of autophagosome formation appear to play keys roles in the cellular response to [neratinib + entinostat]. Expression of an activated mutant form of mTOR suppressed the drug combination-induced activation of ATM, AMPK, ULK-1 S317 phosphorylation and ULK-1 S757 dephosphorylation (). The ability of cells to increase Beclin1 and ATG5 expression was reduced by activated mTOR, as was the inactivation of STAT5 and the degradation of ERBB1 and ERBB2. Expression of activated mTOR, by mechanisms unknown, suppressed the serine 51 phosphorylation of eIF2α (not shown). Expression of activated mTOR did not significantly modify the drug-induced dephosphorylation of AKT T308 but, in agreement with it interfering with eIF2α phosphorylation, activated mTOR prevented the drug-induced declines in BCL-XL and MCL-1 expression (). Over-expression of activated forms of mTOR, AKT and STAT3 all significantly reduced [neratinib + entinostat] lethality (). In parallel studies, we also examined the expression of additional biomarkers which could impact on tumor cell biology and immunogenicity (). Exposure of uveal melanoma tumor cells to [neratinib + entinostat] reduced the expression of PD-L1, ODC, IDO-1, HSP70, HSP90, HDAC6 and enhanced the levels of MHCA. These findings would predict for greater tumor cell immunogenicity in vivo and for an elevated unfolded protein response (as observed for eIF2α).
Figure 7. Expression of activated mTOR suppresses activation of autophagy signaling and maintains MCL-1 and BCL-XL expression but does not alter AKT inactivation. (a) & (b). PDX2 uveal melanoma cells were transfected with an empty vector plasmid (CMV) or a plasmid to express an activated mutant form of mTOR. Twenty-four h after transfection cells were treated with vehicle control or with [neratinib (100 nM) + entinostat (50 nM)] for 8h. Cells were fixed in place and immune-staining performed to detect the fluorescence intensity for each antibody/biomarker under each condition. Analyses for densitometric scanning of fluorescence intensity at 8h were performed at 10X magnification on > 120 cells per condition (n = 3 ± SD). (c). Uveal melanoma cells were transfected with an empty vector plasmid or with plasmids to express constitutively active AKT, active mTOR or active STAT3. Twenty-four h after transfection cells were treated with vehicle control or with [neratinib (100 nM) + entinostat (50 nM)] for 24h. Cells were isolated, and viability determined via trypan blue exclusion assays (n = 3 ± SD). * p < 0.05 less than corresponding value in CMV transfected cells. (d–f). Uveal melanoma cells were treated with vehicle control or with [neratinib (100 nM) + entinostat (50 nM)] for 6h and 12h. Cells were fixed in place and immune-staining performed to detect the fluorescence intensity for each antibody/biomarker under each condition. Analyses for densitometric scanning of fluorescence intensity were performed at 10X magnification on > 120 cells per condition (n = 3 ± SD).
![Figure 7. Expression of activated mTOR suppresses activation of autophagy signaling and maintains MCL-1 and BCL-XL expression but does not alter AKT inactivation. (a) & (b). PDX2 uveal melanoma cells were transfected with an empty vector plasmid (CMV) or a plasmid to express an activated mutant form of mTOR. Twenty-four h after transfection cells were treated with vehicle control or with [neratinib (100 nM) + entinostat (50 nM)] for 8h. Cells were fixed in place and immune-staining performed to detect the fluorescence intensity for each antibody/biomarker under each condition. Analyses for densitometric scanning of fluorescence intensity at 8h were performed at 10X magnification on > 120 cells per condition (n = 3 ± SD). (c). Uveal melanoma cells were transfected with an empty vector plasmid or with plasmids to express constitutively active AKT, active mTOR or active STAT3. Twenty-four h after transfection cells were treated with vehicle control or with [neratinib (100 nM) + entinostat (50 nM)] for 24h. Cells were isolated, and viability determined via trypan blue exclusion assays (n = 3 ± SD). * p < 0.05 less than corresponding value in CMV transfected cells. (d–f). Uveal melanoma cells were treated with vehicle control or with [neratinib (100 nM) + entinostat (50 nM)] for 6h and 12h. Cells were fixed in place and immune-staining performed to detect the fluorescence intensity for each antibody/biomarker under each condition. Analyses for densitometric scanning of fluorescence intensity were performed at 10X magnification on > 120 cells per condition (n = 3 ± SD).](/cms/asset/462d80db-1a85-4d6f-8a27-f4297a4b5229/kcbt_a_1551747_f0007_b.gif)
Cytosolic ATM has been proposed as a key sensor of the abundance of cellular reactive oxygen species (ROS).Citation37 HDAC inhibitors have been widely reported to increase ROS levels. Treatment of uveal melanoma cells with [neratinib + entinostat] increased the production of ROS (). Over-expression of thioredoxin (TRX) or super oxide dismutase 2 (SOD2) suppressed the lethality of [neratinib + entinostat] (). Over-expression of (TRX + SOD2) suppressed the production of ROS and significantly lowered the drug combination-induced phosphorylation of ATM and AMPK ( and ). In the case of eIF2α S51 phosphorylation, the data were more complicated (). After 2h of incubation, over-expression of (TRX + SOD2) did not alter the drug-induced phosphorylation of eIF2α S51. Four and six hours after drug exposure, (TRX + SOD2) reduced serine 51 phosphorylation by ~50%. In contrast, over the 2h-6h time frame, expression of (TRX + SOD2) reduced the increases in ATM phosphorylation and AMPKα phosphorylation by ~85% (p < 0.05). These data argue that the initial phosphorylation of eIF2α is not influenced by the generation of ROS, and that a portion of serine 51 signaling is always independent of ROS production. Equally, however, at later times, the production of ROS contributes to the prolongation of eIF2α S51 phosphorylation. Studies beyond the scope of the present manuscript will be required to define the sources of ROS generation in uveal melanoma cells, e.g. mitochondria, NADPH oxidase enzymes.
Figure 8. Neratinib and entinostat interact to increase reactive oxygen species production that is required for ATM-AMPK activation. (a). Uveal melanoma cells were treated with vehicle control or with [neratinib (100 nM) + entinostat (50 nM)] for 2h, 4h, 6h and 8h. At each time point, cells were incubated with DCFH-DA (5 μM) for 10 min, and then the fluorescence measured in a plate reader. (n = 3 ± SD) # p < 0.05 greater than corresponding entinostat alone value. (b). Uveal melanoma cells were transfected with an empty vector plasmid (CMV), a plasmid to express thioredoxin (TRX), a plasmid to express superoxide dismutase 2 (SOD2) or both proteins together. Twenty-four h after transfection, cells were treated with vehicle control or with [neratinib (100 nM) + entinostat (50 nM)] for 24h. Cells were then isolated, and viability determined via trypan blue exclusion assays (n = 3 ± SD). (c). Uveal melanoma cells were transfected with an empty vector plasmid (CMV) or with plasmids to express thioredoxin (TRX) and superoxide dismutase 2 (SOD2). Twenty-four h after transfection, cells were treated with vehicle control or with [neratinib (100 nM) + entinostat (50 nM)] for 2h, 4h, 6h and 8h. At each time point, cells were incubated with DCFH-DA (5 μM) for 10 min, and then the fluorescence measured in a plate reader. (n = 3 ± SD) * p < 0.05 less than corresponding value in CMV transfected cells. (d). Uveal melanoma cells were transfected with an empty vector plasmid or with plasmids to express TRX and SOD2. Twenty-four h after transfection, cells were treated with vehicle control or with [neratinib (100 nM) + entinostat (50 nM)] for 4h and 8h. Cells were fixed in place and immune-staining performed to detect the fluorescence intensity for each antibody/biomarker under each condition. Analyses for densitometric scanning of fluorescence intensity were performed at 10X magnification on > 120 cells per condition (n = 3 ± SD) * p < 0.05 less than corresponding value in CMV transfected cells.
![Figure 8. Neratinib and entinostat interact to increase reactive oxygen species production that is required for ATM-AMPK activation. (a). Uveal melanoma cells were treated with vehicle control or with [neratinib (100 nM) + entinostat (50 nM)] for 2h, 4h, 6h and 8h. At each time point, cells were incubated with DCFH-DA (5 μM) for 10 min, and then the fluorescence measured in a plate reader. (n = 3 ± SD) # p < 0.05 greater than corresponding entinostat alone value. (b). Uveal melanoma cells were transfected with an empty vector plasmid (CMV), a plasmid to express thioredoxin (TRX), a plasmid to express superoxide dismutase 2 (SOD2) or both proteins together. Twenty-four h after transfection, cells were treated with vehicle control or with [neratinib (100 nM) + entinostat (50 nM)] for 24h. Cells were then isolated, and viability determined via trypan blue exclusion assays (n = 3 ± SD). (c). Uveal melanoma cells were transfected with an empty vector plasmid (CMV) or with plasmids to express thioredoxin (TRX) and superoxide dismutase 2 (SOD2). Twenty-four h after transfection, cells were treated with vehicle control or with [neratinib (100 nM) + entinostat (50 nM)] for 2h, 4h, 6h and 8h. At each time point, cells were incubated with DCFH-DA (5 μM) for 10 min, and then the fluorescence measured in a plate reader. (n = 3 ± SD) * p < 0.05 less than corresponding value in CMV transfected cells. (d). Uveal melanoma cells were transfected with an empty vector plasmid or with plasmids to express TRX and SOD2. Twenty-four h after transfection, cells were treated with vehicle control or with [neratinib (100 nM) + entinostat (50 nM)] for 4h and 8h. Cells were fixed in place and immune-staining performed to detect the fluorescence intensity for each antibody/biomarker under each condition. Analyses for densitometric scanning of fluorescence intensity were performed at 10X magnification on > 120 cells per condition (n = 3 ± SD) * p < 0.05 less than corresponding value in CMV transfected cells.](/cms/asset/6d720349-d924-4272-b64a-f01526c62ef2/kcbt_a_1551747_f0008_oc.jpg)
Discussion
The present studies were performed to extend our analyses of how neratinib reduces the expression of RAS proteins and to determine whether the drug could also act to reduce the expression of mutant G alpha proteins that are expressed in ~90% of uveal melanoma cells. Neratinib, and to a greater extent when combined with the HDAC inhibitor entinostat, reduced the expression of K-RAS V12, Gαq and Gα11. Knock down of either Beclin1 or ATG5 prevented the down-regulation of these proteins. The killing caused by the [neratinib + entinostat] combination was dependent on multiple signals. A portion of the killing required signaling by ATM-AMPK that decreased mTOR activity and ULK-1 S757 phosphorylation, and increased ULK-1 S317 and ATG13 phosphorylation. Expression of activated mTOR prevented activation of ATM-AMPK signaling, ATG13 phosphorylation and the reduced expression of MCL-1 and BCL-XL. Over-expression of BCL-XL was protective whereas knock down of BCL-XL or MCL-1 enhanced killing. In cells exposed to [neratinib + entinostat] the expression of HSP70, HSP90 and HDAC6 rapidly declined, which would collectively predict for activation of the unfolded protein response; eIF2α became phosphorylated. The phosphorylation of eIF2α was both ROS-independent and ROS-dependent. Drug-induced reductions in the expression of MCL-1 and BCL-XL were also abolished in cells lacking eIF2α; expression of activated mTOR suppressed eIF2α phosphorylation. Knock down of the death receptor CD95, the docking protein FADD or over-expression of the caspase 8 inhibitor c-FLIP-s significantly reduced cell killing; as did knock down of RIP1 and RIP3. Collectively, our data indicate at least three nodes from where [neratinib + entinostat] initiates uveal melanoma cell death: (1) activation of an ATM-AMPK pathway; (2) activation of an eIF2α UPR pathway; (3) activation of a CD95 death receptor pathway.
[Neratinib + entinostat] exposure increased the levels of reactive oxygen species, and over-expression of thioredoxin and superoxide dismutase 2 quenched ROS production and suppressed drug combination lethality. Over-expression of TRX and SOD2 prevented the drug combination from activating ATM. The redox status of a tumor cell has previously been linked to the activity of cytosolic ATM.Citation37 Our data support the hypothesis that drug-induced ROS generation results in protein phosphatase inactivation that permits cytosolic ATM to become activated which in turn acts to activate the AMPK. Studies beyond the scope of the present manuscript will be required to define the sources of ROS generation, e.g. mitochondria, NADPH oxidase enzymes.
In multiple prior studies we have shown a diverse set of agents, and drug combinations, can activate the death receptor CD95. In primary hepatocytes, bile acid-induced activation of CD95 can both promote growth via JNK-AP-1 signaling or cell death via caspase 8.Citation38 In tumor cells, our observations have been that CD95 activation only promotes cell death.Citation19,Citation23 HDAC inhibitors can act to enhance the total expression of both CD95 and its ligand FAS-L, and not only did [neratinib + entinostat] enhance total expression of CD95, but also caused a greater cell surface localization of CD95, indicative of CD95 activation. Further studies will be required to define how CD95 becomes activated by this drug combination.
The molecular mechanisms by which neratinib as a single agent, and when combined with HDAC inhibitors, to reduce the expression levels of K-RAS, N-RAS, Gαq and Gα11 are still poorly understood. Clathrin-coated pits and caveolae are two major endocytic structures by which plasma membrane-derived cargo is often transported into cells by coordinated formation of plasma membrane invaginations that are primarily mediated by clathrin or caveolin, respectively Citation39. Cholesterol is one important molecular component of the plasma membrane and is involved in plasma membrane and endosomal trafficking; from other studies we know that drug combination-induced AMPK activation increases the phosphorylation of acetyl CoA carboxylase which reduces enzyme activity, lowering the levels of farnesyl- and geranylgeranyl prenylation substrates, which would reduce both plasma membrane cholesterol levels and the prenylation of K-RAS and N-RAS. Thus, down-regulation processes may proceed through a novel clathrin-independent mechanism.
We have previously demonstrated that the ability of neratinib to down-regulate the expression of mutant active ERBB1 in H1975 NSCLC cells requires a prior ubiquitination step, whereas that of c-MET did not.Citation19,Citation26 The ubiquitin hydrolase BAP-1 is often mutated in uveal melanoma, however this protein is in the nucleus and is unlikely to control ERBB1 ubiquitin levels.Citation40 This would suggest that another ERBB receptor is the primary target in this cell line for the actions of neratinib to reduce ERBB1 and c-MET levels. Compared to H1975 cells, the PDX isolates of uveal melanoma express approximately one third the expression of ERBB1 and ERBB2. Nevertheless, in the uveal melanoma isolates neratinib as a single agent exhibited the ability to down-regulate K-RAS, N-RAS, Gαq and Gα11, suggesting that the amount of “neratinib target” does not have to be high to trigger gross receptor internalization and breakdown of GTP binding proteins.
Other studies have also used ‘modern’ drug modulators of signal transduction processes in the hope of discovering a new approach to control uveal melanoma. For example, signaling by ERK1/2 has been proposed as a tumor-driving pathway in uveal melanoma, however in the clinic, when combined with chemotherapy, the MEK1/2/5 inhibitor selumetinib did not improve progression free survival.Citation41 Others have published basic research demonstrating that mutant Gαq signaling to the ERK1/2 pathway requires RasGRP3 and RAS proteins themselves in the process.Citation42 It has been noted that inhibition of the ERK1/2 pathway causes a compensatory activation of c-MET in uveal melanoma tumors; our preliminary findings in uveal melanoma cells, as was observed in NSCLC cells, demonstrate that [neratinib + entinostat] reduce the protein expression of c-MET and c-KIT.Citation43 Although checkpoint inhibitory immunotherapy is a standard of care treatment for cutaneous melanomas, uveal melanomas do not respond to this modality.Citation44 Thus, our approach of combining neratinib with HDAC inhibitors may permit a greater level of tumor control than previously envisaged based on it down-regulating receptors, GTP proteins and causing a toxic autophagic response.
In conclusion, we believe that the most important and unique data in this manuscript is the absolute confirmation that neratinib, and, to a greater extent, neratinib plus HDAC inhibitors, rapidly reduces the protein expression of multiple oncogenic plasma membrane GTP binding proteins. We have validated our antibody immunofluorescence reagents and techniques for both K-RAS and N-RAS using siRNA approaches combined with the use of GFP- and RFP-tagged mutant K-RAS V12. This addresses the major concerns of Waters et al who demonstrated that the majority of commercially available anti-K-RAS and anti-N-RAS antibodies are non-specific.Citation27 Very recently, after publication of our initial studies concerning the interactions of neratinib, ERBB1 and RAS, Moll et al. and Kruspig et al. both presented confirmatory evidence, for example Moll et al. showing that the irreversible ERBB1/2/4 inhibitor afatinib both inhibited the expression and phosphorylation of ERBB2 in NSCLC cells expressing a mutant K-RAS.Citation19–Citation21,Citation45,Citation46 In agreement with our prior published data, Kruspig et al demonstrated that neratinib reduced the protein levels of ERBB1, ERBB2 and ERBB3 in NSCLC cells in vitro and in vivo, although neratinib concentrations four-fold greater than those safely achievable in a human patient were used. They also presented data, similar to our own, arguing that neratinib was a more potent inhibitor of ERBB receptor family function than afatinib.Citation19 Neither study definitively measured the impact of ERBB1/2/4 inhibitors on the levels or localization of mutant K-RAS.
Based on the data in the present manuscript using uveal melanoma isolates, and pancreatic and colorectal cancer cell lines, as well as the data references 20 and 24 using pancreatic and colorectal isolates, we hypothesize that the suicide ERBB1/2/4 inhibitor neratinib in combination with HDAC inhibitors or with the clinically relevant [regorafenib and sildenafil] treatment, may be safe and efficacious in mice, although this was not tested in this study. Our preclinical studies will lead to novel clinical investigations, and in fact, a new phase I study combining neratinib plus the HDAC inhibitor sodium valproate in all solid tumor patients will open at Virginia Commonwealth University/Massey Cancer Center in February 2019.
Materials and methods
Materials
Entinostat was purchased from Selleckchem (Houston, TX). Neratinib was supplied by Puma Biotechnology Inc. (Los Angeles, CA). Cell culture materials were purchased from GIBCOBRL (GIBCOBRL Life Technologies, Grand Island, NY). Established cell lines were purchased from the ATCC. PDX uveal melanoma isolates were provided by Dr. Kirkwood. PDX1 (TPF-16–75) was a soft tissue mass isolated from the abdomen; PDX2 (TPF-14–651) was isolated from the liver with the tumor having additional metastatic spread to the gallbladder and right adrenal gland; PDX3 (TPF09105000038) was isolated from the right hemisphere/brain; PDX4 (TPF25383) was a loco-regional recurrent uveal melanoma with invasive margins. The GFP and RFP tagged K-RAS V12 plasmids were provided by Dr. Hancock.Citation23 Antibodies directed against RAS proteins: Thermo-Fisher (Waltham MA) N-RAS PA5-14833; K-RAS PA5-44339. Based on data from Waters et al, we used two validated siRNA tools to knock down K-RAS or N-RAS; custom made NRAS-5 CCUGAGUACUGACCUAAGAdTdT and K-RAS Silencer s7940.Citation27 Other reagents and the performance of experimental procedures were all as described in references 20–24. Commercially available validated short hairpin RNA molecules to knock down RNA/protein levels were from Qiagen (Valencia, CA).The percentage knock down or over-expression of the specified proteins in P2 cells, 24h after transfection was: BAX, 82%; BAK, 80%; siBCL-XL, 79%; siMCL-1, 79%; CD95, 79%; AIF, 80%; FADD, 21%; RIP-1, 78%; RIP-3, 79%; ATM, 77%; AMPKα, 77%; ULK-1, 75%; ATG5, 76%; Beclin1, 75%; eIF2α, 77%; dom. neg. caspase 9, 144; SOD2, 150; TRX, 145; active mTOR, 154%; c-FLIP-s, 206%; BCL-XL, 176%.
Methods
Culture, transfection and in vitro exposure of cells to drugs
All cell lines were cultured at 37 °C (5% (v/v CO2) in vitro using RPMI supplemented with 5% (v/v) fetal calf serum and 10% (v/v) Non-essential amino acids. Cells were transfected with siRNA molecules or plasmids as described in prior manuscripts.Citation19–Citation23 Cells were transfected with plasmids to express GFP-K-RAS V12 and RFP-K-RAS V12 (0.1 μg) using lipofectamine 2000. Twenty-four h after transfection, cells were used in assays examining their staining for GFP and RFP.
Detection of protein expression and protein phosphorylation by immuno-fluorescence using a Hermes WiScan machine
http://www.idea-bio.com/.Citation19–Citation23 Trypan blue exclusion cell death analyses were performed using established protocols.Citation19–Citation23 For immuno-fluorescence studies, cells were visualized at either 10X or 60X. All immuno-fluorescent images for each individual protein/phospho-protein were taken using the identical machine settings. Images were processed at 9999 dpi and at 32 bit using Adobe Photoshop, and figures generated in Microsoft PowerPoint.
Assessment of ROS generation
Cells were plated in 96 well plates. Cells were treated with the drugs and 15 min prior to the indicated time point the media was removed and cells incubated with diacetate dihydro-DCF-DA (5 μM). Fluorescence measurements were obtained 15 minutes after DCFH-DA addition with a Vector 3 plate reader. Data are presented corrected for basal fluorescence of vehicle-treated cells at each time point and expressed as the arbitrary units provided by the plate reader/the increase in ROS levels.
Data analysis
Comparison of the effects of various treatments (in triplicate three times) was using one-way ANOVA and a two tailed Student’s t-test. Differences with a p-value of < 0.05 were considered statistically significant. Experiments are the means of multiple individual points from multiple experiments (± SEM).
Disclosure of Potential Conflicts of Interest
There are no conflicts of interest to report for LB, JLR, CS, JK, JFH, AP and PD. ASL is an employee and stockholder of Puma Biotechnology.
Acknowledgments
Thanks to Dr. H.F. Young and the Betts family fund for support in the purchase of the Hermes Wiscan instrument.
Additional information
Funding
References
- PDQ Adult Treatment Editorial Board. Intraocular (Uveal) melanoma treatment (PDQ®): health professional version. PDQ cancer information summaries [Internet]. Bethesda (MD): National Cancer Institute (US); 2002–2018 Sep 20.
- Amaro A, Gangemi R, Piaggio F, Angelini G, Barisione G, Ferrini S, Pfeffer U. The biology of uveal melanoma. Cancer Metastasis Rev. 2017;36:109–140.
- Tschentscher F, Hüsing J, Hölter T, Kruse E, Dresen IG, Jöckel KH, Anastassiou G, Schilling H, Bornfeld N, Horsthemke B, et al. Tumor classification based on gene expression profiling shows that uveal melanomas with and without monosomy 3 represent two distinct entities. Cancer Res. 2003;63:2578–2584.
- Khan AQ, Kuttikrishnan S, Siveen KS, Prabhu KS, Shanmugakonar M, Al-Naemi HA, Haris M, Dermime S, Uddin S. RAS-mediated oncogenic signaling pathways in human malignancies. Semin Cancer Biol. 2018 Mar 7;S1044-579X(18)30002–6.
- Decatur CL, Ong E, Garg N, Anbunathan H, Bowcock AM, Field MG, Harbour JW. Driver Mutations in Uveal Melanoma: associations with gene expression profile and patient outcomes. JAMA Ophthalmol. 2016;134:728–733. doi:10.1001/jamaophthalmol.2016.0903.
- O’Hayre M, Degese MS, Gutkind JS. Novel insights into G protein and G protein-coupled receptor signaling in cancer. Curr Opin Cell Biol. 2014;27:126–135. doi:10.1016/j.ceb.2014.01.005.
- Van Raamsdonk CD, Bezrookove V, Green G, Bauer J, Gaugler L, O’Brien JM, Simpson EM, Barsh GS, Bastian BC. Frequent somatic mutations of GNAQ in uveal melanoma and blue naevi. Nature. 2009;457:599–602. doi:10.1038/nature07586.
- Van Raamsdonk CD, Griewank KG, Crosby MB, Garrido MC, Vemula S, Wiesner T, Obenauf AC, Wackernagel W, Green G, Bouvier N, et al. Mutations in GNA11 in uveal melanoma. N Engl J Med. 2010;363:2191–2199. doi:10.1056/NEJMoa1011205.
- Koopmans AE, Vaarwater J, Paridaens D, Naus NC, Kilic E, de Klein A. Patient survival in uveal melanoma is not affected by oncogenic mutations in GNAQ and GNA11. Br J Cancer. 2013;109:493–496. doi:10.1038/bjc.2013.299.
- Onken MD, Worley LA, Long MD, Duan S, Council ML, Bowcock AM, Harbour JW. Oncogenic mutations in GNAQ occur early in uveal melanoma. Invest Ophthalmol Vis Sci. 2008;49:5230–5234. doi:10.1167/iovs.07-0624.
- Onken MD, Worley LA, Ehlers JP, Harbour JW. Gene expression profiling in uveal melanoma reveals two molecular classes and predicts metastatic death. Cancer Res. 2004;64:7205–7209. doi:10.1158/0008-5472.CAN-04-1750.
- Griewank KG, van de Nes J, Schilling B, Moll I, Sucker A, Kakavand H, Haydu LE, Asher M, Zimmer L, Hillen U, et al. Genetic and clinico-pathologic analysis of metastatic uveal melanoma. Mod Pathol. 2014;27:175–183. doi:10.1038/modpathol.2013.138.
- Giulietti M, Vivenzio V, Piva F1, Principato G, Bellantuono C, Nardi B. How much do we know about the coupling of G-proteins to serotonin receptors? Mol Brain. 2014;7:49. doi:10.1186/s13041-014-0049-y.
- Ivey K, Tyson B, Ukidwe P, McFadden DG, Levi G, Olson EN, Srivastava D, Wilkie TM. Galphaq and Galpha11 proteins mediate endothelin-1 signaling in neural crest-derived pharyngeal arch mesenchyme. Dev Biol. 2003;255:230–237.
- Moore AR, Ceraudo E, Sher JJ, Guan Y, Shoushtari AN, Chang MT, Zhang JQ, Walczak EG, Kazmi MA, Taylor BS, et al. Recurrent activating mutations of G-protein-coupled receptor CYSLTR2 in uveal melanoma. Nature Genetics. 2016;48:675–680. doi:10.1038/ng.3549.
- Johansson P, Aoude LG, Wadt K, Glasson WJ, Warrier SK, Hewitt AW, Kiilgaard JF, Heegaard S, Isaacs T, Franchina M, et al. Deep sequencing of uveal melanoma identifies a recurrent mutation in PLCB4. Oncotarget. 2016;7:4624–4631. doi:10.18632/oncotarget.6614.
- Johansson P, Aoude LG, Wadt K, Glasson WJ, Warrier SK, Hewitt AW, Kiilgaard JF, Heegaard S, Isaacs T, Franchina M, et al. Deep sequencing of uveal melanoma identifies a recurrent mutation in PLCB4. Oncotarget. 2016;7:4624–4631. doi:10.18632/oncotarget.6614.
- Lyon AM, Tesmer JJ. Structural insights into phospholipase C-beta function. Mol Pharmacol. 2013;84:488–500. doi:10.1124/mol.113.087403.
- Booth L, Roberts JL, Poklepovic A, Avogadri-Connors F, Cutler RE, Lalani AS, Dent P. HDAC inhibitors enhance neratinib activity and when combined enhance the actions of an anti-PD-1 immunomodulatory antibody in vivo. Oncotarget. 2017;8:90262–90277. doi:10.18632/oncotarget.21660.
- Booth L, Roberts JL, Poklepovic A, Kirkwood J, Sander C, Avogadri-Connors F, Cutler RE Jr, Lalani AS, Dent P. The levels of mutant K-RAS and mutant N-RAS are rapidly reduced in a Beclin1/ATG5 -dependent fashion by the irreversible ERBB1/2/4 inhibitor neratinib. Cancer Biol Ther. 2018;19:132–137. doi:10.1080/15384047.2017.1394556.
- Booth L, Roberts JL, Rais R, Kirkwood J, Avogadri-Connors F, Cutler RE Jr, Lalani AS, Poklepovic A, Dent P. [Neratinib + Valproate] exposure permanently reduces ERBB1 and RAS expression in 4T1 mammary tumors and enhances M1 macrophage infiltration. Oncotarget. 2017;9:6062–6074. doi:10.18632/oncotarget.23681.
- Booth L, Roberts JL, Rais R, Cutler RE Jr, Diala I, Lalani AS, Poklepovic A, Dent P. Palbociclib augments Neratinib killing of tumor cells that is further enhanced by HDAC inhibition. Cancer Biol Ther. 2018 Sep;5:1–12. doi:10.1080/15384047.2018.1507665.
- Booth L, Roberts JL, Rais R, Cutler RE Jr, Diala I, Lalani AS, Hancock JF, Poklepovic A, Dent P. Neratinib augments the lethality of [regorafenib + sildenafil]. J Cell Physiol. 2018 Sep 10. doi:10.1002/jcp.27276.
- Yacoub A, Hawkins W, Hanna D, Young H, Park MA, Grant M, Roberts JD, Curiel DT, Fisher PB, Valerie K, et al. Human chorionic gonadotropin modulates prostate cancer cell survival after irradiation or HMG CoA reductase inhibitor treatment. Mol Pharmacol. 2007;71:259–275. doi:10.1124/mol.106.031153.
- George AJ, Hannan RD, Thomas WG. Unravelling the molecular complexity of GPCR-mediated EGFR transactivation using functional genomics approaches. FEBS J. 2013;280:5258–5268. doi:10.1111/febs.12509.
- Booth L, Roberts JL, Tavallai M, Webb T, Leon D, Chen J, McGuire WP, Poklepovic A, Dent P. The afatinib resistance of in vivo generated H1975 lung cancer cell clones is mediated by SRC/ERBB3/c-KIT/c-MET compensatory survival signaling. Oncotarget. 2016;7:19620–19630. doi:10.18632/oncotarget.7746.
- Waters AM, Ozkan-Dagliyan I, Vaseva AV, Fer N, Strathern LA, Hobbs GA, Tessier-Cloutier B, Gillette WK, Bagni R, Whiteley GR, et al. Evaluation of the selectivity and sensitivity of isoform- and mutation-specific RAS antibodies. Sci Signal. 2017;10:eaao3332. doi:10.1126/scisignal.aao3332.
- Patra KC, Kato Y, Mizukami Y, Widholz S, Boukhali M, Revenco I, Grossman EA, Ji F, Sadreyev RI, Liss AS, et al. Mutant GNAS drives pancreatic tumourigenesis by inducing PKA-mediated SIK suppression and reprogramming lipid metabolism. Nat Cell Biol. 2018;20:811–822. doi:10.1038/s41556-018-0122-3.
- Ryland GL, Hunter SM, Doyle MA, Caramia F, Li J, Rowley SM, Christie M, Allan PE, Stephens AN, Bowtell DD. Mutational landscape of mucinous ovarian carcinoma and its neoplastic precursors. Australian Ovarian Cancer Study Group, Campbell IG, Gorringe KL. Genome Med. 2015;7:87. doi:10.1186/s13073-015-0210-y.
- Cohen P, Hardie DG. The actions of cyclic AMP on biosynthetic processes are mediated indirectly by cyclic AMP-dependent protein kinase. Biochim Biophys Acta. 1991;1094:292–299.
- Cohen P. Dissection of the protein phosphorylation cascades involved in insulin and growth factor action. Biochem Soc Trans. 1993;21:555–567.
- Omar B, Zmuda-Trzebiatowska E, Manganiello V, Göransson O. Degerman E Regulation of AMP-activated protein kinase by cAMP in adipocytes: roles for regulation of AMP-activated protein kinase by cAMP in adipocytes: roles for phosphodiesterases, protein kinase B, protein kinase A, Epac and lipolysis. Cell Signal. 2009;21:760–766. doi:10.1016/j.cellsig.2009.01.015.
- Levy JMM, Towers CG, Thorburn A. Targeting autophagy in cancer. Nat Rev Cancer. 2017;17:528–542. doi:10.1038/nrc.2017.53.
- Vaque JP, Dorsam RT, Feng X, Iglesias-Bartolome R, Forsthoefel DJ, Chen Q, Debant A., Seeger M.A., Ksander B.R., Teramoto H, et al. A genome-wide RNAi screen reveals a Trio-regulated Rho GTPase circuitry transducing mitogenic signals initiated by G protein-coupled receptors. Mol Cell. 2013;49:94–108. doi:10.1016/j.molcel.2012.10.018.
- Yonekawa T, Gamez G, Kim J, Tan AC, Thorburn J, Gump J, Thorburn A, Morgan MJ. RIP1 negatively regulates basal autophagic flux through TFEB to control sensitivity to apoptosis. EMBO Rep. 2015;16:700–708. doi:10.15252/embr.201439496.
- Booth L, Roberts JL, Sander C, Lee J, Kirkwood JM, Poklepovic A, Dent P. The HDAC inhibitor AR42 interacts with pazopanib to kill trametinib/dabrafenib-resistant melanoma cells in vitro and in vivo. Oncotarget. 2017;8:16367–16386. doi:10.18632/oncotarget.14829.
- Tripathi DN, Chowdhury R, Trudel LJ, Tee AR, Slack RS, Walker CL, Wogan GN. Reactive nitrogen species regulate autophagy through ATM-AMPK-TSC2-mediated suppression of mTORC1. Proc Natl Acad Sci U S A. 2013;110:E2950–7. doi:10.1073/pnas.1307736110.
- Qiao L, Studer E, Leach K, McKinstry R, Gupta S, Decker R, Kukreja R, Valerie K, Nagarkatti P, El Deiry W, et al. Deoxycholic acid (DCA) causes ligand-independent activation of epidermal growth factor receptor (EGFR) and FAS receptor in primary hepatocytes: inhibition of EGFR/mitogen-activated protein kinase-signaling module enhances DCA-induced apoptosis. Mol Biol Cell. 2001;12:2629–2645. doi:10.1091/mbc.12.9.2629.
- Delos Santos RC, Garay C, Antonescu CN. Charming neighborhoods on the cell surface: plasma membrane microdomains regulate receptor tyrosine kinase signaling. Cell Signal. 2015;27:1963–1976. doi:10.1016/j.cellsig.2015.07.004.
- Jensen DE1, Rauscher FJ 3rd. BAP1, a candidate tumor suppressor protein that interacts with BRCA1. Ann N Y Acad Sci. 1999;886:191–194.
- Carvajal RD, Piperno-Neumann S, Kapiteijn E, Chapman PB, Frank S, Joshua AM, Piulats JM, Wolter P, Cocquyt V, Chmielowski B, et al. Selumetinib in combination with Dacarbazine in patients with Metastatic Uveal Melanoma: a phase III, multicenter, randomized trial (SUMIT). J Clin Oncol. 2018;36:1232–1239. doi:10.1200/JCO.2017.74.1090.
- Chen X, Wu Q, Depeille P, Chen P, Thornton S, Kalirai H, Coupland SE, Roose JP, Bastian BC. RasGRP3 mediates MAPK pathway activation in GNAQ mutant uveal melanoma. Cancer Cell. 2017;31:685–696. doi:10.1016/j.ccell.2017.04.002.
- Cheng H, Chua V, Liao C, Purwin TJ, Terai M, Kageyama K, Davies MA, Sato T, Aplin AE. Co-targeting HGF/cMET signaling with MEK inhibitors in metastatic uveal melanoma. Mol Cancer Ther. 2017;16:516–528. doi:10.1158/1535-7163.MCT-16-0552.
- Kirchberger MC, Moreira A, Erdmann M, Schuler G, Heinzerling L. Real world experience in low-dose ipilimumab in combination with PD-1 blockade in advanced melanoma patients. Oncotarget. 2018;9:28903–28909. doi:10.18632/oncotarget.25627.
- Moll HP, Pranz K, Musteanu M, Grabner B, Hruschka N, Mohrherr J, Aigner P, Stiedl P, Brcic L, Laszlo V, et al. Afatinib restrains K-RAS-driven lung tumorigenesis. Sci Transl Med. 2018;10:eaao2301. doi:10.1126/scitranslmed.aao4496.
- Kruspig B, Monteverde T, Neidler S, Hock A, Kerr E, Nixon C, Clark W, Hedley A, Laing S, Coffelt SB, et al. The ERBB network facilitates KRAS-driven lung tumorigenesis. Sci Transl Med. 2018;10:eaao2565. doi:10.1126/scitranslmed.aao4496.