
ABSTRACT
We intended to explore the effect of miR-202-5p and phosphatase and tensin homolog (PTEN) on doxorubicin (DOX) resistance of breast cancer cells. The result of quantitative reverse transcription-polymerase chain reaction (qRT-PCR) reveals that miR-202-5p was highly expressed in drug-resistant breast cancer tissues, while PTEN was expressed less. MiR-202-5p directly targeted PTEN. Further, it was found that the overexpression of miR-202-5p promoted the DOX resistance and proliferation as well as decreased apoptosis of MCF-7 cells. The lower expression of miR-202-5p inhibited DOX resistance and proliferation as well as increased the apoptosis of MCF-7/DOX cells. In vivo experiments showed that mice with downregulated miR-202-5p had smaller tumor volume and lower Ki67 level. The overexpression of PTEN declined the proliferation of MCF7 cells, while miR-202-5p's overexpression could offset the function of overexpression of PTEN. The knockdown of PTEN promoted MCF7/DOX cell proliferation that could be counteracted by miR-202-5p silence. Moreover, we also revealed that downregulated miR-202-5p expression inhibited PI3k/Akt signaling pathway-related protein by regulating expression of PTEN.
Introduction
Breast cancer primarily occurs among females and is one of most malignant neoplasia with the incidence increasing annually.Citation1 Living quality, genetic factors and environmental factors have been believed to be associated with the incidence of breast cancer.Citation2 The main therapies for breast cancer treatment included anticancer drugs, hormonal therapy, targeted drugs or a combination.Citation3 As well known, researchers have found that drug resistance is a vital barrier in breast cancer treatment. Doxorubicin (DOX) is proved to be effective in reducing the recurrence and mortality of breast cancer patients; however, the acquired resistance to DOX results in poor outcomes.Citation4 Therefore, more attention has been paid to the investigation of drug resistance.
MicroRNAs (miRNAs) are small non-coding RNA molecules, accounting for about 1% of the human genome.Citation5 The main function of miRNAs is suppressing posttranscriptional gene expression to induce mRNA translation inhibition or degradation.Citation4 Besides, it has been found that aberrant expression of miRNAs is associated with physiological and pathological processes of human cancers at cellular levels, such as proliferation, apoptosis, invasion and drug resistance.Citation6–Citation9 MiR-202 has been confirmed to be either a tumor suppressor or a regulator of oncogenes in many types of cancer. MiR-202-3p was downregulated in cervical squamous cell carcinoma, colorectal cancer and follicular lymphoma.Citation10The highexpression of miR-202 in human endometrium and adipose tissue–derived stem cells might be linked to cell cycle control.Citation11
As a well-recognized tumor suppressor gene, phosphatase and tensin homolog (PTEN) involved in tumor cell proliferation, migration, apoptosis, drug resistance and signaling pathway.Citation4 Ectopic expression of PTEN has been found in a plethora of human neoplasms including breast cancer.Citation12 Besides, PTEN can be modulated by various miRNAs in human cancers. For instance, miR-106b caused cell radio resistance in colorectal cancer through PTEN/PI3K/Akt signaling pathway.Citation13 MiR-21 induced gemcitabine resistance via the PTEN/Akt pathway in breast cancer cells.Citation14 MiR-222 promoted adriamycin resistance of breast cancer cells by PTEN/Akt/FOXO1 signaling.Citation12
The expression levels of miR-202-5p and PTEN in breast cancer tissues and cells were determined. The target relationship between miR-202-5p and PTEN was also confirmed. Further, their influence on breast cancer cell proliferation, apoptosis and DOX resistance as well as the role of PI3K/Akt signaling pathway in resistance were also investigated. We may bring out novel therapy inspiration to explain the drug resistance in breast cancer treatment.
Results
Mir-202-5p was highly expressed in drug-resistant tissues and cells
MiR-202-5p overexpression was seen in DOX-resistant tissues (P < 0.05, ). We also found that miR-202-5p was highly expressed in MCF-7 and MCF-7/DOX cells compared with MCF-10A cells. MCF-7/DOX cells had a much higher miR-202-5p level than MCF-7 (P < 0.05(). qRT-PCR results showed that the miR-202-5p expression level in MCF-7 cells was upregulated by miR-202-5p mimics, and the expression in MCF-7/DOX cells was downregulated by miR-202-5p inhibitor (P < 0.05(Supplementary Figure 1(a,b)).
Figure 1. The expression level of miR-202-5p was high in drug-resistant tissues and cells. (a) The result of qRT-PCR showed miR-202-5p expression in resistant tissues (number = 23) and sensitive tissues (number = 39). *P < 0.05, compared with sensitive tissues. (b) The result of qRT-PCR showed miR-202-5p expression in MCF-7 and MFC-7/DOX cells. *P < 0.05, compared with MCF-10A group. #P < 0.05, compared with MCF-7 group.
PTEN was less expressed in drug-resistant breast cancer tissues and it was the target of mir-202-5p
PTEN under-expression was seen in DOX-resistant tissue samples and cells (P < 0.05, ). PTEN mRNA level and miR-202-5p level were negatively correlated ()). MiR-202-5p mimics significantly lowered PTEN level in MCF-7 cells, whereas miR-202-5p inhibitor significantly enhanced PTEN expression in MCF-7/DOX cells (P < 0.05, )). Based on the predicted binding sites on miR-202-5p and wild-type PTEN ()), we designed the dual-luciferase reporter gene assay. The results showed that miR-202-5p mimics significantly inhibited the relative luciferase activity of wild-type PTEN (P < 0.05, )), suggesting that miR-202-5p targeted PTEN.
Figure 2. MiR-202-5p targeted PTEN. (a) The result of qRT-PCR showed PTEN expression in resistant tissues (number = 23) and sensitive tissues (number = 39). *P < 0.05, compared with sensitive tissues. *P < 0.05, compared with resistant tissues. (b) The result of Pearson correlation analysis showed that PTEN expression was negatively correlated with miR-202-5p expression. (c) The result of qRT-PCR and western blot showed PTEN expression in MCF-7/DOX cells. **P < 0.01, compared with MCF-7 group. (d) The result of qRT-PCR and western blot showed PTEN expression in MCF-7 cells or MCF-7/DOX cells. *P < 0.05, compared with miR-NC group. #P < 0.05, compared with anti-miR-NC group. (e) The sequences of binding sites of miR-202-5p and wild-type PTEN as well as mutated-type PTEN were illustrated. (f) The result of dual-luciferase assay reveals that relative luciferase activity in PTEN-WT group and PTEN-MUT group. *P < 0.05, compared with miR-202-5p control group.
Overexpression of miR-202-5p promoted drug resistance and proliferation of breast cancer in vitro and in vivo
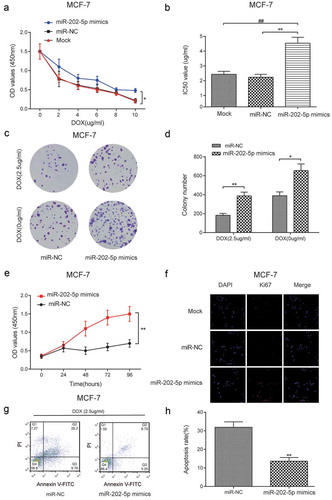
CCK8 results showed that the miR-202-5p mimics transfected cells promoted cell viability under different DOX concentrations (P < 0.05, )). The upregulated miR-202-5p increased the IC50 value in MCF-7cells (P < 0.01, )). Colony formation results indicated that miR-202-5p mimics increased colony formation rate to DOX of MCF-7 cells (). We also detected accelerated cell viability in miR-202-5p mimics transfected cells at 96 h (P < 0.01, )). The results of immunofluorescence staining showed that Ki67 expression was upregulated by the overexpression of miR-202-5p ()). Flow cytometry (FCM) indicated that the cell apoptosis was inhibited following miR-202-5p overexpression (P < 0.01, ).
Figure 3. Overexpressed miR-202-5p promoted proliferation and inhibited apoptosis of MCF-7 cells in vitro. (a) The result of CCK8 assay reveals that the OD value of MCF-7 cells in different groups. *P < 0.05, compared with miR-NC group. (b) The IC50 value in different groups was tested. **P < 0.01, compared with miR-NC group. ##P < 0.01, compared with Mock group. (c,d) The colony formation assay was performed to examine cell proliferation rate of DOX treating MCF-7 cells. *P < 0.05, **P < 0.01, compared with miR-NC group. (e) The cell proliferation rate was tested by CCK8 assay. **P < 0.01, compared with miR-NC group. (f) Ki67 expression level was examined by immunofluorescence staining. The blue color represented DAPI and the red color represents Ki67 expression (×40). (g,h) The apoptosis rate of MCF-7 cells was detected by flow cytometry. **P < 0.01, compared with miR-NC group.
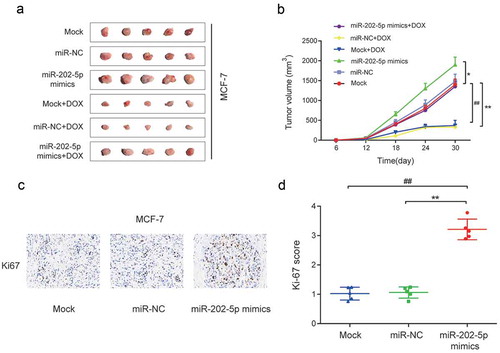
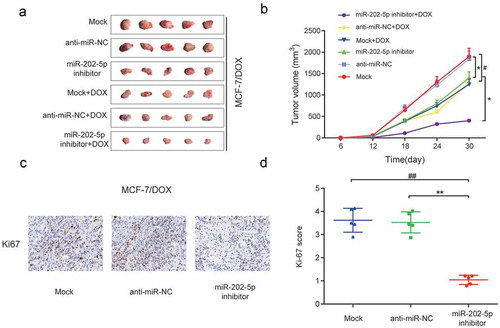
In vivo experiments showed that the tumor volume of miR-202-5p mimics group was significantly larger than that of the miR-NC group and Mock group, and a similar result was obtained after cells being treated with DOX (P < 0.05, ). The overexpressed miR-202-5p increased the Ki67 expression level in mice tissues (P < 0.01, ). Taken together, in vitro and in vivo results confirmed that the over-expressed miR-202-5p promoted the drug resistance and cell proliferation and inhibited cell apoptosis of MCF-7 cells.
Figure 4. Overexpressed miR-202-5p promoted proliferation of MCF-7 cells in vivo. (a) Tumor images in different transfection groups. (b) Tumor volume of different transfection groups for 30 days. *P < 0.05, **P < 0.01, compared with miR-NC group. ##P < 0.01, compared with Mock group. . (c) HE stain was performed to detect Ki67 expression in tumor tissues. (d) The graph of Ki-67 scores in different groups. **P < 0.01, compared with miR-NC group. ##P < 0.01, compared with Mock group.
Downregulation of miR-202-5p inhibited drug resistance and proliferation of breast cancer in vitro and in vivo
The result of CCK8 showed that the miR-202-5p inhibitor inhibited cell viability under different DOX concentrations (P < 0.05, )). MiR-202-5p inhibitor significantly lowered the IC50 of MCF-7/DOX cells (P < 0.01, )). Colony formation results indicated that miR-202-5p inhibitor decreased colony formation rate of MCF-7/DOX cells (). We also detected slow cell viability in miR-202-5p inhibitor transfected cells within 96 h (P < 0.01, )). The results of immunofluorescence staining showed that Ki67 was downregulated after the inhibition of miR-202-5p ()). FCM results indicated that the cell apoptosis was promoted by miR-202-5p inhibition (P < 0.01, ). Animal experiment results showed that the tumor volume of miR-202-5p inhibitor group was significantly decreased. Also, mice treated with DOX showed smaller tumor volume. Mice of miR-202-5p inhibitor + DOX group had the smallest tumor volume (P < 0.05, ). Mice of miR-202-5p inhibitor group showed significantly lower Ki67 level in tumor tissues (P < 0.01, ). Taken together, in vitro and in vivo results confirmed that the downregulated miR-202-5p inhibited drug resistance and cell proliferation but promoted cell apoptosis of MCF-7/DOX cells.
Figure 5. Downregulated miR-202-5p inhibited proliferation and promoted apoptosis of MCF-7/DOX cells in vitro. (a) The result of CCK8 assay showed that the OD value of MCF-7/DOX cells under different concentrations of DOX. *P < 0.05, compared with anti-miR-NC group (b) The IC50 value was downregulated in miR-202-5p inhibitor group. **P < 0.01, compared with anti-miR-NC group, ##P < 0.01, compared with Mock group. (c,d) The colony formation rate of MCF-7/DOX cells decreased by miR-202-5p inhibitor. *P < 0.05, **P < 0.01, compared with anti-miR-NC group. (e) CCK8 assay was performed to examine the cell proliferation rate. **P < 0.01, compared with anti-miR-NC group. **P < 0.01, compared with anti-miR-NC group. (f) Ki67 expression level was examined by immunofluorescence staining. The blue color was DAPI and the red color represents Ki67 expression (×40). (g,h) The apoptosis rate of MCF-7/DOX cells was detected by flow cytometry. **P < 0.01, compared with anti-miR-NC group.
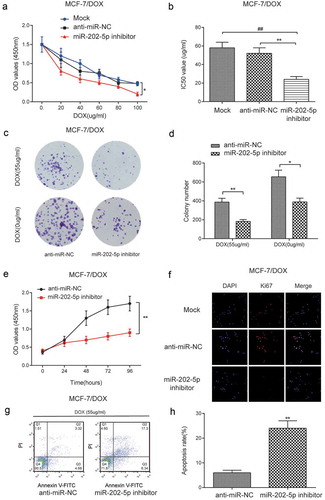
Figure 6. Inhibited miR-202-5p restrained proliferation of MCF-7/DOX cells in vivo. (a) Tumor images. (b) Tumor volume of different groups for 30 days. *P < 0.05, compared with anti-miR-NC group. #P < 0.05, compared with Mock group. (c) HE staining was performed to test Ki67 expression in tumor tissues. (d) The graph of Ki-67 scores in different groups. **P < 0.01, compared with anti-miR-NC group. ##P < 0.01, compared with Mock group.
Overexpression of miR-202-5p enhanced drug resistance and proliferation of MCF-7 cells via pten/pi3k/akt signaling pathway
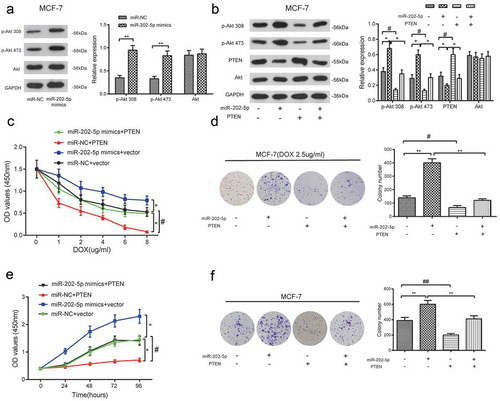
The levels of p-Akt 308 and p-Akt 473 were significantly upregulated in miR-202-5p mimics group ()). The total amount of Akt expression was not affected either (P < 0.05, )). CCK8 results revealed that miR-202-5p mimics promoted the proliferation of MCF-7 cells with the change of DOX dose and treatment time, and the overexpressed PTEN inhibited cell proliferation. The addition of PTEN also prevented the proliferation induced by miR-202-5p mimics (P < 0.05, ). MiR-202-5p mimics promoted the colony formation of MCF-7 cells, whereas PTEN overexpression inhibited it (P < 0.05, ). These results demonstrated that miR-202-5p might upregulate PI3K/Akt signaling through silencing PTEN.
Figure 7. The overexpression of miR-202-5p promoted MCF-7 cell proliferation through PTEN/PI3K/Akt signaling. (a) The protein expression levels of p-Akt 308 and p-Akt 473 in MCF-7 cells were detected by western blot. **P < 0.01, compared with miR-NC group. (b) The result of western blot reveals the protein expression levels of p-Akt 308, p-Akt 473 and PTEN. *P < 0.05, compared with miR-202-5p group. #P < 0.05, compared with PTEN group. (c) The OD value of MCF-7 cells in different transfection groups was detected by CCK8 assay. *P < 0.05, compared with miR-NC + vector group. #P < 0.05, compared with miR-202-5p mimics + PTEN group. (d) The colony formation rate of transfected MCF-7 cells under the treatment of DOX was detected. **P < 0.01, compared with miR-202-5p group. #P < 0.05, compared with PTEN group. (e) The OD values of transfected cells were measured at 0, 24, 48, 72, 96 h. *P < 0.05, compared with miR-NC + vector group. #P < 0.05, miR-202-5p mimics + PTEN group. (f) The colony formation rate of transfected MCF-7 cells without treatment of DOX, was revealed. **P < 0.05, compared with miR-202-5p group. ##P < 0.05, compared with PTEN group.
Downregulation of miR-202-5p decreased drug resistance and proliferation of MCF-7/DOX cells via pten/pi3k/Akt signaling
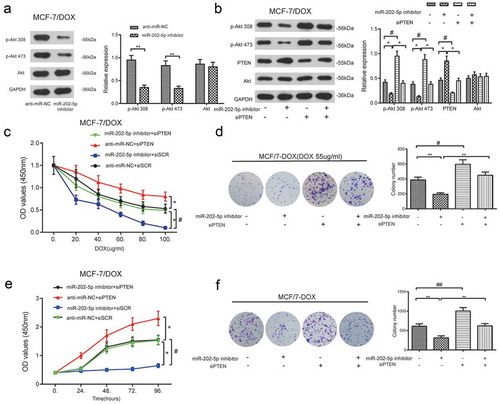
As shown in ), the protein levels of p-Akt 308 and p-Akt 473 in MCF-7/DOX cells were reduced after miR-202-5p inhibitor treatment, compared to the anti-miR-NC group (P < 0.01). Total Akt expression level was not changed. Changed p-Akt 308, p-Akt 473 and PTEN expressions were not detected in miR-202-5p inhibitor + siPTEN cells. The total amount of Akt expression was not affected either (P < 0.05, )). MiR-202-5p inhibitor retarded the proliferation of MCF-7/DOX cells, whereas the knockdown of PTEN promoted it. The treatment of siPTEN also prevented the proliferation of inhibition induced by the miR-202-5p inhibitor (P < 0.05, ). MiR-202-5p inhibitor decreased the colony formation of MCF-7/DOX cells, whereas siPTEN promoted it. At the same time, the addition of siPTEN induced the colony formation inhibited by the miR-202-5p inhibitor (P < 0.05, ). These results demonstrated that miR-202-5p might upregulate PI3K/Akt signaling through silencing PTEN.
Figure 8. The inhibition of miR-202-5p decreased MCF-7/DOX cell proliferation through PTEN/PI3K/Akt signaling. (a) The protein expression levels of p-Akt 308 and p-Akt 473 was examined by western blot. **P < 0.01, compared with anti-miR-NC group. (b) The result of western blot showed that the protein expression levels of p-Akt 308 and p-Akt 473. *P < 0.05, compared with anti-miR-202-5p inhibitor group. #P < 0.05, compared with siPTEN group. (c) The OD value of MCF-7/DOX cells was tested by CCK8 assay. *P < 0.05, compared with anti-miR-NC + siSCR group. #P < 0.05, miR-202-5p inhibitor + siPTEN group. (d) The colony formation of transfected MCF-7/DOX cells under the treatment of DOX was shown. **P < 0.01, compared with miR-202-5p inhibitor group. #P < 0.05, compared with siPTEN group. (e) The OD values of transfected cells were measured at 0, 24, 48, 72, 96 h. *P < 0.05, compared with anti-miR-NC + siSCR group. # P < 0.05, compared with miR-202-5p inhibitor + siPTEN group. (f) The colony formation of transfected MCF-7/DOX cells without treatment of DOX was revealed. **P < 0.01, compared with miR-202-5p inhibitor group. ##P < 0.01, compared with siPTEN group.
Discussion
MiR-202-5p was highly expressed in DOX resistance breast cancer tissues and cells, while PTEN was less expressed. We then proved that miR-202-5p targeted and downregulated PTEN. Overexpressed miR-202-5p promoted DOX resistance and cell proliferation as well as inhibited apoptosis of MCF-7 cells, while downregulated miR-202-5p performed opposite functions in MCF-7/DOX cells. It was unraveled that miR-202-5p enhanced DOX resistance of breast cancer cells through the PTEN/PI3K/Akt pathway.
Previous studies found that miR-202 was differentially expressed in various cancers. For instance, miR-202 was less expressed in multiple myeloma cells.Citation15 Upregulated miR-202 was found in the serum of clear cell carcinomas of the ovary.Citation16 Zhao et al. pointed out that miR-202-3p level was negatively correlated with the tumor size of gastric cancer (GC) patients with a significance of P= 0.013.Citation10 Joosse et al. proved that high serum level of miR-202 was an independent prognostic factor of breast cancer.Citation5 These conclusions indicated that miR-202 functioned as either a tumor suppressor or an oncogene, which depends on its expression level. In most cases, miRNAs performed functions by controlling the expression of target genes, such as inhibiting translation or activating mRNA degradation through complementary pairing with a 3ʹUTR sequence.Citation11 PTEN was reported to be a tumor suppressor in a few human cancers and can be targeted by various miRNAs. For instance, PTEN was directly targeted by miR-222 in GC.Citation12 Wang et al. found that miR-214 downregulated the PTEN expression level in breast cancer cells.Citation17 Similarly, in our study, we detected a high miR-202-5p expression level and less expressed PTEN in drug-resistant breast cancer tissues and cells. Then, we conducted a dual-luciferase reporter gene and found that miR-202-5p regulated the wild-type PTEN by directly binding to its 3ʹUTR.
Accumulating evidence showed that miRNAs mediated several processes in malignant tumors, such as drug resistance, proliferation and apoptosis. As for drug resistance, miR-222 was reported to be significantly upregulated in DOX-resistant breast cancer cells, and the inhibition of miR-222 sensitized MCF-7/DOX cells to chemotherapy.Citation18 Previous studies found that miR-224-3p was involved in the DOX resistance through regulating potential targets of breast cancer cells.Citation19 Yuan et al. found that overexpressed miR-130b stimulated DOX resistance in MCF-7 cells.Citation3 Besides, a few studies explored the function of miR-202 in various cancers. For instance, Lin et al. reported that miR-202 facilitated the cancer progression of osteosarcoma by suppressing cancer cells apoptosis and increasing DOX resistance.Citation20 The study of Shen et al. revealed that miR-202 inhibited the growth and survival of multiple myeloma cells.Citation15 MiR-202-3p significantly suppressed colorectal cancer cell proliferation by targeting ARL5A.Citation21 In addition, the proliferation of GC was found to be inhibited by miR-202.Citation10 However, the research of miR-202-5p in breast cancer cells is not sufficient. Our in vitro and in vivo experiments revealed that the overexpression of miR-202-5p promoted DOX resistance and proliferation of breast cancer cells.
It was proved that PI3K/Akt signaling pathway was connected with the processes of cell growth and programmed cell death, and its disrupted expression was frequently found in human cancers.Citation22 Besides, related studies showed that miRNAs and PTEN might regulate PI3K/Akt signaling pathway. For instance, PTEN was recognized as a negative regulator of PI3K/Akt signaling pathway.Citation23 Shen et al. found that upregulated miR-222 enhanced Akt phosphorylation and partially decreased the DOX sensitivity in breast cancer cells.Citation12 PTEN/PI3K/Akt signaling was regulated by miR-214, which therefore promoted breast cancer cell survival and decreased the apoptosis.Citation17 Thus, in our study, we detected the effect of PTEN/PI3K/Akt signaling pathway in the miR-202-5p-regulated cell proliferation and drug resistance. The results revealed that miR-202-5p decreased PTEN and increased p-Akt 308 and p-Akt 473 expressions. We further proved that upregulated miR-202-5p promoted DOX resistance and proliferation of breast cancer cells through PTEN/PI3K/Akt. These findings indicated that PTEN/PI3K/Akt pathway played vital roles in regulating cancer progression.
Our study may provide useful further study hints. For instance, the relationship between PTEN/PI3K/Akt signaling and miR-202-5p should be worth exploring in other human cancers. More target genes should also be included in further studies of breast cancer.
To sum up, miR-202-5p was high-expressed in breast cancer tissues and cells, targeted and downregulated PTEN expression. DOX-resistance of breast cancer cells was enhanced by miR-202-5p through PTEN/PI3K/Akt signaling. Our findings may bring up new strategies for breast cancer treatment.
Materials and methods
Human breast tissue samples
Human breast tissue samples were collected from 62 breast cancer patients that underwent surgery between March 2016 and October 2016 at Linyi People’s Hospital. Twenty-three patients were DOX-resistant, and 39 showed DOX sensitiveness. All patients signed on the experiment agreement.
Cell culture
MCF-10A (normal human mammary epithelial cell line) and MCF-7 (breast cancer cell line) were purchased from BeNa Culture Collection (Beijing, China). MCF-7 cell line with resistance to DOX (MCF-7/DOX) was successfully established by exposing MCF-7 (20 ng/ml) to gradually increased concentrations of DOX (5 nM a time, until 60 nM). MCF-10A cell line was cultured in RPMI 1640 (Invitrogen, USA) with 10% fetal bovine serum (FBS). MCF-7 cells were cultured in dulbecco’s modified eagle medium (Invitrogen, USA) with 10% FBS. MCF-7/DOX was cultured in RPMI 1640 (Invitrogen, USA) with 1 mg/L DOX.
Cell transfection
MiR-202-5p mimics, miR-NC, miR-202-5p inhibitor, anti-miR-NC, PTEN pEGFP-N2 (PTEN), control vector (vector), small interfering RNA of PTEN (siPTEN) and scramble siRNA of PTEN (siSCR) were purchased from FulenGen Co., Ltd (Shanghai, China). MiR-202-5p mimics, PTEN and vector were, respectively, transfected into MCF-7 cells, and miR-202-5p inhibitor, siPTEN and siSCR were transfected into MCF-7/DOX cells.
qRT-PCR
Total RNA was obtained from the cells using TRIzol reagent (Haoranbio, Shanghai, China). RNA was reverse-transcribed into cDNA using a reverse transcription (#BPI01030, Beijing Protein Innovation, Beijing, China). Then, approximately 2 µL cDNA was subjected to PCR using an UltraSYBR Mixture kit (#KW0957B, BOYAO, Shanghai, China). The primers were designed by Sangon Biomart (Shanghai, China). GAPDH and U6 were used to normalize mRNA and miRNA, respectively. Primers are listed in , and the relative expression was calculated by 2−ΔΔCt method.
Table 1. Primer sequences.
Western blot assay
Total proteins were extracted and lysed with Radio-Immunoprecipitation Assay (RIPA) buffer (Solarbio, Beijing, China) containing 1% phenylmethanesulfonyl fluoride. Six hundred micrograms of proteins were electrophoretically separated and blotted onto a polyvinylidene fluoride membrane (BIOSCIENCE, Shanghai, China). The primary antibodies (anti-p-Akt 308, 1:1000, #ab38449; anti-p-Akt 473, 1:5000, #ab81283; anti-Akt, 1 μg/mL, #ab64148; anti-GAPDH, #ab8254, Abcam, Cambridge, MA, USA) were diluted with Tris Buffered saline Tween (TBST) and put into the membrane for an overnight incubation at 4 °C. Then, the membrane was incubated with Rabbit Anti-Human IgG H&L (HRP) (1:5000, Abcam, #ab6721, USA) for 2 h incubation. Chemiluminescence ECL detection kit (Millipore, Billerica, MA, USA) was used to visualize the protein bands.
FCM assay
Five microliters of Annexin V-FITC and 5 μL PI were added to the cell suspension and incubated for 20 min in dark.
Cell apoptosis was then measured by FCM. Annexin V-FITC and PI were purchased from Beyotime Biotechnology (Jiangsu, China).
Dual luciferase reporter gene assay
The MCF-7/DOX cells were grown in 6-well plates. pGL3-PTEN-3ʹUTR-wt or pGL3-PTEN-3ʹUTR-mut were constructed by inserting wild-type and mutated PTEN 3ʹUTR sequences into pGL3 vectors. The constructs were co-transfected with miR-202-5p mimics or negative control (NC). Two days later, the fluorescence activities of cells were detected.
Immunofluorescence staining
The cells were fixed in 4% paraformaldehyde for 30 min. Blocking was performed with 5% Bovine Serum Albumin (BSA) phosphate buffer solution (Solarbio, Beijing, China) for 1 h. After that, the cells were incubated with primary antibody (1 μg/mL, Santa Cruz, #sc-23900) and secondary antibodies (Santa Cruz, #sc-23900 PE). Subsequently, the cells were counterstained with 4,6-diamino-2-phenyl indole (DAPI) (Beyotime Biotechnology, Shanghai, China).
Nude mice experiments
Sixty male nude mice (4 weeks old) were purchased from Shanghai SLAC Experimental Animal Center (Shanghai, China). Thirty mice were randomly picked out, divided into six groups (Mock, miR-NC, miR-202-5p mimics, Mock + DOX, miR-NC + DOX, miR-202-5p mimics+DOX) and injected with different transfected MCF-7 cells (2 × 10⁶ cells) through the right limb. The rest of the mice were also equally divided into six groups (Mock, anti-miR-NC, miR-202-5p inhibitor, Mock + DOX, anti-miR-NC + DOX, miR-202-5p inhibitor + DOX), injected with transfected MCF-7/DOX cells (2 × 10⁶ cells) through right limb and treated with 7 mg/kg DOX every week. After 30 d, the mice were killed, the tumors were harvested. The tumor volume was calculated by 1/2 (length×width2).
Immunohistochemical staining and scoring
The mice tumor tissues were fixed in 4% paraformaldehyde, dehydrated in graded ethanol and embedded in paraffin. The tissues were sliced and peroxidase-deactivated, which were incubated with Ki67 antibody (2 µg/mL, Abcam, #ab15580) and streptavidin-HRP-conjugated antibody (Santa Cruz Biotech, USA). Ki67 expression was estimated by scoring system. Low-power magnification was used to observe the stained slides. For estimation, three areas were selected, including an area with a high labeling index, an area with a low labeling index and an overall representative area. Then, the positive ratios were estimated by breast pathologists, and the average ratio of the three areas was reported as the Ki67 score. Image-ProPlus 4.5 software (Media Cybernetics, USA) was used to assist with scoring.
Proliferation assay
Cell Counting Kit 8 (CCK8) was purchased from Beyotime (Jiangsu, China). Ten microliters of CCK8 were added to cell culture for 4 h.optical density (OD) value at 450 nm was measured every 24 h until 96 h using a microplate reader (Thermo Electron Corp, USA). In terms of colony formation assay, the cells grew for 14 days and were fixed with 10% formaldehyde. After fixation, cells were stained by 0.01% crystal violet. ImageJ (https://imagej.nih.gov/ij/) was used to assist with the colony counting.
Statistical analysis
GraphPad Prism 6.0 (https://www.graphpad.com/) was used for statistical analysis. Data were documented as mean± standard deviation. Student’s t-test and one-way analysis of variance were used for group comparison. P < 0.05 was considered to be statistically significant.
Conflict of interest
The authors confirm that there are no conflicts of interest.
Ethics approval and consent to participate
This study was authorized by Linyi People’s Hospital and obtained written informed consents from all the participants.
Supplemental Material
Download MS Word (177.2 KB)Acknowledgments
None.
Supplementary material
Supplemental data for this article can be accessed on the publisher’s website
Additional information
Funding
References
- He Y, Ding J, Lin Y, Li J, Shi Y, Wang J, Zhu Y, Wang K, Hu X. Gambogenic acid alters chemosensitivity of breast cancer cells to Adriamycin. BMC Complement Altern Med: 2015;15:181. doi:10.1186/s12906-015-0710-8.
- Yu ZG, Jia CX, Liu LY, Geng CZ, Tang JH, Zhang J, Zhang Q, Li YY, Ma ZB. The prevalence and correlates of breast cancer among women in Eastern China. PLoS One: 2012;7:e37784. doi:10.1371/journal.pone.0037784.
- Miao Y, Zheng W, Li N, Su Z, Zhao L, Zhou H, Jia L. MicroRNA-130b targets PTEN to mediate drug resistance and proliferation of breast cancer cells via the PI3K/Akt signaling pathway. Sci Rep: 2017;7:41942. doi:10.1038/srep41942.
- Chen Y, Sun Y, Chen L, Xu X, Zhang X, Wang B, Min L, Liu W. miRNA-200c increases the sensitivity of breast cancer cells to doxorubicin through the suppression of E-cadherin-mediated PTEN/Akt signaling. Mol Med Rep: 2013;7:1579–1584. doi:10.3892/mmr.2013.1403.
- Joosse SA, Muller V, Steinbach B, Pantel K, Schwarzenbach H. Circulating cell-free cancer-testis MAGE-A RNA, BORIS RNA, let-7b and miR-202 in the blood of patients with breast cancer and benign breast diseases. Br J Cancer: 2014;111:909–917. doi:10.1038/bjc.2014.360.
- Yuan Y, Anbalagan D, Lee LH, Samy RP, Shanmugam MK, Kumar AP, Sethi G, Lobie PE, Lim LH. ANXA1 inhibits miRNA-196a in a negative feedback loop through NF-kB and c-Myc to reduce breast cancer proliferation. Oncotarget: 2016;7:27007–27020. doi:10.18632/oncotarget.8875.
- Li P, Xie XB, Chen Q, Pang GL, Luo W, Tu JC, Zheng F, Liu SM, Han L, Zhang JK, et al. MiRNA-15a mediates cell cycle arrest and potentiates apoptosis in breast cancer cells by targeting synuclein-gamma. Asian Pac J Cancer Prev: 2014;15:6949–6954.
- Yang L, Li Q, Wang Q, Jiang Z, Zhang L. Silencing of miRNA-218 promotes migration and invasion of breast cancer via Slit2-Robo1 pathway. Biomed Pharmacother: 2012;66:535–540. doi:10.1016/j.biopha.2012.04.006.
- Kastl L, Brown I, Schofield AC. miRNA-34a is associated with docetaxel resistance in human breast cancer cells. Breast Cancer Res Treat: 2012;131:445–454. doi:10.1007/s10549-011-1424-3.
- Zhao Y, Li C, Wang M, Su L, Qu Y, Li J, Yu B, Yan M, Yu Y, Liu B, et al.. Decrease of miR-202-3p expression, a novel tumor suppressor, in gastric cancer. PLoS One: 2013;8:e69756. doi:10.1371/journal.pone.0069756.
- Li YG, He JH, Yu L, Hang ZP, Li W, Shun WH, Huang GX. microRNA202 suppresses MYCN expression under the control of E2F1 in the neuroblastoma cell line LAN5. Mol Med Rep: 2014;9:541–546. doi:10.3892/mmr.2013.1845.
- Shen H, Wang D, Li L, Yang S, Chen X, Zhou S, Zhong S, Zhao J, Tang J. MiR-222 promotes drug-resistance of breast cancer cells to adriamycin via modulation of PTEN/Akt/FOXO1 pathway. Gene: 2017;596:110–118. doi:10.1016/j.gene.2016.10.016.
- Zheng L, Zhang Y, Liu Y, Zhou M, Lu Y, Yuan L, Zhang C, Hong M, Wang S, Li X. MiR-106b induces cell radioresistance via the PTEN/PI3K/AKT pathways and p21 in colorectal cancer. J Transl Med: 2015;13:252. doi:10.1186/s12967-015-0592-z.
- Wu ZH, Tao ZH, Zhang J, Li T, Ni C, Xie J, Zhang JF, Hu XC. MiRNA-21 induces epithelial to mesenchymal transition and gemcitabine resistance via the PTEN/AKT pathway in breast cancer. Tumour Biol: 2016;37:7245–7254. doi:10.1007/s13277-015-4604-7.
- Shen X, Guo Y, Qi J, Shi W, Wu X, Ni H, Ju S. Study on the association between miRNA-202 expression and drug sensitivity in multiple myeloma cells. Pathol Oncol Res: 2016;22:531–539. doi:10.1007/s12253-015-0035-4.
- Chao A, Lai CH, Chen HC, Lin CY, Tsai CL, Tang YH, Huang HJ, Lin CT, Chen MY, Huang KG, et al. Serum microRNAs in clear cell carcinoma of the ovary. Taiwan J Obstet Gynecol: 2014;53:536–541. doi:10.1016/j.tjog.2014.07.005.
- Wang F, Li L, Chen Z, Zhu M, Gu Y. MicroRNA-214 acts as a potential oncogene in breast cancer by targeting the PTEN-PI3K/Akt signaling pathway. Int J Mol Med: 2016;37:1421–1428. doi:10.3892/ijmm.2016.2518.
- Zhong S, Li W, Chen Z, Xu J, Zhao J. MiR-222 and miR-29a contribute to the drug-resistance of breast cancer cells. Gene: 2013;531:8–14. doi:10.1016/j.gene.2013.08.062.
- Feng X, Zhao L, Gao S, Song X, Dong W, Zhao Y, Zhou H, Cheng L, Miao X, Jia L. Increased fucosylation has a pivotal role in multidrug resistance of breast cancer cells through miR-224-3p targeting FUT4. Gene: 2016;578:232–241. doi:10.1016/j.gene.2015.12.028.
- Lin Z, Song D, Wei H, Yang X, Liu T, Yan W, Xiao J. TGF-beta1-induced miR-202 mediates drug resistance by inhibiting apoptosis in human osteosarcoma. J Cancer Res Clin Oncol: 2016;142:239–246. doi:10.1007/s00432-015-2028-9.
- Wang Q, Huang Z, Guo W, Ni S, Xiao X, Wang L, Huang D, Tan C, Xu Q, Zha R, et al. microRNA-202-3p inhibits cell proliferation by targeting ADP-ribosylation factor-like 5A in human colorectal carcinoma. Clin Cancer Res: 2014;20:1146–1157. doi:10.1158/1078-0432.CCR-13-1023.
- Slomovitz BM, Coleman RL. The PI3K/AKT/mTOR pathway as a therapeutic target in endometrial cancer. Clin Cancer Res: 2012;18:5856–5864. doi:10.1158/1078-0432.CCR-12-0662.
- Moon SH, Kim DK, Cha Y, Jeon I, Song J, Park KS. PI3K/Akt and Stat3 signaling regulated by PTEN control of the cancer stem cell population, proliferation and senescence in a glioblastoma cell line. Int J Oncol: 2013;42:921–928. doi:10.3892/ijo.2013.1765.