
ABSTRACT
Familial adenomatous polyposis (FAP) is an autosomal dominantly inherited intestinal polyposis syndrome accounting for about 1% of colorectal cancers (CRC). Despite increasing researches on the molecular pathogenesis of CRC, we are still unclear about metabolic pathways and alterations probably involved in the development of CRC. To obtain new insights into the mechanisms underlying APC mutation and to elucidate the mechanisms of CRC development, we performed to identify the potential metabolites in FAP based on metabolomic strategy. Serum metabolites from FAP patients (n = 30) and healthy individuals (n = 34) were detected and qualified using Ultra Performance Liquid Chromatography and Tandem Mass Spectrometry (UPLC− MS/MS). 118 metabolites were identified with statistical tests of orthogonal partial least-squares-discriminant analysis (OPLS−DA), with the conditions of variable importance in projection (VIP) >1, p < 0.05 using the Mann−Whitney U test, and fold change (FC) ≥2 or ≤0.5. OPLS-DA model was useful for distinguishing FAP patients from healthy controls. Unique metabolic signatures were pooled in FAP patients covering tricarboxylic acid (TCA) cycle, amino acids metabolism, vitamin D, fatty acids metabolism, and bile acids (BAs) metabolism. Our results demonstrated that metabolites alterations in FAP can be helpful for further analysis of metabonomics induced by APC mutation, and these alterations might be involved in the progress of intestinal carcinogenesis.
Introduction
FAP is an autosomal dominantly inherited intestinal polyposis syndrome caused by germline mutations in APC gene, characterized by hundreds to thousands of adenomatous polyps in the intestinal mucosa. Without intervention, there is an almost 100% cumulative risk of CRC at the age of 35–40 years old, as well as an increasing risk of various other malignant tumors.Citation1 CRC ranks third in terms of incidence but second in terms of mortality in the worldwide.Citation2 Most CRC derives from pre-existing benign adenomas. The adenoma-carcinoma sequence is the basis for development of colorectal cancer with corresponding accumulation of mutations in both oncogenes and tumor suppressor genes.Citation3,Citation4 It has been confirmed that APC gene, as the gatekeeper of colorectal carcinogenesis, has mutated in 80–90% sporadic CRC.Citation5 In addition, the mutation of APC occurs in early stages of CRC.Citation6
Recently, it has been speculated that the abnormal distribution of metabolites in blood and tissues may play a role in CRC development. However, it is still unclear which step contributed to the tumorigenesis.Citation7 Notably, the metabolic alterations affect the biological functions of essential metabolites if they occur in the process of tumorigenesis.Citation8,Citation9 APC mutation accompanied by activation of the WNT signal pathway seems to cause alterations in metabolite profiles.Citation10 Therefore, this study focused on the metabolite variations can provide the potential hints to better understand the biochemical mechanism of FAP and to identify the metabonomics alterations induced by APC mutation, as well as to elucidate the mechanisms of CRC development.
Metabonomics is an emerging field of research downstream from genomics, proteomics, and transcriptomics, and is a quantitative collection of low molecular weight compounds generated by metabolism.Citation11 Small-molecule metabolites are products of systemic biochemical regulations, and their expression levels can be regarded as a response of biological systems to genetic and environmental changes.Citation12 Identifying metabolites that account for the differences between the metabolic profiles of people with FAP and healthy controls can reveal important underlying molecular mechanisms of the disease. Recently, metabolomic profiling of tissue samples from CRC patients has revealed significant variations between the metabolites of tumor tissue and normal mucosa.Citation13,Citation14 However, till now, few studies on metabolomics variations of FAP have been conducted. The purpose of this study was to determine whether the variations in metabonomics of FAP were reflected in serum, and to gain knowledge of important metabolic variations associated with pathogenesis of FAP, which might be further utilized to improve FAP therapeutic strategies, and then have the opportunity to prevent FAP from CRC. Additionally, the elucidation of pathological conditions in metabonomics of FAP can also contribute to exploration of the variations induced by APC mutation in CRC patients.
Results
Serum metabolic profiles of FAP versus healthy controls and quality control
In this research, we used a targeted UPLC−MS/MS approach for comprehensive FAP serum metabolic profiling. A total of 479 metabolites, including 336 known metabolites were ultimately detected in the serum samples, involving organic acids, bile acids, lipids, free fatty acids, TCA cycle, and amino acids, vitamin D3, nucleotide. We researched on the variations of metabonomics among the samples based on the combination of metabonomics technology platform and multivariate statistical analysis.
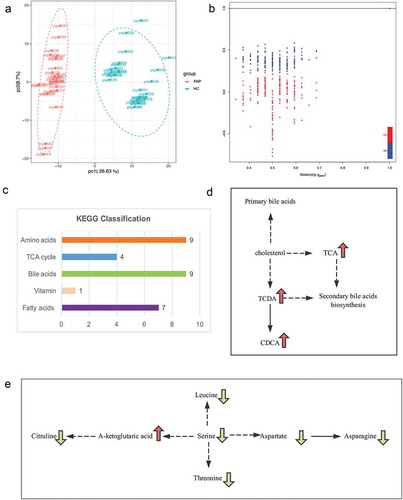
PCA scores plots showed the separation trend between FAP group and control group; therefore, it demonstrated a big difference between the groups. ()). Subsequently, the cross-validated OPLS-DA model was constructed and demonstrated satisfactory modeling and predictive abilities with 1 predictive component and 2 orthogonal components (R2X = 0.562, R2Ycum = 0.999, Q2cum = 0.997) based on the 479 metabolites ()). All of the results indicated that serum metabolic profile of FAP patients as determined by LC−MS/MS are distinct from that of healthy controls.
Figure 2. The different metabolite profilings between FAP and healthy controls. a. OPLS-DA plot (R2X, R2Y, and Q2 are the prediction parameters of the evaluation model, the closer these three indices are to 1, the more stable and reliable the model, Q2 > 0.5 can be considered as a valid model, Q2 > 0.9 can be considered as an excellent one). b. a cluster heat map of the metabolites with significant differences. c. Differential metabolites volcano diagram (Each point in the volcano plot represents a metabolite) d. The top 10 up-regulated (red-marked) and 10 down-regulated (green-marked) e. Statistics of Kyoto Encyclopedia of Genes and Genomes (KEGG) Enrichment (The color of the point is p-value, and the redder, the more significant enrichment. The size of the spot represents the number of different metabolites that are enriched.).
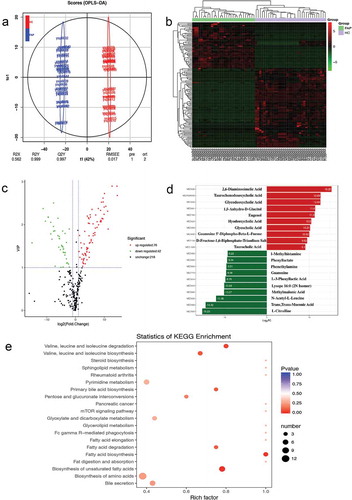
Figure 3. Bioinformatical screening between FAP and healthy controls. a. PCA diagram (X-axis represents the first principal component and Y-axis represents the second principal component. Each point represents a sample.). b. OPLS-DA analysis model verification diagram. c. The main KEGG classification in our study. d. The simplified KEGG maps of some bile acids (The arrow in green means down-regulated). e. The simplified KEGG maps of some amino acids (The arrow in green means down-regulated, the red means up-regulated).
Serum metabolic variations of FAP and cross-validation
Using this metabolic profiling system, targeted analysis of 479 metabolites was achieved for variable metabolites of more than 20 different chemical classes. The majority of these metabolites were associated with metabolic perturbations in FAP involving in biosynthesis of amino acids, fatty acids biosynthesis and degradation, bile secretion, primary bile acid biosynthesis, glyoxylate and dicarboxylate metabolism, and pyrimidine metabolism.
Based on the 479 metabolites, an OPLS-DA model was constructed with one predictive component and two orthogonal components with good model parameters ()) The permutation test assured the validity of the OPLS-DA model with all the R2 (cum) and Q2 (cum) values calculated from the permuted data were lower than the original ones in the validation plot(), the Y value was set at 1 for FAP and controls), so the model was proved to be validated.
These serum metabolites showing statistical significance between FAP patients and healthy controls were selected based on the Mann−Whitney U-test with a p < 0.05. According to the results of OPLS-DA model, we choose the metabolites meeting the conditions of VIP score threshold ≥1 and fold change(FC)≥2 or ≤0.5 (calculated based on mean ratios for FAP/healthy control) at the same time, subsequently, we got the ultimate differential metabolites. By combining FC with VIP from the OPLS-DA model, 118 metabolites, including 42 down-regulated and 76 up-regulated ones, were finally confirmed using reference standards among the differential variables. It was also shown that a good discrimination is apparent in the volcano plot in ). There are 25 metabolites with FC >100 (ranging from 118.5 to 38380.95) and 13 metabolites with FC < 0.001 (ranging from 8.01 × 10⁻³ to 2.56 × 10⁻⁵) when comparing the FAP patients to healthy controls.
In order to facilitate the observation of the alteration of metabolites, we normalized the metabolites with significant differences and mapped the cluster heat map ()). Compared with controls, L-citrulline was found to be the most decreased one among the identified metabolites in the FAP patients with the biggest fold change (FC = 38380.95). 2,6-diaminooimelic acid was the most increased metabolite (FC = 2.56 × 10⁻⁵) in FAP patients. The top 5 significantly up-regulated serum metabolites included 2,6-diaminooimelic acid, taurochenodeoxycholic acid, glycodeoxycholic acid, 1,5-Anhydro-D-Glucitol, and eugenol. The top 5 significantly down-regulated metabolites included L-citrulline, trans, trans-muconic acid, n-acetyl-l-leucine, methylmalonic acid, and lysope (16:0). (). The top 10 up-regulated and top 10 down-regulated metabolites are illustrated in and ). Using KEGG database, 91 key metabolic pathways altered in FAP patients were identified, 11 of them which mostly involve bile secretion, protein digestion and absorption, pyrimidine metabolism, phenylalanine metabolism, carbon metabolism, biosynthesis of unsaturated fatty acids, biosynthesis of amino acids, 2-oxocarboxylic acid metabolism, central carbon metabolism in cancer, aminoacyl-tRNA biosynthesis, ABC transporters ()). This study will mainly focus on the KEGG and metabolites in ) and . Additionally, the alterations of metabolites in two KEGG maps, amino acids metabolism, and bile acids metabolism, are illustrated in ,).
Table 1. The genetic testing information of FAP patients.
Table 2. Clinical features of two cohorts.
Table 3. The top 5 up-regulated and top 5 down-regulated metabolites for comparison of FAP patients and healthy controls.
Table 4. The top 10 up-regulated and top 10 down-regulated metabolites for comparison of FAP patients and healthy controls.
Table 5. The main metabolites in different pathway identified by KEGG analysis.
Discussion and conclusion
As expected from the notion that the tumor microenvironment induces many changes in many metabolite pathways. In recent years, a number of studies have focused on analyzing and monitoring disease-related metabolic alterations to explore more potential mechanisms, especially in malignant diseases. However, it is still unclear which step in the multi-stage process of carcinogenesis appear distorted metabonomics.Citation7 Mutations in the APC gene are responsible for FAP, a genetic predisposition to CRC, and are also found in the majority of sporadic colonic tumors. Therefore, an investigation of metabolites changes induced by APC mutation in FAP might help to elucidate the mechanisms of CRC development. Tomoo Yoshie et al. analyzed the metabolomics status of cells and tissues with APC gene mutation and found that APC gene might regulate amino acids-related pathways and other energy-related metabolome pathways.Citation10 The serum levels of various metabolites in APCmin/+ mice were significantly altered compared with those of the corresponding control mice. Therefore, APC mutation accompanied by activation of the WNT signal pathway seems to cause alterations in metabolite profiles. It is also noteworthy that there are only a few studies available so far regarding the metabolic shifts from APC mutation, however, just in SW480 cells expressing the truncated APC and APCmin/+ mice, not in FAP patients.Citation10 Some groups have made great efforts in illuminating the metabolomic features of CRC with varying results.Citation15–Citation17 In our study, we intended to analyze the metabolic changes in FAP patients in serum.
It was clear from our results that UPLC-MS analytical platforms were capable of discriminating the FAP from healthy controls. Our results further indicated that a clear metabolic signature of the disease state existed in the serum of patients with FAP. A number of differentially expressed metabolites involved in fatty acids metabolism, vitamin D, bile acid metabolism, TCA cycle, and also amino acids metabolism were observed in the FAP serum metabolic profiles.
The fatty acids metabolism
It has been hypothesized that abnormalities in fatty acid composition in blood and tissue may play a role in colorectal cancer.Citation7 However, it is not clear at what steps a possible distorted fatty acid metabolism occur in the multistage carcinogenesis process. In our study, as shown in , four lysope (lysope (16:0), lysope (16:0) (2n isomer), lysope (18:1), and lysope (18:0) (2n isomer)) and an n-6 PUFA, arachidonic acid (AA), were observed significantly higher in the serum of FAP patients compared with healthy controls. While two n-3 polyunsaturated fatty acid (PUFA), eicosapentaenoic acid (EPA) and docosahexaenoic acid (DHA) were decreased. AA is the direct precursor to the synthesis of prostaglandins (PGs) and thromboxanes. cyclooxygenase-1 (COX-1) and cyclooxygenase-2 (COX-2) can catalyze the conversion of AA to these eicosanoids endoperoxides. Generally, AA exists mainly in the form of phospholipids in living organisms. When cells are stimulated, Phospholipase A2 will degrade phospholipids to generate free AA. Rapid metabolism of AA and the elevated levels of COX-2 in colonic cells were found in various stages of the malignancy, suggesting a possible link between AA and the CRC.Citation18 According to some studies, AA increased the growth of colon cancer cells,Citation19 and FAP patients had high levels of AA and DHA in serum.Citation20 As reported in our study, the concentration of AA in FAP serum is elevated, which may be correlated with the high proliferation rate of the adenomas. Our results also showed that DHA, as well as EPA were decreased in FAP serum, correlated with the majority of findings of protective effect against development of colorectal adenomas.Citation21–Citation23 DHA has been shown to enhance many cellular responses involving in reducing cancer cell viability and decreasing proliferation both in vitro and in vivo. Enteric-coated EPA for 6 months significantly reduced rectal polyp number and size in FAP patients, as well as decreasing the global rectal polyp burden.Citation24 In addition, AA and EPA competed with each other in the COX-2 pathway and this competition increased the expression of COX-2, which will further enhance tumor growth consequently.Citation25 According to these data, it can be concluded that the elevated level of AA increased proliferation, whereas decreased DHA and EPA cannot suppress the AA-induced proliferation in FAP. Consequently, the distorted fatty acids profile partly leads to the proliferation of adenomas in FAP. More importantly, since these fatty acids can affect the growth of adenomas, it will be beneficial for the treatment of FAP and prevention of CRC.
Vitamin D
In our results, vitamin D was significantly decreased in FAP. A number of studies revealed that vitamin D was closely associated with colorectal adenomas. In a meta-analysis the researchers observed a significant inverse association between circulating 25(OH)D levels and colorectal adenoma.Citation26 Low circulating vitamin D levels were associated with increased polyp formation in the distal colon in female,Citation27 and diets deficient in vitamin D increased hyperplasia and proliferation of colonic crypt cells.Citation28 Experimental studies have shown that 1,25(OH)2D inhibited cellular proliferation and angiogenesis, induced differentiation and apoptosis.Citation29,Citation30 Additionally, in colorectal cancer cells experiment, vitamin D analogs can induce apoptosis by regulating the expression of genes involved in cell differentiation, which may prove that they’re clinically effective for the treatment of colorectal cancer.Citation31,Citation32 Therefore, the down-regulation of vitamin D3 in FAP corresponded with the abundant proliferation of adenoma. The low level of vitamin D3 promote the proliferation of adenomas and hyperplasia in some degree. However, the mechanism of vitamin D3 in FAP remained to be further determined. In vitro and in vivo studies, it has been suggested that vitamin D and APC/β-catenin signaling pathways had a potentially important relation. In SW480 cells, 1,25(OH)2D3 induced vitamin D receptor (VDR) nuclear translocation, promoted VDR-β-catenin interaction and prevented β-catenin nuclear translocation.Citation33 The physical interaction found in vitro between VDR and β-catenin suggested that VDR binding might prevent β-catenin translocation to the nucleus, or block the trans-activating activity of β-catenin in the nucleus.Citation34 Based on the studies, the possible molecular basis for this suppression involves in part blockade of the β-catenin signaling pathway via inhibition of β-catenin activity and promotion of its degradation in colonic epithelial cells through VDR-β-catenin interaction.
Bile acids metabolism
Another noteworthy metabolic feature of FAP subjects was the clearly increased bile acids profile, including taurochenodesoxycholic acid (TCDA), glycodeoxycholic acid (GDCA), hyodeoxycholic acid (HDCA), glycocholic acid (GCA), taurocholic acid (TCA), deoxycholic acid (DCA), glycoursodeoxycholic acid (GUDCA), glycochenodeoxycholic acid (GCDC), chenodeoxycholic acid (CDCA). As reported, DCA was higher in serum and bile of patients with colonic adenomas than in healthy controls.Citation35,Citation36 These BAs were found to be elevated in our data, probably due to the impact of Farnesoid X receptor (FXR). Modica et al. have shown that FXR expression is greatly reduced in FAP patients and APCmin/+ mice.Citation37 APC mutation induces the down-regulation of FXR, which governs the synthesis, transportation, and metabolism of BAs primarily by keeping the BAs concentration within the physiological range, thereby preventing BA-induced cytotoxicity.Citation38 The elevated BAs were considered to be a tumor promoter in human colorectal carcinogenesis. It has been demonstrated that they exert detrimental effects on the structure and function of the colon epithelium by mechanisms involving DNA oxidative damage, inflammation, NF-kB activation, and cell proliferation.Citation39 Besides, elevated BAs level also promote the release of AA, also resulting in proliferation, which was found to be increased in our study. Based on the previous studies and our results, it can be claimed that loss of FXR is associated with higher BAs concentrations and pro-tumorigenic phenotype. Consequently, an impaired activation of the APC-FXR axis in FAP patients will lead to elevated levels of BAs, strongly associated with the colonic proliferation rates, which in this case would not be detoxified and thus contribute to the acceleration and progression of CRC. The association of BAs with intestine carcinogenesis of FAP has made the regulation of BAs a candidate for aiding in therapeutic decisions.
TCA cycle
Additionally, several intermediates in TCA cycle such as D-malic acid, L-malic acid, A-ketoglutaric acid, D-aspartic acid were found to be increased in FAP. The disturbed intermediates in TCA cycle indicated an impaired mitochondrial respiration in FAP. It was shown that the levels of intermediates involved in the latter stages of the intracellular TCA cycle, including succinic acid, fumaric acid, and malic acid, were significantly higher in SW480 cells expressing truncated APC than in SW480 transfectants expressing full-length APC.Citation10 Additionally, in previous metabonomics studies,Citation14,Citation40 TCA cycle was impaired in CRC, resulting in a reduction of mitochondrial respiration. Altered energy metabolism is the emerging hallmark in cancer, such as Warburg effect, referring to the neoplastic cells favoring aerobic glycolysis, even in the presence of ample oxygen. The tumor micro-environment induces many changes in energetic metabolite pathways in order to gain sufficient energy for cell proliferation. These data along with ours indicated that the APC mutation might cause the increases in TCA cycle-related metabolite levels to gain more energy. It can be demonstrated that TCA cycle has been impaired partly in FAP patients even when there is no carcinogenesis, which may be partly attributed to the APC mutation. Meanwhile, FAP patients need more energy for the growth of so many adenomas.
Amino acids metabolism
Actually, there has been no published research comparing MS-based serum amino acid profiles of FAP patients and controls so far. In our results, 9 amino acids, L-citrulline, L-threonine, L-isoleucine, L-leucine, L-cystine, L-aspartic acid, D-glutamic acid, L-serine, L-asparagine anhydrous whose concentrations were significantly decreased. The three amino acids of them identified in our study were related to urea cycle (citrulline, aspartic acid) and glutamine metabolism (glutamic acid). Tomoo Yoshie et al. found that the APC gene might regulate amino acid-related pathways and other energy-related metabolomics pathways.Citation10 APC mutation is the first step in development of colorectal cancer, and these results suggested that it caused variations in amino acid profiles, and then such changes might result in the formation of polyps. The finding of depleted amino acids in FAP may suggest the higher uptake and turnover of amino acids by the colonic cells to maintain rapid cell proliferation. Certain amino acids are synthesized by metabolic pathways, typically using TCA intermediates as precursors, such as alpha-ketoglutarate for glutamate and its derived amino acids, oxaloacetate for aspartate-derived amino acids. As higher consumption of glutamine in tumor cells has been reported to be necessary for the production of macromolecules such as fatty acids and nucleic acids,Citation41,Citation42 more circulating glutamic acid may be converted to glutamine in FAP patients to compensate for the higher consumption in polyps tissues. Therefore, it is necessary to study on the relationship between amino acid profiles and adenomas, and further on the amino acids profile comparation of FAP with CRC in order to learn more about the tumorigenesis of FAP.
L-fucose
L-fucose, which increased in polyps of APCmin/+ mice,Citation10 however, was found to be lower in the serum of FAP patients. Takeshi et al. found that patients with some cancers had significantly higher values for urinary free L-fucose than did the patients with benign diseases or the healthy subjects.Citation43 In addition, elevation of serum fucose levels has also been reported in cancer patients.Citation44–Citation46 But there are no data reporting on the serum level of L-fucose in FAP. However, an increased activity of a fucosyltransferase in extracts of colon tumors has been shown. Previous studies revealed fucosylation played roles in modulation of signal transduction pathways. Addition of fucose to the medium of cells with defects in the de novo pathway can restore fucosylation.Citation47 Additionally, it was further found that the intestinal pathology of a mouse model of fucosylation deficiency (GDP-4-keto-6-deoxymannose, Fx–/ – mice) was reversed by addition of fucose to the diet, which restored fucosylation via a salvage pathway. In the absence of fucosylation, dysplasia appeared and progressed to adenocarcinoma in up to 40% of mice.Citation48 These findings indicated that carcinogenesis in a subset of colon cancer is consequent to a molecular mechanism driven by fucosylation deficiency. According to our data, L-fucose was decreased in the serum of FAP, probably suggesting the fucosylation deficiency in FAP, which is in agreement with their latency to dysplasia and carcinogenesis.
KEGG analysis
By using KEGG pathway analysis, we attempted to delineate the pathology of FAP. There are 11 KEGG pathways containing more than 5 metabolites. Additionally, the identified pathways indeed reflect the characteristics of increased proliferation, altered carbohydrate metabolism, abnormal BAs metabolism, which is associated with the development of CRC. The ability to extrapolate on tumor biology is limited when using blood samples. Multiple processes contribute to the metabolomics of blood, including the role of tumor, the host’s response to malignancy, the gut microbiome and other environmental exposures. Therefore, in order to generate truly informative information from metabolomics, separate analysis of tumor, host, and microbiome will be required.
Our study has several strengths and limitations. This is the first comprehensive report on serum metabonimics of FAP patients, and the results were consistent with other related previous studies in animal models to some extent. Moreover, we intended to elucidate the mechanisms of CRC development by identifying the metabonomics alterations induced by APC mutation. However, we failed to get the difference of metabolic profiles between FAP and sporadic CRC patients because the onset age of FAP was significantly earlier than that of CRC, in this way the age of the two groups cannot match well. Besides, owing to the low incidence of FAP, we only got a small sample size, in this case, we cannot get an ideal ROC analysis. Therefore, the results should be validated in a bigger sample size, and FAP and age-matched sporadic CRC would be compared in further studies.
In this study, we intended to identify metabolic variations for FAP by using UPLC−MS/MS. Overall, our findings indicated that BAs, TCA cycle, vitamin D and some fatty acids may contribute to the development of FAP and CRC, as they showed strong associations with these findings and were dysregulated in serum. In addition, the results of this study provided a basis for assessing the direct effects of these metabolites in CRC development. Recently, it has been suggested that therapeutic approaches directed against metabolic disorders may be helpful for the treatment of malignant tumors.Citation49,Citation50 In this case, the metabolic profiling method described here may be useful to determine the complex changes in tumor metabolism, which will help us to monitor the carcinogenesis for FAP patients. Furthermore, analysis of metabolic variations in FAP can be used as a novel approach for molecular pathology to develop precise therapeutic methods and classifiers for predicting therapy response.
Materials and methods
Clinical samples
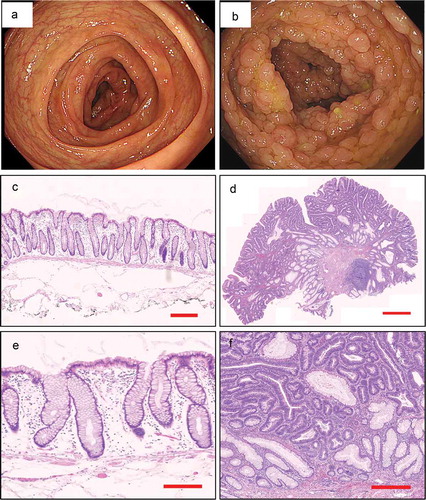
In total, 64 subjects, including 30 FAP patients and 34 healthy controls, were recruited from the Seventh Medical Center of Chinese PLA General Hospital. More than 100 adenomatous polyps were noted on colonoscopy in all of the FAP patients, and most of them have a family history of FAP or CRC. Genetic testing suggested that all the FAP patients have mutations in APC (). They had no signs of CRC and other cancers, and they did not receive any medical interventions such as COX-2 inhibitors and colectomy, etc. Healthy controls were identified from the outpatient matched to cases by age, gender, and race. The colonoscopy features and pathological characteristics of the two cohorts are shown in . The clinical features of all individuals are shown in . Serum specimens were collected within half an hour after blood taking and then kept at −80°C. All the patients signed consent forms. All procedures performed in studies involving human participants were in accordance with the ethical standards of the institutional and/or national research committee and with the 1964 Helsinki declaration and its later amendments or comparable ethical standards. The study was approved by the institutional ethics committees of the Seventh Medical Center of Chinese PLA General Hospital. (No.2018–49)
Figure 1. Endoscopic appearance and pathological characteristics of healthy control and FAP. a. The colonoscopy feature of healthy control. b. The colonoscopy feature of FAP. c, e. The pathological characteristics of healthy control (5x magnification, 200x magnification, respectively). d, f. The pathological characteristics of FAP (5x magnification, 200x magnification, respectively).
Sample preparation and extraction
The serum samples were stored at −80°C until needed and then thawed on ice just prior to extraction. 300 μl methanol was added to 100 μl of each sample to precipitate proteins. Each solution was then mixed on a mixer mill for 3 mins and centrifuged at 12000 rpm for 10 mins at 4°C. The supernatant of each sample was taken and again centrifuged again for 3 mins under the same conditions as the first time, and the supernatant after the second centrifugation was extracted for the following LC-MS/MS analysis.
LC-MS conditions
The data acquisition instrumentation system mainly includes UPLC (Shim-pack UFLC SHIMADZU CBM30A) and MS/MS (Applied Biosystems 4500 QTRAP). The analytical conditions were as follows: HPLC: column, Waters ACQUITY UPLC HSS T3 C18 (1.8 µm, 2.1 mm*100 mm); solvent system, water (0.04% acetic acid): acetonitrile (0.04% acetic acid); gradient program, 100:0 V/V at 0 min, 5:95V/V at 10.0 min, 5:95V/V at 11.0 min, 95:5 V/V at 11.1 min, 95:5 V/V at 15.0 min; flow rate, 0.35 ml/min; temperature, 40°C; and injection volume: 5 μl. The effluent was alternately connected to an ESI-triple quadrupole-linear ion trap (Q TRAP)-MS.
LIT and triple quadrupole (QQQ) scans were acquired on a triple quadrupole-linear ion trap mass spectrometer (Q TRAP) using an API 4500 Q TRAP LC/MS/MS System, which was equipped with an ESI Turbo Ion-Spray interface operated in positive and negative ion mode and controlled by Analyst 1.6.2 software (AB Sciex). The ESI source operation parameters were as follows: ion source, turbo spray; source temperature 550°C; ion spray voltage (IS) 5500 V; ion source gas I (GSI), gas II (GSII), curtain gas (CUR) were set at 55, 60, and 25.0 psi, respectively; and the collision gas (CAD) was high. Instrument tuning and mass calibration were performed with 10 and 100 μmol/L polypropylene glycol solutions in QQQ and LIT modes, respectively. The QQQ scans were acquired as MRM experiments with the collision gas (nitrogen) set to 5 psi. The DP and CE for individual MRM transitions were performed with further DP and CE optimization. A specific set of MRM transitions was monitored for each period according to the metabolites that were eluted within this period.
Metabolites qualitative and quantitative principles
Based on the self-database MWDB (metware database) and the public database of metabolites information, qualitative analysis of the first-order and second-order spectra detected by mass spectrometry was carried out. Some of these substances are qualitatively analyzed, removing isotopic signals, repetitive signals containing K+ ions, Na+ ions, and NH4+ ions, as well as repeated signals of fragmented ions that themselves are of larger molecular weight. Metabolite structure resolution is referenced in MassBank, KNAPSAcK, HMDB, existing mass spectrometry public databases such as MoTo DB and METLIN.
Quantitation of metabolites was accomplished using multiple reaction monitoring (MRM) triple quadrupole mass spectrometry. In the MRM mode, the quadrupole rod first screened precursor ions (parent ions) of the target substance to exclude ions corresponding to other molecular weight substances to initially eliminate the interference; the precursor ions were induced to ionize in the collision cell to form many fragment ions, fragment ions And then through the triple quadrupole filter to select the desired one of the characteristic fragment ions, excluding non-target ion interference, making more accurate quantitative and better repeatability. After obtaining the mass spectral analysis data of different samples, the peak areas of all the mass spectral peaks are integrated, and the mass spectral peaks of the same metabolites in different samples are integrated and corrected.
Quality control (QC)
From the samples of serum, aliquots of each of the individual samples were combined to make technical replicates, which were extracted as described above. During instrumental analysis, a control sample was inserted into every 10 test samples to monitor the reproducibility of the analysis. Extracts of this pooled serum sample were injected to assess process variability. As an additional QC, water aliquots were extracted as part of the sample set to serve as process blanks for artifact identification. By overlapping display analysis of the total ion chromatogram (TIC) of different QC samples for mass spectrometric detection and analysis, the repeatability of the extraction and detection of metabolites can be judged, that is, technical repeatability. The high stability of the instrument provides an important guarantee for the repeatability and reliability of the data.
Statistical data analysis
Unsupervised PCA was performed by statistical function prcomp within R. The hierarchical cluster analysis (HCA) results of samples and metabolites were presented as heatmaps with dendrograms, while Pearson-correlation coefficients between samples were presented as only heatmaps. Both HCA and PCC were carried out by R package heatmap. Significantly regulated metabolites between groups were determined by VIP ≥ 1, p-value <0.05 and absolute Log2FC ≥1. VIP values were extracted from OPLS-DA result, which also contain score plots and permutation plots, generated using R package ropls. For each metabolite, Mann−Whitney U-test was carried out to calculate p-value for its significance. The identified metabolites were annotated using the KEGG database, and the annotated metabolites were then mapped to KEGG pathway database. Pathways with significantly regulated metabolites were then fed into metabolite sets enrichment analysis (MSEA), the significance of which was determined by the p-values of the hypergeometric test.
Principal component analysis principle
Using multivariate statistical analysis, we can simplify and reduce the dimensionality of complex and complex data and establish a reliable mathematical model to summarize and summarize the characteristics of metabolites of the studied objects on the basis of preserving the original information to the maximum extent. Among them, PCA is an unsupervised multidimensional statistical analysis method for pattern recognition. By orthogonal transformation, a set of variables that may have correlations are transformed into a set of linearly uncorrelated variables. The converted group of variables were called the main component. This method of analysis is often used to study how to reveal the internal structure of multiple variables through a few principal components, that is, to derive a few principal components from the original variables so that they retain the information of the original variables interrelated as much as possible, usually mathematical treatment is the linear combination of multiple indicators as a new composite indicator.
PCA data processing principles: the original data is compressed into n principal components to describe the characteristics of original data set, PC1 can describe as the most obvious features via multidimensional data matrix, PC2 in addition to PC1 can describe the data matrix notable features, PC3 … PCn and so on. The main parameter R2X obtained by PCA analysis shows the interpretation rate of the original data after the dimensionality reduction, and can be used to judge the quality of the model.
Through the principal component analysis of samples (including quality control samples), in order to initially understand the overall metabolic differences between samples of the group and the size of the variation between samples within the group. The results of PCA showed that there was a trend of separation of metabolomes among the groups, indicating whether the metabolomes of the sample groups are different. The MIX is the quality control sample mentioned above.
Conflict of interest
The authors declare that they have no conflict of interest.
Acknowledgments
This work was supported by Beijing Municipal Science & Technology Commission No. Z171100001017145 and Beijing Natural Science Foundation (No.7172213); The China Postdoctoral Science Foundation (No.2017M613421); Project of Army. Special Care (No.12BJZ04)
Additional information
Funding
Related Research Data
References
- Brosens LA, Offerhaus GJ, Giardiello FM. Hereditary colorectal cancer: genetics and screening. 2015. Surg Clin North Am. 95:1067–1080. DOI:10.1016/j.suc.2015.05.004.
- Bray F, Ferlay J, Soerjomataram I, Siegel RL, Torre LA, Jemal A. 2018. Global cancer statistics 2018: GLOBOCAN estimates of incidence and mortality worldwide for 36 cancers in 185 countries. CA Cancer J Clin. DOI:10.3322/caac.21492
- Lynch JP, Hoops TC. The genetic pathogenesis of colorectal cancer. Hematol Oncol Clin N Am. 2002;16(4):775–810. DOI:10.1016/S0889-8588(02)00029-1.
- Kondo Y, Issa JP. 2004. Epigenetic changes in colorectal cancer. Cancer Metastasis Rev. 23(1–2):29–39.
- Kinzler KW, Vogelstein B. 1996. Lessons from hereditary colorectal cancer. Cell. 87(2):159–170.
- Powell SM, Zilz N, Beazer-Barclay Y, Bryan TM, Hamilton SR, Thibodeau SN, Vogelstein B, Kinzler KW. APC mutations occur early during colorectal tumorigenesis. Nature. 1992;359(6392):235–237. DOI:10.1038/359235a0.
- Fernández-Bañares FEM, Navarro E, Cabré E, Boix J, Abad-Lacruz A, Klaassen J, Planas R, Humbert P, Pastor C. 1996. Changes of the mucosal n-3 and n-6 fatty acid status occur early in the colorectal adenoma-carcinoma sequence. Gut. 38(2):254–259.
- Abir F, Alva S, Kaminski DL, Longo WE. The role of arachidonic acid regulatory enzymes in colorectal disease. Dis Colon Rectum. 2005;48(7):1471–1483. DOI:10.1007/s10350-005-0015-y.
- Larsson SC, Kumlin M, Ingelman-Sundberg M, Wolk A. Dietary long-chain n-3 fatty acids for the prevention of cancer: a review of potential mechanisms. Am J Clin Nutr. 2004;79(6):935–945. DOI:10.1093/ajcn/79.6.935.
- Yoshie T, Nishiumi S, Izumi Y, Sakai A, Inoue J, Azuma T, Yoshida M. Regulation of the metabolite profile by an APC gene mutation in colorectal cancer. Cancer Sci. 2012;103(6):1010–1021. DOI:10.1111/j.1349-7006.2012.02262.x.
- Claudino WM, Quattrone A, Biganzoli L, Pestrin M, Bertini I, Di Leo A. Metabolomics: available results, current research projects in breast cancer, and future applications. J Clin Oncol. 2007;25(19):2840–2846. DOI:10.1200/JCO.2006.09.7550.
- Nicholson JK, Lindon JC, Holmes E. ‘Metabonomics’: understanding the metabolic responses of living systems to pathophysiological stimuli via multivariate statistical analysis of biological NMR spectroscopic data. Xenobiotica. 1999;29(11):1181–1189. DOI:10.1080/004982599238047.
- Denkert C, Budczies J, Weichert W, Wohlgemuth G, Scholz M, Kind T, Niesporek S, Noske A, Buckendahl A, Dietel M. Metabolite profiling of human colon carcinoma–deregulation of TCA cycle and amino acid turnover. 2008. Mol Cancer. 7:72. DOI:10.1186/1476-4598-7-72.
- Chan EC, Koh PK, Mal M, Cheah PY, Eu KW, Backshall A, Cavill R, Nicholson JK, Keun HC. Metabolic profiling of human colorectal cancer using High-Resolution Magic Angle Spinning Nuclear Magnetic Resonance (HR-MAS NMR) Spectroscopy and Gas Chromatography Mass Spectrometry (GC/MS). J Proteome Res. 2009;8(1):352–361. DOI:10.1021/pr8006232.
- Leichtle AB, Nuoffer JM, Ceglarek U, Kase J, Conrad T, Witzigmann H, Thiery J, Fiedler GM. Serum amino acid profiles and their alterations in colorectal cancer. Metabolomics. 2012;8(4):643–653. DOI:10.1007/s11306-011-0357-5.
- Zhu J, Djukovic D, Deng L, Gu H, Himmati F, Chiorean EG, Raftery D. Colorectal cancer detection using targeted serum metabolic profiling. 2014. J Proteome Res. 13:4120–4130. DOI:10.1021/pr500494u.
- Bertini I, Cacciatore S, Jensen BV, Schou JV, Johansen JS, Kruhoffer M, Luchinat C, Nielsen DL, Turano P. Metabolomic NMR fingerprinting to identify and predict survival of patients with metastatic colorectal cancer. Cancer Res. 2012;72(1):356–364. DOI:10.1158/0008-5472.CAN-11-1543.
- Jones R, Adel-Alvarez LA, Alvarez OR, Broaddus R, Das S. 2003. Arachidonic acid and colorectal carcinogenesis. Mol Cell Biochem. 253(1–2):141–149.
- Habbel P, Weylandt KH, Lichopoj K, Nowak J, Purschke M, Wang JD, He CW, Baumgart DC, Kang JX. 2009. Docosahexaenoic acid suppresses arachidonic acid-induced proliferation of LS-174T human colon carcinoma cells. World J Gastroenterol. 15(9):1079–1084.
- Almendingen K, Hostmark AT, Fausa O, Mosdol A, Aabakken L, Vatn MH. Familial adenomatous polyposis patients have high levels of arachidonic acid and docosahexaenoic acid and low levels of linoleic acid and alpha-linolenic acid in serum phospholipids. 2007. Int J Cancer. 120:632–637. DOI:10.1002/ijc.22337.
- Ghadimi R, Kuriki K, Tsuge S, Takeda E, Imaeda N, Suzuki S, Sawai A, Takekuma K, Hosono A, Tokudome Y, et al. 2008. Serum concentrations of fatty acids and colorectal adenoma risk: a case-control study in Japan. Asian Pac J Cancer Prev. 9(1):111–118.
- Kojima M, Wakai K, Tokudome S, Suzuki K, Tamakoshi K, Watanabe Y, Kawado M, Hashimoto S, Hayakawa N, Ozasa K. Serum levels of polyunsaturated fatty acids and risk of colorectal cancer: a prospective study. Am J Epidemiol. 2005;161(5):462–471. DOI:10.1093/aje/kwi066.
- Kuriki K, Wakai K, Hirose K, Matsuo K, Ito H, Suzuki T, Saito T, Kanemitsu Y, Hirai T, Kato T, et al. 2006. Risk of colorectal cancer is linked to erythrocyte compositions of fatty acids as biomarkers for dietary intakes of fish, fat, and fatty acids. Cancer Epidemiol Biomarkers Prev. 15(10):1791–1798. DOI:10.1158/1055-9965.EPI-06-0180.
- West NJ, Clark SK, Phillips RK, Hutchinson JM, Leicester RJ, Belluzzi A, Hull MA. Eicosapentaenoic acid reduces rectal polyp number and size in familial adenomatous polyposis. Gut. 2010;59(7):918–925. DOI:10.1136/gut.2009.200642.
- Siezen CL, van Leeuwen AI, Kram NR, Luken ME, van Kranen HJ, Kampman E. Colorectal adenoma risk is modified by the interplay between polymorphisms in arachidonic acid pathway genes and fish consumption. 2005. Carcinogenesis. 26:449–457. DOI:10.1093/carcin/bgh336.
- Choi YJ, Kim YH, Cho CH, Kim SH, Lee JE. Circulating levels of vitamin D and colorectal adenoma: a case-control study and a meta-analysis. World J Gastroenterol. 2015;21(29):8868–8877. DOI:10.3748/wjg.v21.i29.8868.
- Platz EA, Hankinson SE, Hollis BW, Colditz GA, Hunter DJ, Speizer FE, Giovannucci E. 2000. Plasma 1,25-dihydroxy- and 25-hydroxyvitamin D and adenomatous polyps of the distal colorectum. Cancer Epidemiol Biomarkers Prev. 9(10):1059–1065.
- Sadava D, Remer T, Petersen K. 1996. Hyperplasia, hyperproliferation and decreased migration rate of colonic epithelial cells in mice fed a diet deficient in vitamin D. Biol Cell. 87(1–2):113–115.
- Holt PR, Arber N, Halmos B, Forde K, Kissileff H, McGlynn KA, Moss SF, Kurihara N, Fan K, Yang K, et al. 2002. Colonic epithelial cell proliferation decreases with increasing levels of serum 25-hydroxy vitamin D. Cancer Epidemiol Biomarkers Prev. 11(1):113–119.
- Deeb KK, Trump DL, Johnson CS. 2007. Vitamin D signalling pathways in cancer: potential for anticancer therapeutics. Nat Rev Cancer. 7(9):684–700. DOI:10.1038/nrc2196.
- Díaz GD, Paraskeva C, Thomas MG, Binderup L, Hague A. 2000. Apoptosis is induced by the active metabolite of vitamin D3 and its analogue EB1089 in colorectal adenoma and carcinoma cells: possible implications for prevention and therapy. Cancer Res. 60(8):2304–2312.
- Fernandez-Garcia NI, Palmer HG, Garcia M, Gonzalez-Martin A, Del Rio M, Barettino D, Volpert O, Muñoz A, Jimenez B. 2005. 1alpha,25-Dihydroxyvitamin D3 regulates the expression of Id1 and Id2 genes and the angiogenic phenotype of human colon carcinoma cells. Oncogene. 24(43):6533–6544. DOI:10.1038/sj.onc.1208801.
- Pálmer HG, González-Sancho JM, Espada J, Berciano MT, Puig I, Baulida J, Quintanilla M, Cano A, de Herreros AG. 2001. Vitamin D(3) promotes the differentiation of colon carcinoma cells by the induction of E-cadherin and the inhibition of beta-catenin signaling. J Cell Biol. 154(2):369–387.
- Zheng W, Wong KE, Zhang Z, Dougherty U, Mustafi R, Kong J, Deb DK, Zheng H, Bissonnette M, Li YC. 2012. Inactivation of the vitamin D receptor in APC(min/+) mice reveals a critical role for the vitamin D receptor in intestinal tumor growth. Int J Cancer. 130(1):10–19. DOI:10.1002/ijc.25992.
- Nagengast FM, Grubben MJ, van Munster IP. 1995. Role of bile acids in colorectal carcinogenesis. Eur J Cancer. 31A(7–8):1067–1070.
- Bayerdörffer E, Mannes GA, Richter WO, Ochsenkühn T, Wiebecke B, Köpcke W, Paumgartner G. 1993. Increased serum deoxycholic acid levels in men with colorectal adenomas. Gastroenterology. 104(1):145–151.
- Modica S, Murzilli S, Salvatore L, Schmidt DR, Moschetta A. 2008. Nuclear bile acid receptor FXR protects against intestinal tumorigenesis. Cancer Res. 68(23):9589–9594. DOI:10.1158/0008-5472.CAN-08-1791.
- Makishima M, Okamoto AY, Repa JJ, Tu H, Learned RM, Luk A, Hull MV, Lustig KD, Mangelsdorf DJ, Shan B. 1999. Identification of a nuclear receptor for bile acids. Science. 284(5418):1362–1365.
- Pearson JR, Gill CI, Rowland IR. 2009. Diet, fecal water, and colon cancer–development of a biomarker. Nutr Rev. 67(9):509–526. DOI:10.1111/j.1753-4887.2009.00224.x.
- Qiu Y, Cai G, Su M, Chen T, Liu Y, Xu Y, Ni Y, Zhao A, Cai S, Xu LX. Urinary metabonomic study on colorectal cancer. J Proteome Res. 2009;9(3):1627–1634. DOI:10.1021/pr901081y.
- Deberardinis RJ, Sayed N, Ditsworth D, Thompson CB. 2008. Brick by brick: metabolism and tumor cell growth. Curr Opin Genet Dev. 18(1):54–61. DOI:10.1016/j.gde.2008.02.003.
- DeBerardinis RJ, Cheng T. 2010. Q’s next: the diverse functions of glutamine in metabolism, cell biology and cancer. Oncogene. 29(3):313–324. DOI:10.1038/onc.2009.358.
- Sakai T, Yamamoto K, Yokota H, Hakozaki-Usui K, Hino F, Kato I. 1990. Rapid, simple enzymatic assay of free L-fucose in serum and urine, and its use as a marker for cancer, cirrhosis, and gastric ulcers. Clin Chem. 36(3):474–476.
- Patel PS, Adhvaryu SG, Balar DB, Parikh BJ, Shah PM. 1994. Clinical application of serum levels of sialic acid, fucose and seromucoid fraction as tumour markers in human leukemias. Anticancer Res. 14(2B):747–751.
- Patel PS, Baxi BR, Adhvaryu SG, Balar DB. 1990. Evaluation of serum sialic acid, heat stable alkaline phosphatase and fucose as markers of breast carcinoma. Anticancer Res. 10(4):1071–1074.
- Thompson S, Dargan E, Turner GA. 1992. Increased fucosylation and other carbohydrate changes in haptoglobin in ovarian cancer. Cancer Lett. 66(1):43–48.
- Ripka J, Adamany A, Stanley P. 1986. Two Chinese hamster ovary glycosylation mutants affected in the conversion of GDP-mannose to GDP-fucose. Arch Biochem Biophys. 249(2):533–545.
- Wang Y, Huang D, Chen KY, Cui M, Wang W, Huang X, Awadellah A, Li Q, Friedman A, Xin WW, et al. 2017. Fucosylation deficiency in mice leads to colitis and adenocarcinoma. Gastroenterology. 152(1):193–205. DOI:10.1053/j.gastro.2016.09.004.
- Pelicano H, Martin D, Xu RH, Huang P. Glycolysis inhibition for anticancer treatment. Oncogene. 2006;25(34):4633–4646. DOI:10.1038/sj.onc.1209597.
- Pan JG, Mak TW. 2007. Metabolic targeting as an anticancer strategy: dawn of a new era?. Sci STKE. 2007(381):pe14.