
ABSTRACT
Cancer-associated fibroblasts (CAFs) are strongly implicated in tumor progression, including in the processes of tumorigenesis, invasion, and metastasis. The targeting of CAFs using various therapeutic approaches is a novel treatment strategy; however, the efficacy of such therapies remains limited. Recently, near-infrared photoimmunotherapy (NIR-PIT), which is a novel targeted therapy employing a cell-specific mAb conjugated to a photosensitizer, has been introduced as a new type of phototherapy. In this study, we have developed a novel NIR-PIT technique to target CAFs, by focusing on fibroblast activation protein (FAP), and we evaluate the treatment efficacy in vitro and in vivo. Esophageal carcinoma cells exhibited enhanced activation of fibroblasts, with FAP over-expressed in the cytoplasm and on the cell surface. FAP-IR700-mediated PIT showed induced rapid cell death specifically for those cells in vitro and in vivo, without adverse effects. This novel therapy for CAFs, designed as local control phototherapy, was safe and showed a promising inhibitory effect on FAP+ CAFs. PIT targeting CAFs via the specific marker FAP may be a therapeutic option for CAFs in the tumor microenvironment in the future.
Introduction
Dynamic alteration of cell populations in the tumor microenvironment contributes to the process of malignant progression. Activated fibroblasts, also known as cancer-associated fibroblasts (CAFs), have been identified at the invasive front and the intratumoral stroma of several solid tumors.Citation1–Citation3 CAFs constitute a significant proportion of the tumor microenvironment and have been found to be key partners of tumor cells, being strongly implicated in their malignant progression.Citation4 Esophageal carcinoma is one of the most malignant tumors in the digestive system, and many studies have illuminated the importance of CAFs in esophageal carcinoma with regard to therapeutic resistance, carcinogenesis, cancer proliferation, angiogenesis, metastasis, and dismal prognosis.Citation5–Citation8 Although the presence of CAFs correlates strongly with poor patient prognosis, the mechanisms by which they contribute to tumor progression remain poorly understood.Citation9,Citation10
Crosstalk mechanisms between CAFs and tumor cells have been reported in many studies, and the therapeutic potential has been investigated by inhibiting inter- or intra-cellular signaling.Citation11–Citation14 However, therapeutic efficacy sufficient to regulate tumor progression has not yet been achieved. Therefore, several investigations are focusing on developing valid systems to specifically target CAFs using the cells themselves. Smooth muscle actin (SMA) is a candidate marker to target CAFs, and SMA+ myofibroblasts have been documented in a variety of solid tumors.Citation13,Citation15 However, a recent study revealed that the specific ablation of SMA+ myofibroblasts resulted in the suppression of antitumor immunity, enhanced hypoxia, and epithelial–mesenchymal transition, and reduced survival.Citation16 Fibroblast activation protein (FAP), a more specific marker of CAFs,Citation17 is recognized as the next molecule to be targeted in such approaches; several reports have already demonstrated the efficacy of systemically depleting or targeting FAP+ cells in reducing tumor and stroma growth.Citation18–Citation20 However, serious side effects have been observed in these approaches, such as cachexia and anemia. Thus, efforts to develop effective cell-targeting therapy for the tumor microenvironment continue.
A novel phototherapy technique, near-infrared photoimmunotherapy (NIR-PIT), was recently introduced by Mitsunaga et al.Citation21 This novel cell-targeting therapy employs a specific mAb conjugated to a photosensitizer, IRDye700DX (mAb-IR700). NIR-PIT induces dramatic cytotoxicity in cells expressing particular antigensCitation21 and acts only when mAb-IR700 bound to cell membranes is irradiated with NIR light. NIR-PIT has been validated with reliable efficacy against epidermal growth factor receptor (EGFR)-positive malignant cells in various settings in vitro and in vivo.Citation22–Citation25 The technology is currently being investigated in clinical applications. Thus, we hypothesized that the NIR-PIT technology could be applied to CAFs by targeting the specific marker FAP as in malignant cells.
In this study, we aimed to evaluate whether FAP+ CAFs contribute to tumor progression in esophageal carcinoma and to develop NIR-PIT for CAFs targeting FAP as a specific marker. We demonstrate the reliable cellular regulation of FAP+ CAFs, consistent with that of other malignant cells, by NIR-PIT in vitro and in vivo. This technique represents a novel targeted therapy for the tumor microenvironment.
Materials and methods
Ethics statement
This study was carried out in accordance with the ethical standards of the Helsinki Declaration II and the ethical guidelines for Medical and Health Research Involving Human Subjects.Citation26 All cases were de-identified and detail has been removed from these case descriptions to ensure anonymity. The outline of our study was published on our web page to explain this study, and also providing opportunities for disagreement. As a retrospective analysis, we requested and were granted a waiver of individual informed consent from the ethics committee. The use of clinical samples was approved and reviewed by the Ethics Review Board of Okayama University, Okayama, Japan (No. 1603–023). Mouse experiments were performed in a specific pathogen-free environment at the Okayama University animal facility according to institutional guidelines, and all of the animal experimental protocols were approved and reviewed by the Ethics Review Committee for Animal Experimentation of Okayama University, Okayama, Japan. All experiments were performed in accordance with all guidelines and regulations indicated by these committees.
Patients and tissue samples
Primary esophageal squamous-cell carcinoma tissues were obtained from 24 consecutive patients who underwent esophagectomy without preoperative treatment at Okayama University Hospital from January 2000 to December 2010.
Cell lines
Human esophageal squamous-cell carcinoma (TE4 and TE8), FEF3 (fetal esophageal fibroblast 3), and GFP-FEF3 cell lines were used in this study. The primary human esophageal fibroblasts designated FEF3 were isolated from a human fetal esophagus as described previously.Citation13,Citation27–Citation30 FEF3 cells were stably transduced using the ViraPower Lentiviral Expression System (Invitrogen, Carlsbad, CA) containing the gene for green fluorescent protein (GFP). The GFP lentivirus was raised in our laboratory, and FEF3 cells were transduced in the presence of 6 μg/mL polybrene. Forty-eight hours after transduction, cells were selected in the presence of 10 μg/mL blasticidin for 14 d. All media were supplemented with 10% fetal bovine serum, 100 U/mL penicillin and 100 mg/mL streptomycin. The cells were routinely maintained at 37°C in a humidified atmosphere with 5% CO2. All cell lines were authenticated by the JCRB Cell Bank (National Institute of Biomedical Innovation, Osaka, Japan) using the DNA short tandem repeat analysis (STR).
Antibodies and reagents
The following antibodies were used in this study: monoclonal anti-αSMA and polyclonal anti-fibroblast specific protein 1 (FSP1, known as S100A4; Sigma-Aldrich, St. Louis, MO, USA) for IF; polyclonal anti-αSMA (Abcam, Cambridge, UK), monoclonal anti-FAP (Abnova, Taipei, Taiwan), and anti-β-actin (Sigma-Aldrich) for western blotting; polyclonal anti-FAP (Novus, Littleton, CO) for IHC; and monoclonal anti-FAP (R&D Systems, Minneapolis, MN) for flow cytometry, cellular IHC, and IR700-conjugated procedures. TGFβ1 was purchased from Sigma-Aldrich.
Immunofluorescence and immunohistochemical analysis
For IF analysis, the 24 specimens of esophageal carcinoma were double-immunostained with anti-αSMA and anti-FSP1 antibodies to enable the enumeration of CAFs. The slides were first deparaffinized and washed, and protein blocking was then performed at room temperature for 10 min. The primary antibody (anti-αSMA) was incubated for 30 min, and the slides were then washed three times in phosphate-buffered saline (PBS) for 5 min. The slides were incubated with the secondary antibody Alexa568 for 1 h before being washed three times in PBS for 5 min in the dark. The slides were heated with a pressure cooker for 14 min to retrieve the antigen and then cooled at room temperature for at least 20 min before being washed again in PBS. Subsequently, the anti-S100A4 antibody was incubated for 30 min, and the slides were washed three times for 5 min in PBS. The secondary antibody (Alexa488) was then incubated for 1 h, before washing slides three times in PBS. Coverslips were mounted with a drop of mounting medium (Vector Laboratories, H-1200) and sealed with nail polish to prevent drying and movement under the microscope. We divided the specimens into three groups according to tumor invasive depth, each containing eight specimens: mucosa [M], submucosa [SM], and muscularis propria [MP]. Each sample was analyzed using a single section, representing the most invaded area for that specimen. The average was obtained from three zones in that section to calculate the average number of CAFs, using each respective marker (orange or yellow). Each averaged zone included half tumor and half stroma, and the measurements were repeated three times independently.
For IHC, the sections were deparaffinized with xylene, hydrated using a diluted alcohol series, and immersed in H2O2 in methanol to quench endogenous peroxidase activity. The sections were treated with citrate buffer solution. To reduce non-specific staining, each section was blocked with Dako Protein-Free Serum-blocking for 15 min. The sections were then incubated with anti-FAP antibody (1:200, Novus) in Antibody Diluent, Dako REAL (Dako) for 60 min at room temperature, followed by three washes with buffer. The sections were then incubated with an anti-rabbit antibody (EnVision+ System/HRP, Rabbit (DAB+); Dako) for 30 min at room temperature. The chromogen used was DAB plus liquid (Dako). The sections were counterstained with Meyer’s hematoxylin. Primary tumors were assessed by the staining intensity of FAP under microscopy and were graded visually, as follows: none, 0; weak, 1; intermediate, 2; strong, 3 according to previous reports.Citation31–Citation33 The average score of FAP intensity in each specimen was then calculated.
Activation of fibroblasts
To prepare CM, TE cells (TE4 and TE8) were cultured with Dulbecco’s Modified Eagle Medium (DMEM) containing 10% fetal bovine serum (FBS) for 48 h. Supernatants were removed, filtered, and stored at −30°C. FEF3 and GFP-FEF3 cells were cultured for 2, 4, and 6 d with CM or DMEM containing 10% FBS with TGFβ (10 ng/mL) or co-cultured with TE cells for 2, 4, and 6 d using a two-chamber system. FEF3 cells activated by TGFβ are indicated as CAFTGFβ; by CM, CAFTECM; and by co-culturing, CAFTEco.
In vivo tumor growth studies
Athymic female nude mice were purchased from Clea (Tokyo, Japan). The mice were anesthetized, and 300 µL of a single-cell suspension containing only TE cells (TE4 and TE8) (3 x 10⁶ cells) or TE cells (3 x 10⁶ cells) with or without activated (96 h stimulation) FEF3 fibroblasts (1.5 x 10⁶ cells) was suspended in Matrigel (BD Biosciences) and injected subcutaneously into the backs of the animals (n = 3 or 4/group). After implantation, tumor growth was monitored every 3 or 4 d, from d 7 to d 28. The animal experimental protocol was approved and reviewed by the Ethics Review Committee for Animal Experimentation of Okayama University, Okayama, Japan.
Western blotting
The FEF3, CAFTGFβ, CAFTECM, and CAFTEco cells (treated for 2, 4, and 6 d) were examined for αSMA and FAP expression by western blotting, as described previously.Citation24 The FAP band was observed at 97 kDa. Quantification of αSMA and FAP protein expression was accomplished using ImageJ software.
Flow cytometry
The FEF3, CAFTGFβ, CAFTECM, and CAFTEco cells (treated for 2, 4, and 6 d) were examined for FAP expression. The cells were labeled with the primary mouse anti-FAP antibody and then the fluorescein-isothiocyanate-conjugated anti-mouse secondary antibody for 1 h at 4°C in the dark. The cells were washed and analyzed by fluorescence-activated cell sorting (FACS; BD Biosciences, Tokyo, Japan).
Immunofluorescence microscopy
The FEF3 cells were seeded onto four-chamber glass slides and cultured in DMEM containing 10% FBS or CM derived from TE cells for 96 h. The cells were fixed with 4% paraformaldehyde in PBS for 15 min and blocked with 3% bovine serum albumin for 30 min. The slides were stained with anti-FAP monoclonal antibody (R&D Systems) and subsequently imaged using a Confocal Laser Scanning Biological Microscope with a 488-nm excitation filter (FV10i, Olympus, Tokyo, Japan).
Synthesis of IR700-conjugated FAP antibody
IRDye700DX (LI-COR Biosciences, Lincoln, NE) was conjugated to FAP monoclonal antibody using the IRDye 700DX Protein Labeling Kit, following the manufacturer’s instructions. For the protein labeling reaction, FAP antibody (1 mg) was mixed with IRDye700 (52.15 μg) for 2 h at 20°C in the dark. Conjugated FAP-IR700 was purified using a ZebaTM Spin Desalting Column (Thermo Fisher Scientific, Waltham, MA). The free dye was removed, and the dye-to-protein ratio of the conjugate was determined. The protein concentrations and dye/protein ratio were calculated by measurement of light absorption at 280 nm and 689 nm with a UV-Vis spectrophotometer.
In vitro NIR-PIT
FEF3 was activated with TE4 CM (herein called CAFTE4CM) for 96 h. TE4 and CAFTE4CM4 cells were seeded onto 96-well black plates at 2.5 x 10³/well and 3 x 10³/well, respectively. The cells were conjugated with FAP-IR700 (20 μg/mL) for 6 h at 37°C. After conjugation, the cells were irradiated with NIR light at 20 J/cm2 (L700-05AU 700 nm, Epitex Co, Kyoto, Japan) or the indicated intensity as measured using an optical power meter (PM 100, Thorlabs, Inc., Newton, NJ). The condition of the cells was observed under an inverted microscope (IX71; Olympus) immediately prior to NIR-PIT, immediately after NIR-PIT, and 3 h and 24 h after NIR-PIT.
Cell growth assay
CAFTE4CM4 cells were seeded onto 96-well black plates at 4.0 x 10³/100 μL/well with TE4 CM. After 1 d, they were irradiated with NIR light at 10 J/cm2 or 20 J/cm2 (L700-05AU 700 nm, Epitex Co). The fibroblasts were subsequently counted on d 1, d 3, and d 5.
Cell viability assay
CAFTE4CM4 cells were seeded on 96-well black plates at 4.0 x 10³/100 μL/well with TE4 CM. Culture medium containing 2% FBS was used for the assay of FEF cells with NIR-PIT. After 1 d, cells were irradiated with NIR light at 0, 5, 10, 15, and 20 J/cm2. Cell viability was determined on d 3 after NIR-PIT using the Cell Proliferation Kit II (XTT; Roche Molecular Biochemicals, Mannheim, Germany), according to the manufacturer’s protocol.
In vivo NIR-PIT
Six-week-old female BALB/c-nu/nu mice were randomized into three groups: TE4 alone (3 x 10⁶ cells/body), TE4 (3 x 10⁶ cells/body) plus CAFTE4CM4 (1.5 x 10⁶ cells/body), or TE4 (3 106 cells/body) plus CAFTE4CM4-conjugated FAP-IR700 (1.5 x 10⁶ cells/body), which were pre-conjugated with FAP-IR700 before inoculation. The indicated cells were inoculated subcutaneously on the right flanks of the mice. All mice were irradiated with NIR light (30 J/cm2; L690-66–60 epoxy lens type infrared illuminator, Marubeni, Tokyo, Japan) on d 0 and d 3 following engraftment. Tumor volumes and body weights were measured twice a week until 21 d. The animal experimental protocol was approved and reviewed by the Ethics Review Committee for Animal Experimentation of Okayama University, Okayama, Japan.
Statistics
The data are presented as the mean±standard error of the mean (SEM). For two group comparisons, a two-sided Student’s t test was used. For multiple group comparisons, a one-way ANOVA with Tukey’s test was used. Differences between groups were considered significant when P< .05 (* P< .05; ** P< .005). All calculations were performed with JMP version 12 (SAS Institute Japan, Tokyo, Japan).
Results
CAF accumulation correlates with tumor progression in esophageal carcinoma
To explore the contribution of CAFs to tumor progression in esophageal carcinoma, we evaluated the relationship between the presence of CAFs and tumor invasiveness in clinical tumor samples. In total, 24 tumor samples were obtained from esophageal carcinoma patients who had undergone R0 resection in Okayama University Hospital. The 24 samples were divided into three groups of eight according to tumor invasive depth (T factor;Citation34 T1a: mucosa (M), T1b: submucosa (SM), and T2: muscularis propria (MP)). Activated fibroblasts are commonly identified as SMA+ cells; however, in tumor tissues, there are SMA+ smooth muscle cells in the muscularis mucosa layer and the lamina propria, as well as CAFs around the tumor. In fact, immunohistochemistry of an advanced case of resected esophageal squamous cell carcinoma (ESCC) demonstrated that large numbers of CAFs were located in the tumor stroma, indicating that cells overlapping expression of SMA and FSP-1, or FAP positive cells can be identified to CAFs in esophageal cancer tissues (). Firstly, to distinguish CAFs from these muscle cells, we performed dual-staining immunofluorescence (IF) using anti-SMA (red) and anti-FSP1 (green) antibodies.Citation35 With this technique, the “more specific” SMA+ CAFs are identified as orange or yellow cells, green cells represent normal fibroblasts, and red cells/structures represent smooth muscle, as shown in . To evaluate the correlation of tumor progression and the number of CAFs, we selected three zones for each sample at the tumor’s invasive front. A representative early-stage case is shown (), in which most of the stromal fibroblasts are shown to be green, indicating normal status. In contrast, a representative image from advanced carcinoma is shown in , in which more orange/yellow cells are identified, indicating the presence of CAFs. Using this dual-staining method, the average number of CAFs at each tumor invasive depth was calculated. The mean values were 5.25 (1.67–8.11) in M tumors, 13.04 (7.00–18.44) in SM tumors, and 23.67 (19.22–30.22) in MP tumors (). The number of CAFs per visual field significantly increased with greater invasive depth (M vs. SM, P= .0014; SM vs. MP, P< .0001, M vs. MP, P< .0001).
Figure 1. CAFs present in esophageal cancer tissue increase with tumor invasion depth. (a) Immunohistochemistry of an advanced case of resected esophageal squamous cell carcinoma (ESCC), in which large numbers of CAFs are located in the tumor stroma. SMA positive cells are (red arrowheads) observed both in the tumor stroma (CAFs) and at the layer of the lamina propria (red arrowheads). FAP-positive cells (orange arrowheads) are observed only in the tumor stroma (CAFs). FSP-1 positive cells (green arrowheads) are observed in the tumor stroma (CAFs) but also the stroma of the lamina propria, which is not tumor area. Scale bar, 200 μm (x100). (b–d) Microscopy shows HE and immunofluorescent (IF) double staining of αSMA and FSP1 labeled with Alexa568 (red) and Alexa488 (green), respectively. Green cells indicate normal fibroblasts, and yellow/orange cells indicate CAFs. Red cells indicate smooth muscle cells. Colored arrowheads highlight examples of these different cells in the tumor microenvironment. The nuclei were counterstained with DAPI (blue). Scale bar, 500 μm (HE), 50 μm (IF). (b) The complexity of the presence of different stromal cells is shown by IF. The dotted white line shows the tumor’s invasive front. (c) A representative early case (with submucosal [SM] invasive depth) shows several green cells (normal fibroblasts) and red cells/structures (smooth muscle layers and vessels). For CAF quantitation, three zones of the tumor invasive front for each sample were selected and the results averaged. (d) A representative advanced case (with muscularis propria [MP] invasive depth) shows several orange/yellow cells, indicating accumulation of CAFs. (e) The mean number of CAFs (±SEM) was calculated for each invasive depth (mucosa [M], n = 8; SM, n = 8; MP, n = 8); ** P< .005, one-way ANOVA with Tukey’s test. (f) IHC of FAP staining. Scale bar, 1 mm (40x), 200 μm (200x). A representative M tumor shows low FAP intensity in the tumor and its surrounding stroma. A representative SM tumor shows moderate FAP intensity in the stroma. A representative MP tumor shows strong FAP intensity in the stroma. (g) The mean score of FAP intensity (±SEM) was calculated for each invasive depth; ** P< .005, one-way ANOVA with Tukey’s test.
![Figure 1. CAFs present in esophageal cancer tissue increase with tumor invasion depth. (a) Immunohistochemistry of an advanced case of resected esophageal squamous cell carcinoma (ESCC), in which large numbers of CAFs are located in the tumor stroma. SMA positive cells are (red arrowheads) observed both in the tumor stroma (CAFs) and at the layer of the lamina propria (red arrowheads). FAP-positive cells (orange arrowheads) are observed only in the tumor stroma (CAFs). FSP-1 positive cells (green arrowheads) are observed in the tumor stroma (CAFs) but also the stroma of the lamina propria, which is not tumor area. Scale bar, 200 μm (x100). (b–d) Microscopy shows HE and immunofluorescent (IF) double staining of αSMA and FSP1 labeled with Alexa568 (red) and Alexa488 (green), respectively. Green cells indicate normal fibroblasts, and yellow/orange cells indicate CAFs. Red cells indicate smooth muscle cells. Colored arrowheads highlight examples of these different cells in the tumor microenvironment. The nuclei were counterstained with DAPI (blue). Scale bar, 500 μm (HE), 50 μm (IF). (b) The complexity of the presence of different stromal cells is shown by IF. The dotted white line shows the tumor’s invasive front. (c) A representative early case (with submucosal [SM] invasive depth) shows several green cells (normal fibroblasts) and red cells/structures (smooth muscle layers and vessels). For CAF quantitation, three zones of the tumor invasive front for each sample were selected and the results averaged. (d) A representative advanced case (with muscularis propria [MP] invasive depth) shows several orange/yellow cells, indicating accumulation of CAFs. (e) The mean number of CAFs (±SEM) was calculated for each invasive depth (mucosa [M], n = 8; SM, n = 8; MP, n = 8); ** P< .005, one-way ANOVA with Tukey’s test. (f) IHC of FAP staining. Scale bar, 1 mm (40x), 200 μm (200x). A representative M tumor shows low FAP intensity in the tumor and its surrounding stroma. A representative SM tumor shows moderate FAP intensity in the stroma. A representative MP tumor shows strong FAP intensity in the stroma. (g) The mean score of FAP intensity (±SEM) was calculated for each invasive depth; ** P< .005, one-way ANOVA with Tukey’s test.](/cms/asset/3055191e-1f74-475c-93e5-dc0b5a22aa46/kcbt_a_1617566_f0001_oc.jpg)
To evaluate the consistency between the presence of SMA+ and FAP+ cells, which can be the most specific CAF marker in the tumor microenvironment and could be a single targeting molecule for further investigation, we performed immunohistochemistry (IHC) analysis for FAP in all specimens () and graded the intensity of FAP expression. As expected, the intensity of FAP correlated with greater tumor invasive depth (M vs. SM, P= .1121; SM vs. MP, P= .0011, M vs. MP, P< .0001), showing the same trend as the SMA/FSP1 analysis. The mean grade of FAP by this approach was 0.375 in M tumors, 1 in SM tumors, and 2.25 in MP tumors (). Therefore, consistent with the findings of previous reports that used alternative approaches, the presence of CAFs appears to increase with tumor progression, suggesting that CAFs have a positive influence on tumor invasion.Citation36,Citation37
Activated fibroblasts accelerate tumor growth in esophageal carcinoma
To determine whether CAFs and the CAFs-rich tumor microenvironment, which was induced by adding CAFs, contributed to tumor growth, we used in vivo mouse xenograft models. We prepared three types of activated fibroblasts: those activated by transforming growth factor β (TGFβ) (CAFTGFβ), which is the most representative inducer of myofibroblast differentiation, and those activated by co-culture with either the TE4 (CAFTE4co) or TE8 (CAFTE8co) cancer cell lines for 48 h. We compared the in vivo tumor growth of cancer cells engrafted alone (TE) and that of those co-engrafted with activated fibroblasts (TE+CAFs). We observed that cancer cells co-cultured with CAFs showed significantly increased tumor size and more rapid tumor growth ().
Figure 2. Evaluation of the contribution of activated fibroblasts to tumor growth. TE cells alone or co-cultured with either CAFTGFβ (fibroblasts activated with TGFβ) or CAFTEco (fibroblasts co-cultured with TE cells) were inoculated subcutaneously into mice. The mean tumor volume (±SEM) was calculated for each group. (a and b) TE4+CAFs tumors (n = 4) showed significant progressive growth compared with TE4 tumors alone (CAFTGFβ P= .0002; and CAFTE4co P= .0101; two-tailed Student’s t-test at 28 d); scale bar in images, 10 mm. (c and d) The same experiments were performed using TE8 cells, with the pattern of engraftment following the same trend as for TE4 (CAFTGFβ vs. TE8 alone, P= .050, n = 3; CAFTE8co vs. TE8 alone, P= .078, n = 4; two-tailed Student’s t-test at 28 d); scale bar in photographs, 10 mm. (e) Representative images of fluorescence microscopy show the presence of GFP-positive fibroblasts in tumor-bearing mice. The large pictures show the whole mouse body, with the dotted lines indicating the tumor. The small panels show sections of the tumors in greater detail. Scale bars, 10 mm (macro), 5 mm (section). Green arrowheads indicate the presence of GFP-positive fibroblasts. (f) Fluorescence microscopy detects the presence of GFP-positive fibroblasts (green arrowheads) on 7 and 21 d after initial inoculation of mice, in sectioned tumors. Scale bars, 5 mm (section).
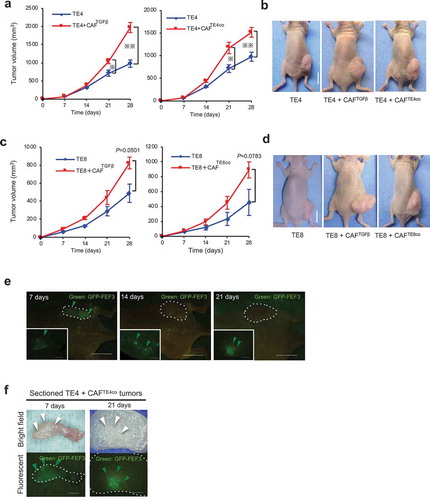
To verify the ongoing contribution of CAFs originated from FEF3 to tumor growth, we used GFP-labeled fibroblasts (GFP-FEF3) and evaluated the presence of activated GFP-FEF3 cells (CAFs) using fluorescence microscopy. It was observed that GFP-expressing cells continued to be present in tumors 21 d after initial inoculation (), in which GFP-positive fibroblasts can be detected in whole sectioned tumor of after 7 d, whereas GFP-positive fibroblasts can be detected in a localized area of sectioned tumor of after 21 d (). Thus, CAFs strongly contribute to tumor growth, and CAFs can influence tumor cells continuously with their long survival.
Over-expression of αSMA and FAP in activated fibroblasts
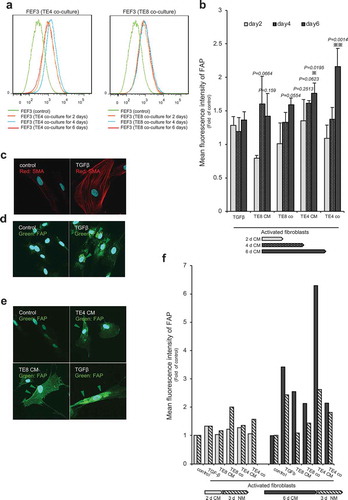
Next, we directed our attention to targeting CAFs for cancer treatment, hypothesizing that this targeting would lead to tumor suppression. With regard to cell-targeted therapy, αSMA is the most common marker of CAFs; however, it is also expressed in smooth muscle cells. We, therefore, considered using FAP as a more selective marker for CAFs. To examine the relative expression of αSMA and FAP, we evaluated the time course of their expression in fibroblasts activated either by TGFβ (10 mg/mL), conditioned medium (CM) from TE cell lines (CAFTECM), or by co-culture with TE cell lines (CAFTEco), using western blotting (). FAP was expressed at high levels at an early time point (d 2) when fibroblasts were co-cultured with the TE lines (CAFTEco) but relatively late and at lower levels when stimulated with CM (CAFTECM) or TGFβ (CAFTGFβ). In contrast, the early over-expression of αSMA was observed in CAFTEco, CAFTGFβ, and CAFTE4CM fibroblasts, but the expression level decreased slightly by d 4 and d 6. Notably, the CAFTEco cells were shown by both markers to be affected more strongly than CAFTECM cells, suggesting that dynamic intercellular signaling is important for fibroblasts, in addition to unidirectional signaling from cancer cells. Thus, although both markers were over-expressed by fibroblasts, their pattern of expression differed with respect to both time and experimental conditions (the densitometry data of the blots summarized in ). Taken together, these data indicate that FAP is a suitable candidate marker protein for therapy targeting the tumor microenvironment in esophageal carcinoma.
Figure 3. Pattern of αSMA and FAP expression in activated fibroblasts. (a) Western blot analysis showing the expression of αSMA and FAP over time in fibroblasts stimulated by different experimental conditions. (b and c) Quantification of western blot data (a) showing the αSMA and FAP expression relative to that of the control.
Over-expression of FAP on the surface of activated fibroblasts
To confirm the suitability of FAP as a target molecule, we examined its expression further using FACS analysis, in which a fluorescent-labeled antibody for FAP binds to cell surface antigen, and the intensity of the fluorescence is proportional to the amount of antigen. Similar to the western blot results, FACS analysis showed over-expression of FAP following fibroblast activation in a time-dependent manner (). A significant difference from the control was only observed in the CAFTE4co and CAFTE4CM cells; however, over-expression (range, 0.8- to 2.16-fold) was evident under most conditions except for CAFTGFβ and CAFTE8CM on d 2 (). Immunofluorescence (IF) analysis revealed that αSMA was over-expressed and associated with cytoplasmic structures in CAFTGFβ cells (). Similarly, FAP was associated with cytoplasmic structures in CAFTGFβ and CAFTECM cells and to a substantially greater level than in unstimulated fibroblasts (). Furthermore, regarding expression on the cell surface, IF experiments confirmed that the CAFTECM cells showed FAP accumulation on the cell surface in addition to the cytoplasm; in contrast, in CAFTGFβ cells, FAP was primarily expressed in the cytoplasm (). Although FAP overexpression was not observed on d 4 in whole cell lysates analysis by western blotting, FACS and IF confirmed the overexpression of FAP on the cell surface after stimulation for 4 d. To explore dynamic cross-talk between the cancer cells and fibroblasts, we examined the reversibility of FAP activation, in which activated fibroblasts were released back into normal medium (NM) for 3 d (). Interestingly, the intensity of FAP expression, which was up-regulated following 6 d of CM stimulation, decreased back towards normal levels once the cells were grown again in NM. This finding indicates that FAP expression is dynamic in fibroblasts, a feature that can contribute to target specificity of CAFs by FAP.
Figure 4. Activated fibroblasts express FAP on their cell surface, as determined by FACS and immunofluorescent staining. (a) Representative FACS data show significantly increased FAP expression in fibroblasts stimulated by co-culturing with TE cell lines. X-axis: intensity; Y-axis: total cell number. (b) FACS analysis shows the intensity of FAP expression over time. Each set of conditions (n = 3) was compared with untreated control. Significantly higher intensity of FAP than in the control was detected in CAFTE4co cells (P= .0014) and CAFTE4CM cells at d 6 (P= .0195). Higher intensity was detected in CAFTE4CM cells (mean, 1.35-fold, P= .2513) at d 2, CAFTE4CM (mean, 1.61-fold, P= .0623) and CAFTE8CM (mean, 1.60-fold, P= .0664) cells at d 4 and CAFTE8co (mean, 1.60-fold, P= .0554) and CAFTE8CM (mean, 1.42-fold, P= .159) cells at d 6. The arrows indicate the duration of culturing with each medium. The mean intensity (±SEM) was calculated for each group; * P< .05, ** P< .005; two-tailed Student’s t-test. (c–e) IF microscopy of fibroblasts stimulated with TGFβ or CM from TE cells for 96 h. Activated fibroblasts strongly expressed stress fibers of αSMA (red) and FAP (green) compared with the control (unstimulated) cells. Images are shown at 600× magnification. (f) FACS analysis showed reversible expression of FAP when cells were stimulated for 6 d with conditioned medium (CM) and grown for 3 d in normal medium (NM).
FAP-IR700-mediated NIR-PIT leads to the cell death of CAFs in vitro
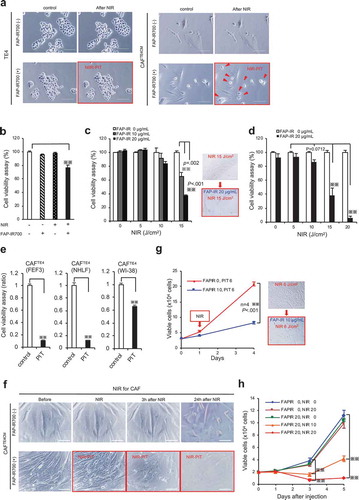
Having shown that FAP can be a promising cell-surface protein to target activated fibroblasts, we designed cell-targeting therapy with NIR-PIT. First, we developed the anti-FAP antibody-conjugated IR700Dye (FAP-IR700) and evaluated its efficacy and specificity in vitro, in which experiments, we used CAFTECM cells, on which cell surface FACS and IF analysis demonstrated overexpression or accumulation of FAP protein (), because the condition using cancer conditioned medium was more stable than that of co-cultured with cancer cells (CAFTECO). We found that NIR light (700 nm) applied to CAFs in the presence of FAP-IR700 resulted in immediate cellular shrinkage (), but there was no significant cytotoxicity in TE4 cells and only limited inhibitory effects in normal fibroblasts FEF3 cells (). To explore the dose-dependent effects of NIR-PIT, we performed cell viability assays. NIR-PIT had an inhibitory effect on targeted cells, which was related to the dose of irradiation (); the combination of FAP-IR700 (20 µg/mL) and NIR light (20 J/cm2) induced a 93.2% reduction in targeted cell viability (). A similar inhibitory effect of NIR-PIT was observed in other types of fibroblasts (Supplementary Figure 1S, ). Despite minimal apparent morphological changes to the targeted cells immediately after irradiation, it was observed that the cellular damage induced by NIR-PIT gradually led to whole-cell collapse, suggesting that NIR-PIT causes fatal damage with long-term effects (). This observation was confirmed with cell viability assays showing that long-term growth inhibition of CAFTE4CM was only achieved by the combination of FAP-IR700 and NIR light and in a dose-dependent manner (). NIR-PIT thus demonstrated specificity for CAFs targeted via FAP and a dose-dependent inhibitory effect.
Figure 5. Long-term growth inhibition of CAFs in response to FAP-IR700-mediated NIR-PIT in vitro. (a) Microscopic images of cells before and after FAP-IR700 (10 µg/mL)-mediated NIR light (18 J/cm2). There was no NIR-PIT effect on cancer cells, whereas CAFTE4CM cells showed rapid shrinkage (indicated by red arrow) in response to NIR-PIT; scale bar, 200 μm (TE4), 100 μm (CAFTE4CM). (b) Cell viability assay (72 h after NIR-PIT) shows a limited inhibitory effect on non-activated fibroblasts, with a 23.4% reduction using 20 µg FAP-IP700 and 20 J/cm2 NIR light compared with untreated controls (mean±SEM (n = 5); P< .005, one-way ANOVA with Tukey’s test) (c) The cell viability assay shows an inhibitory effect of NIR-PIT on CAFTE4CM in a dose- and irradiation-intensity-dependent manner, evaluated 72 h after irradiation. Results for each experiment were compared with FAP-IR700 0 µg/mL. Significant inhibitory effects were revealed for the combinations of 15 J/cm2 NIR with 10 µg/mL and 20 µg/mL FAP-IR700 (n = 3). Data indicate mean ± SEM; * P< .05, ** P< .005, two-tailed Student’s t-test. (d) The mean (±SEM) irradiation-dose-dependent effect of NIR-PIT on CAFTE4CM cell viability (n = 5). NIR-PIT (20 µg of FAP-IR700) resulted in a 58.9% and 93.2% reduction in viability at 15 and 20 J/cm2 NIR, respectively, compared with no irradiation; ** P< .005, one-way ANOVA with Tukey’s test. (e) FAP-targeted NIR-PIT in each cell line resulted in a significant inhibitory effect compared with the non-NIR-PIT control. Data indicate mean ± SEM; * P< .05, ** P< .005, one-way ANOVA with Tukey’s test. (f) Microscopic observations of the response of CAFTE4CM cells to FAP-IR700-mediated NIR-PIT over time; scale bar, 100 μm. (g) Cell growth assay shows inhibition of FAP-expressing CAFs by NIR-PIT (n = 4), similar to the results from the XTT assay. There was a 60.2% reduction after 3 d of NIR irradiation with 10 µg/mL FAP-IR700. The microscopy images show a decrease in cell density following NIR-PIT in both experiments. Data indicate mean ± SEM; * P< .05, ** P< .005, two-tailed Student’s t-test. Scale bar: 100 μm. (h) Cell growth assay of CAFTE4CM shows the long-term growth inhibition effect of NIR-PIT in vitro (mean±SEM), compared with that under control conditions (FAPIR 0, NIR 0); ** P< .005, one-way ANOVA with Tukey’s test (n = 4).
FAP-IR700-mediated NIR-PIT depletes FAP+ CAFs in vivo
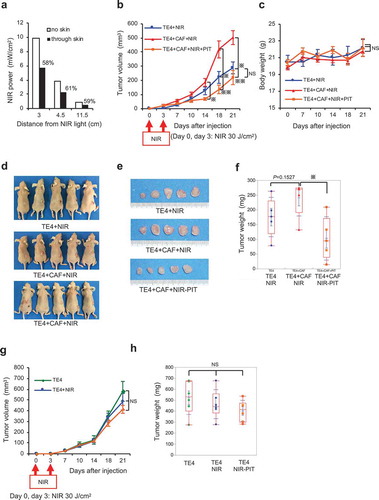
The previous experiments revealed that NIR-PIT targeting FAP could regulate CAF viability in a dose-dependent manner in vitro. Before evaluating the efficacy of NIR-PIT in vivo (Supplementary Figure 2), we first optimized the intensity of radiation required for this approach (). These experiments revealed that NIR light was decreased to 60% through skin compared with the effects of direct irradiation. Therefore, considering that the strongest effect was induced by 20 J/cm2 in vitro, we used 30 J/cm2 in vivo. As expected, the rate of growth of TE cells in vivo, which we previously found to be accelerated by co-culture with CAFs (see ), was significantly reduced by the application of NIR-PIT to a level equivalent to the growth rate of cancer cells alone (, d–f), without adverse effects on body weight (). However, an effect of FAP-targeted NIR-PIT was not observed for xenograft tumors derived only from TE4 cells (, h). These data, therefore, demonstrate that this safe and specific cellular therapy targeting FAP has a promising inhibitory effect on CAFs in vivo.
Figure 6. Targeting of CAFs with FAP-IR700-mediated NIR-PIT suppresses tumor growth in esophageal carcinoma in vivo. (a) Near-infrared (NIR) light power (mW/cm2) was measured using an optical power meter, with or without an interrupting layer of skin. NIR light through murine skin was found to be reduced by about 60%. (b) Tumors co-cultured with TE4 and CAFs (n = 5) showed significantly progressive growth compared with that of tumors in the TE4-alone group (n = 5; P= .0192 on d 21). NIR irradiation was performed on d 0 and d 3 for all groups, significantly inhibiting TE+CAF tumors (P= .0098 on d 14, P= .0025 on d 18, P= .0031 on d 21), with the rate of growth returning to the rate observed with TE4 alone; the data indicate the mean±SEM; * P< .05, ** P< .005, one-way ANOVA with Tukey’s test; NS, not significant. (c) The mean body weight (±SEM) of the animals in each treatment group (NS, not significant; one-way ANOVA with Tukey’s test). (d) Representative mice bearing tumors for each group. (e) Representative tumors for each group. (f) Co-cultured tumors treated with NIR-PIT showed significantly reduced tumor weights on d 21 (P= .0182), compared with TE4+ CAF tumors in the absence of NIR-PIT (the data indicate the mean±SEM; * P< .05, one-way ANOVA with Tukey’s test). (g and h) Tumors of TE4 (n = 6) treated by FAP-targeted NIR-PIT or NIR alone did not show significant growth inhibition compared with the control TE4 group (n = 6) on d 21. NIR irradiation was performed on d 0 and d 3 for the NIR groups (the data indicate the mean±SEM; NS, not significant; one-way ANOVA with Tukey’s test).
Discussion
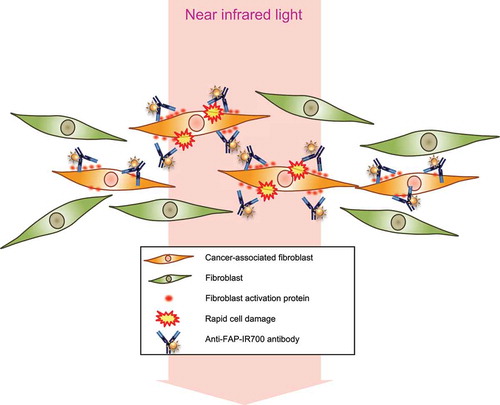
In this study, we demonstrated that CAFs contribute to tumor progression and that FAP expression in fibroblasts can be a specific target to eliminate CAFs in esophageal carcinoma. While other studies have investigated the inhibition of cell-cell crosstalk or indirect immunoreaction to target the tumor microenvironment, our model is the first study to apply NIR-PIT technology to directly target “non-malignant” cells, CAFs (). Successful NIR-PIT with anti-FAP-IR700 was observed to regulate CAFs selectively in vitro and in vivo. These results suggest that esophageal carcinoma cells activate normal fibroblasts to FAP+-activated fibroblasts to promote their progression and that destruction of FAP+ CAFs, even though they are “non-cancer” cells, can lead to tumor control.
Figure 7. Schematic illustrations of PIT for CAFs.
Schematic of PIT therapy for the tumor microenvironment targeting FAP+ CAFs. FAP+ CAFs are selectively damaged by PIT.
It is well recognized that the most common marker of CAFs is SMA and that SMA+ CAFs strongly promote and support malignant tumor phenotypes. However, SMA is also expressed in other cells of the human body, such as smooth muscle cells and activated fibroblasts in wound-healing areas. Furthermore, it has recently been reported that specific ablation of SMA+ myofibroblasts in pancreatic ductal adenocarcinoma (PDA) in mouse models suppresses antitumor immunity and promotes tumor hypoxia and epithelial–mesenchymal transition, resulting in reduced survival.Citation16 Therefore, targeting SMA+ cells could potentially involve a high risk for patients and might not be a suitable target for specific cellular therapy. The existence of phenotypically distinct subsets of CAFs has recently been revealed, adding to the known heterogeneity of the tumor microenvironment.Citation38,Citation39 Although FAP+ myofibroblasts represent one such CAF phenotype, FAP+ CAFs have been reported to contribute strongly to the progressive features of malignant cells,Citation40,Citation41 as demonstrated in this study. Thus, despite the heterogeneity of the CAFs, FAP+ fibroblasts can be a target to improve the survival of patients.
Previous investigators have reported novel therapies targeting FAP, which have introduced three main approaches. The first approach is to use a specific antibody, such as sibrotuzumab, which has been shown to be safe and to exhibit selective accumulation in tumors in Phase I and II trials;Citation42,Citation43 the labeling of such antibodies with therapeutic materials is under development. The second approach is to control enzymatic activity using Val-boroPro (talabostat); preclinical xenograft studies have revealed tumor growth inhibition in some malignant tumors.Citation36,Citation42,Citation44,Citation45 Several clinical studies have therefore been conducted but have not demonstrated any significant clinical benefits despite the promising preclinical evidence.Citation43–Citation45 Third, cellular-level control therapy for FAP+ cells has recently attracted attention,Citation41,Citation46–Citation48 with Lo et al. having developed a CAF-depletion system using FAP-targeted chimeric antigen receptor T cells.Citation18 The adoptive transfer of these T cells was demonstrated to reduce the extracellular matrix and tumor growth in xenograft models and restrain autochthonous pancreatic cancer growth. Such cellular-level control of FAP+ CAFs may provide three strong benefits: high selectivity in humans, a fundamental inhibition of enzymatic activity, and inhibition of CAF cell–cell interactions. However, there are considerable issues with this approach. Recent studies have reported that ablation of FAP+ stromal cells could induce bone marrow hypocellularity, followed by anemia and cachexia in mice.Citation19,Citation20 Based on those findings, systemically targeting FAP+ cells can be risky due to the difficulty of distinguishing cancer-related fibroblasts from non-cancer-related fibroblasts, because FAP+ fibroblasts originate from normal cells present throughout the body.
Our strategy using NIR-PIT to deplete FAP+ CAFs was theoretically designed as an ultimate local control therapy rather than a systemic therapy. NIR-PIT is induced by NIR light, and in principle, the effect should not extend beyond the point reached by the light. This cell-selective therapy was successfully performed in vivo without any adverse effects in the present study. In that sense, NIR-PIT targeting FAP+ CAFs is a novel approach that offers a safe strategy for the control of epithelial malignant neoplasms. Phototherapy within the visible range has already been actively performed in malignant neoplasms of the digestive system, using an endoscope or laparoscope.Citation49,Citation50 Our strategy, a local and cell-specific phototherapy, is minimally invasive, does not appear to have adverse effects, and can be similarly applied using such approaches.Citation51 Additionally, NIR-PIT was originally developed for directly targeting tumor cells, suggesting that this technology can be applied in combination with tumor-cell therapy using different specific mAbs, modifying the concept of therapy with trastuzumab and pertuzumab.Citation52 Furthermore, NIR-PIT for CAFs could be applied in combination with conventional therapy, based on data supporting the role of CAFs in promoting tumor resistance to chemotherapy and targeted agents.Citation53
Our preclinical studies have laid the groundwork for future clinical studies targeting the tumor microenvironment, especially for gastrointestinal carcinomas with their therapeutic accessibility. However, some questions remain, such as the approach to deliver the anti-FAP-IR700 conjugate to humans. Because a specific antibody against human FAP, sibrotuzumab, has already been evaluated in humans,Citation42,Citation43 it would be a suitable candidate to evaluate. Additionally, this study has some limitations. First, our in vivo model demonstrates a first step for clinical use, as it only shows whether NIR-PIT for FAP+ cells works selectively in a co-cultured condition in vivo. Thus, we must further explore the systemic administration of the conjugate to evaluate the efficacy of the FAP+-cell-targeted therapy for tumor regulation. For these experiments, grown tumors would be more suited when an initial treatment is performed and murine-derived fibroblasts and other host–tumor interactions must be considered.Citation54 More clinically relevant orthotopic tumor modelsCitation55-Citation57 or patient-derived orthotopic xenografts (PDX)Citation58 should be used as alternative mouse models in future studies. PDX would be more suitable to evaluate the efficacy of targeting FAP+ cells in the heterogenic CAF population in the tumor microenvironment. Citation38 Second, our tumor models in vivo were established using immune-deficient mice, and we did not evaluate host reactions, such as accompanying immunoreactions, even though there might be innate immune reactions in nude mice. All immunoreactions induced by PIT or caused by deleting CAFsCitation59 in immunocompetent mice should be evaluated in subsequent studies. We believe that the potential for the combination of NIR-PIT for CAFsCitation60-Citation62 and immunotherapy-based approaches may be worth evaluating in the future.Citation63
In conclusion, we have demonstrated a novel phototherapy strategy targeting FAP+ CAFs that was designed to provide local control and found that it may be a safe and highly effective approach for the treatment of epithelial cancers. NIR-PIT targeting CAFs with the specific marker FAP may thus be a new therapeutic option for both tumors and the tumor microenvironment in the near future.
Abbreviations
| AB | = | antibody |
| CAF | = | cancer-associated fibroblast |
| CM | = | conditioned medium |
| DAPI | = | 4,6-diamidino-2-phenylindole |
| DMEM | = | Dulbecco’s Modified Eagle Medium |
| FACS | = | fluorescence-activated cell sorting |
| FAP | = | fibroblast activation protein |
| FBS | = | fetal bovine serum |
| FEF3 | = | fetal esophageal fibroblasts |
| FSP1 | = | fibroblast-specific protein 1 |
| GFP | = | green fluorescent protein |
| IF | = | immunofluorescence |
| IHC | = | immunohistochemistry |
| NIR | = | near infrared |
| PBS | = | phosphate-buffered saline |
| PDA | = | pancreatic ductal adenocarcinoma |
| PDX | = | patient-derived orthotopic xenografts |
| PIT | = | photoimmunotherapy |
| RT | = | room temperature |
| SEM | = | standard error of the mean |
| SMA | = | smooth muscle actin |
| TGF | = | transforming growth factor |
| XTT | = | sodium 2,3,-bis(2-methoxy-4-nitro-5-sulfophenyl)-5-[(phenylamino)-carbonyl]-2H-tetrazolium. |
Author contributions
Conception and design: K.N., T.O., H.T., S.K., Y.S., and T.F. Development of methodology: S.W., K.N., S.K. and H.K. Acquisition of data (provided animals, acquired and managed patients, provided facilities, etc.): S.W., H.K., T.K., H.S., R.K., and S.U. Analysis and interpretation of data (e.g., statistical analysis, biostatistics, computational analysis): S.W. and K.N. Writing, review, and/or revision of the manuscript: S.W., K.N. and T.F. Administrative, technical, or material support (i.e., reporting or organizing data, constructing databases): S.W., K.N., H.K., H.S., H.T., Y.H., and T.F. Study supervision: K.N., H.T., Y.S., and T.F. All authors reviewed and approved the manuscript.
Competing interests
The authors declare that they have no competing interests.
Consent for publication
All authors have read and approved the manuscript. All contributing authors approved the submission of this version of the manuscript and assert that the document represents valid work. All contributing authors have no disclosures.
Data availability
The datasets generated during and/or analyzed during this study are included in this published article (and its Supplementary files), otherwise available from the corresponding author on reasonable request.
Supplemental Material
Download MS Word (2.1 MB)Acknowledgments
This work was supported by Grants-in-Aid from the Ministry of Education, Science, and Culture, Japan; and Grants from the Ministry of Health and Welfare, Japan. H. Kobayashi was supported by the Intramural Research Program of the National Institutes of Health, National Cancer Institute, Center for Cancer Research. We would also like to thank Mr. Toru Tanida and Ms. Tae Yamanishi for their technical assistance and Drs. Oka and Miyazaki of Saiwaicho Hospital (Okayama, Japan) for useful discussions. We also thank Meenhard Herlyn for generously providing the FEF3 and GFP-FEF3 cell lines used in this study.
Supplementary material
Supplemental data for this article can be accessed on the publisher’s website.
Related Research Data
References
- Pietras K, Ostman A. Hallmarks of cancer: interactions with the tumor stroma. Exp Cell Res. 2010;316:1324–1331. doi:10.1016/j.yexcr.2010.02.045.
- De Wever O, Demetter P, Mareel M, Bracke M. Stromal myofibroblasts are drivers of invasive cancer growth. Int J Cancer. 2008;123:2229–2238. doi:10.1002/ijc.23925.
- Kalluri R, Zeisberg M. Fibroblasts in cancer. Nat Rev Cancer. 2006;6:392–401. doi:10.1038/nrc1877.
- Murata T, Mekada E, Hoffman RM. Reconstitution of a metastatic-resistant tumor microenvironment with cancer-associated fibroblasts enables metastasis. Cell Cycle. 2017;16:533–535. doi:10.1080/15384101.2017.1281486.
- Loeffler M, Kruger JA, Niethammer AG, Reisfeld RA. Targeting tumor-associated fibroblasts improves cancer chemotherapy by increasing intratumoral drug uptake. J Clin Invest. 2006;116:1955–1962. doi:10.1172/JCI26532.
- Underwood TJ, Hayden AL, Derouet M, Garcia E, Noble F, White MJ, Thirdborough S, Mead A, Clemons N, Mellone M, et al. Cancer-associated fibroblasts predict poor outcome and promote periostin-dependent invasion in oesophageal adenocarcinoma. J Pathol. 2015;235:466–477. doi:10.1002/path.4467.
- Lin EW, Karakasheva TA, Hicks PD, Bass AJ, Rustgi AK. The tumor microenvironment in esophageal cancer. Oncogene. 2016;35:5337–5349. doi:10.1038/onc.2016.34.
- Huang L, Xu AM, Liu S, Liu W, Li TJ. Cancer-associated fibroblasts in digestive tumors. World J Gastroenterol. 2014;20:17804–17818. doi:10.3748/wjg.v20.i47.17804.
- Cardone A, Tolino A, Zarcone R, Borruto Caracciolo G, Tartaglia E. Prognostic value of desmoplastic reaction and lymphocytic infiltration in the management of breast cancer. Panminerva Med. 1997;39:174–177.
- Xing F, Saidou J, Watabe K. Cancer associated fibroblasts (CAFs) in tumor microenvironment. Front Biosci (Landmark Ed). 2010;15:166–179.
- Aguilera KY, Rivera LB, Hur H, Carbon JG, Toombs JE, Goldstein CD, Dellinger MT, Castrillon DH, Brekken RA. Collagen signaling enhances tumor progression after anti-VEGF therapy in a murine model of pancreatic ductal adenocarcinoma. Cancer Res. 2014;74:1032–1044. doi:10.1158/0008-5472.CAN-13-2800.
- Jung Y, Kim JK, Shiozawa Y, Wang J, Mishra A, Joseph J, Berry JE, McGee S, Lee E, Sun H, et al. Recruitment of mesenchymal stem cells into prostate tumours promotes metastasis. Nat Commun. 2013;4:1795. doi:10.1038/ncomms2766.
- Noma K, Smalley KS, Lioni M, Naomoto Y, Tanaka N, El-Deiry W, King AJ, Nakagawa H, Herlyn M. The essential role of fibroblasts in esophageal squamous cell carcinoma-induced angiogenesis. Gastroenterology. 2008;134:1981–1993. doi:10.1053/j.gastro.2008.02.061.
- Quante M, Tu SP, Tomita H, Gonda T, Wang SS, Takashi S, Baik GH, Shibata W, Diprete B, Betz KS, et al. Bone marrow-derived myofibroblasts contribute to the mesenchymal stem cell niche and promote tumor growth. Cancer Cell. 2011;19:257–272. doi:10.1016/j.ccr.2011.01.020.
- Feig C, Gopinathan A, Neesse A, Chan DS, Cook N, Tuveson DA. The pancreas cancer microenvironment. Clin Cancer Res. 2012;18:4266–4276. doi:10.1158/1078-0432.CCR-11-3114.
- Ozdemir BC, Pentcheva-Hoang T, Carstens JL, Zheng X, Wu CC, Simpson TR, Laklai H, Sugimoto H, Kahlert C, Novitskiy SV, et al. Depletion of carcinoma-associated fibroblasts and fibrosis induces immunosuppression and accelerates pancreas cancer with reduced survival. Cancer Cell. 2014;25:719–734. doi:10.1016/j.ccr.2014.04.005.
- Borriello L, Nakata R, Sheard MA, Fernandez GE, Sposto R, Malvar J, Blavier L, Shimada H, Asgharzadeh S, Seeger RC, et al. Cancer-associated fibroblasts share characteristics and protumorigenic activity with mesenchymal stromal cells. Cancer Res. 2017;77:5142–5157. doi:10.1158/0008-5472.CAN-16-2586.
- Lo A, Wang LC, Scholler J, Monslow J, Avery D, Newick K, O’Brien S, Evans RA, Bajor DJ, Clendenin C, et al. Tumor-promoting desmoplasia is disrupted by depleting FAP-expressing stromal cells. Cancer Res. 2015;75:2800–2810. doi:10.1158/0008-5472.CAN-14-3041.
- Roberts EW, Deonarine A, Jones JO, Denton AE, Feig C, Lyons SK, Espeli M, Kraman M, McKenna B, Wells RJB, et al. Depletion of stromal cells expressing fibroblast activation protein-alpha from skeletal muscle and bone marrow results in cachexia and anemia. J Exp Med. 2013;210:1137–1151. doi:10.1084/jem.20122344.
- Tran E, Chinnasamy D, Yu Z, Morgan RA, Lee CC, Restifo NP, Rosenberg SA. Immune targeting of fibroblast activation protein triggers recognition of multipotent bone marrow stromal cells and cachexia. J Exp Med. 2013;210:1125–1135. doi:10.1084/jem.20130110.
- Mitsunaga M, Ogawa M, Kosaka N, Rosenblum LT, Choyke PL, Kobayashi H. Cancer cell-selective in vivo near infrared photoimmunotherapy targeting specific membrane molecules. Nat Med. 2011;17:1685–1691. doi:10.1038/nm.2554.
- Ito K, Mitsunaga M, Arihiro S, Saruta M, Matsuoka M, Kobayashi H, Tajiri H. Molecular targeted photoimmunotherapy for HER2-positive human gastric cancer in combination with chemotherapy results in improved treatment outcomes through different cytotoxic mechanisms. BMC Cancer. 2016;16:37. doi:10.1186/s12885-016-2072-0.
- Shimoyama K, Kagawa S, Ishida M, Watanabe S, Noma K, Takehara K, Tazawa H, Hashimoto Y, Tanabe S, Matsuoka J, et al. Viral transduction of the HER2-extracellular domain expands trastuzumab-based photoimmunotherapy for HER2-negative breast cancer cells. Breast Cancer Res Treat. 2015;149:597–605. doi:10.1007/s10549-015-3265-y.
- Ishida M, Kagawa S, Shimoyama K, Takehara K, Noma K, Tanabe S, Shirakawa Y, Tazawa H, Kobayashi H, Fujiwara T. Trastuzumab-based photoimmunotherapy integrated with viral HER2 transduction inhibits peritoneally disseminated HER2-negative cancer. Mol Cancer Ther. 2016;15:402–411. doi:10.1158/1535-7163.MCT-15-0644.
- Sato K, Hanaoka H, Watanabe R, Nakajima T, Choyke PL, Kobayashi H. Near infrared photoimmunotherapy in the treatment of disseminated peritoneal ovarian cancer. Mol Cancer Ther. 2015;14:141–150. doi:10.1158/1535-7163.MCT-14-0658.
- Ogasawara K. 8. Revised “ethical guidelines for medical and health research involving human subjects”. Nihon Hoshasen Gijutsu Gakkai Zasshi. 2017;73:397–402. doi:10.6009/jjrt.2017_JSRT_73.5.397.
- Andl CD, Mizushima T, Nakagawa H, Oyama K, Harada H, Chruma K, Herlyn M, Rustgi AK. Epidermal growth factor receptor mediates increased cell proliferation, migration, and aggregation in esophageal keratinocytes in vitro and in vivo. J Biol Chem. 2003;278:1824–1830. doi:10.1074/jbc.M209148200.
- Grugan KD, Miller CG, Yao Y, Michaylira CZ, Ohashi S, Klein-Szanto AJ, Diehl JA, Herlyn M, Han M, Nakagawa H, et al. Fibroblast-secreted hepatocyte growth factor plays a functional role in esophageal squamous cell carcinoma invasion. Proc Natl Acad Sci U S A. 2010;107:11026–11031. doi:10.1073/pnas.0914295107.
- Okano J, Snyder L, Rustgi AK. Genetic alterations in esophageal cancer. Methods Mol Biol (Clifton, NJ). 2003;222:131–145.
- Okawa T, Michaylira CZ, Kalabis J, Stairs DB, Nakagawa H, Andl CD, Johnstone CN, Klein-Szanto AJ, El-Deiry WS, Cukierman E, et al. The functional interplay between EGFR overexpression, hTERT activation, and p53 mutation in esophageal epithelial cells with activation of stromal fibroblasts induces tumor development, invasion, and differentiation. Genes Dev. 2007;21:2788–2803. doi:10.1101/gad.1544507.
- Ariga N, Sato E, Ohuchi N, Nagura H, Ohtani H. Stromal expression of fibroblast activation protein/seprase, a cell membrane serine proteinase and gelatinase, is associated with longer survival in patients with invasive ductal carcinoma of breast. Int J Cancer. 2001;95:67–72.
- Henry LR, Lee HO, Lee JS, Klein-Szanto A, Watts P, Ross EA, Chen W-T, Cheng JD. Clinical implications of fibroblast activation protein in patients with colon cancer. Clin Cancer Res. 2007;13:1736–1741. doi:10.1158/1078-0432.CCR-06-1746.
- Mhawech-Fauceglia P, Yan L, Sharifian M, Ren X, Liu S, Kim G, Gayther SA, Pejovic T, Lawrenson K. Stromal expression of Fibroblast Activation Protein alpha (FAP) predicts platinum resistance and shorter recurrence in patients with epithelial ovarian cancer. Cancer Microenviron. 2015;8:23–31. doi:10.1007/s12307-014-0153-7.
- Gertler R, Schuster T, Feith M. Long-term outcome of almost 3,000 patients with carcinoma of the esophagus: evaluation of the new UICC/AJCC staging system. J Clin Oncol. 2011;29:64. doi:10.1200/jco.2011.29.4_suppl.64.
- Zhang D, Ding L, Li Y, Ren J, Shi G, Wang Y, Zhao S, Ni Y, Hou Y. Midkine derived from cancer-associated fibroblasts promotes cisplatin-resistance via up-regulation of the expression of lncRNA ANRIL in tumour cells. Sci Rep. 2017;7:16231. doi:10.1038/s41598-017-13431-y.
- Narra K, Mullins SR, Lee HO, Strzemkowski-Brun B, Magalong K, Christiansen VJ, McKee PA, Egleston B, Cohen SJ, Weiner LM, et al. Phase II trial of single agent Val-boroPro (Talabostat) inhibiting fibroblast activation protein in patients with metastatic colorectal cancer. Cancer Biol Ther. 2007;6:1691–1699. doi:10.4161/cbt.6.11.4874.
- Adams S, Miller GT, Jesson MI, Watanabe T, Jones B, Wallner BP. PT-100, a small molecule dipeptidyl peptidase inhibitor, has potent antitumor effects and augments antibody-mediated cytotoxicity via a novel immune mechanism. Cancer Res. 2004;64:5471–5480. doi:10.1158/0008-5472.CAN-04-0447.
- Sugimoto H, Mundel TM, Kieran MW, Kalluri R. Identification of fibroblast heterogeneity in the tumor microenvironment. Cancer Biol Ther. 2006;5:1640–1646. doi:10.4161/cbt.5.12.3354.
- Ohlund D, Elyada E, Tuveson D. Fibroblast heterogeneity in the cancer wound. J Exp Med. 2014;211:1503–1523. doi:10.1084/jem.20140692.
- Santos AM, Jung J, Aziz N, Kissil JL, Pure E. Targeting fibroblast activation protein inhibits tumor stromagenesis and growth in mice. J Clin Invest. 2009;119:3613–3625. doi:10.1172/JCI38988.
- Kraman M, Bambrough PJ, Arnold JN, Roberts EW, Magiera L, Jones JO, Gopinathan A, Tuveson DA, Fearon DT. Suppression of antitumor immunity by stromal cells expressing fibroblast activation protein-alpha. Science. 2010;330:827–830. doi:10.1126/science.1195300.
- Scott AM, Wiseman G, Welt S, Adjei A, Lee FT, Hopkins W, Divgi CR, Hanson LH, Mitchell P, Gansen DN, et al. A Phase I dose-escalation study of sibrotuzumab in patients with advanced or metastatic fibroblast activation protein-positive cancer. Clin Cancer Res. 2003;9:1639–1647.
- Hofheinz RD, al-Batran SE, Hartmann F, Hartung G, Jager D, Renner C, Tanswell P, Kunz U, Amelsberg A, Kuthan H, et al. Stromal antigen targeting by a humanised monoclonal antibody: an early phase II trial of sibrotuzumab in patients with metastatic colorectal cancer. Onkologie. 2003;26:44–48. doi:10.1159/000069863.
- Eager RM, Cunningham CC, Senzer N, Richards DA, Raju RN, Jones B, Uprichard M, Nemunaitis J. Phase II trial of talabostat and docetaxel in advanced non-small cell lung cancer. Clin Oncol (R Coll Radiol). 2009;21:464–472. doi:10.1016/j.clon.2009.04.007.
- Eager RM, Cunningham CC, Senzer NN, Stephenson J Jr, Anthony SP, O'Day SJ, Frenette G, Pavlick AC, Jones B, Uprichard M, et al. Phase II assessment of talabostat and cisplatin in second-line stage IV melanoma. BMC Cancer. 2009;9:263. doi:10.1186/1471-2407-9-263.
- Arnold JN, Magiera L, Kraman M, Fearon DT. Tumoral immune suppression by macrophages expressing fibroblast activation protein-alpha and heme oxygenase-1. Cancer Immunol Res. 2014;2:121–126. doi:10.1158/2326-6066.CIR-13-0150.
- Wang LC, Lo A, Scholler J, Sun J, Majumdar RS, Kapoor V, Antzis M, Cotner CE, Johnson LA, Durham AC, et al. Targeting fibroblast activation protein in tumor stroma with chimeric antigen receptor T cells can inhibit tumor growth and augment host immunity without severe toxicity. Cancer Immunol Res. 2014;2:154–166. doi:10.1158/2326-6066.CIR-13-0027.
- Feig C, Jones JO, Kraman M, Wells RJ, Deonarine A, Chan DS, Connell CM, Roberts EW, Zhao Q, Caballero OL, et al. Targeting CXCL12 from FAP-expressing carcinoma-associated fibroblasts synergizes with anti-PD-L1 immunotherapy in pancreatic cancer. Proc Natl Acad Sci U S A. 2013;110:20212–20217. doi:10.1073/pnas.1320318110.
- Taber SW, Fingar VH, Coots CT, Wieman TJ. Photodynamic therapy using mono-L-aspartyl chlorin e6 (Npe6) for the treatment of cutaneous disease: a Phase I clinical study. Clin Cancer Res. 1998;4:2741–2746.
- Ohashi S, Kikuchi O, Tsurumaki M, Nakai Y, Kasai H, Horimatsu T, Miyamoto S, Shimizu A, Chiba T, Muto M, et al. Preclinical validation of talaporfin sodium-mediated photodynamic therapy for esophageal squamous cell carcinoma. PLoS One. 2014;9:e103126. doi:10.1371/journal.pone.0103126.
- Sato K, Watanabe R, Hanaoka H, Nakajima T, Choyke PL, Kobayashi H. Comparative effectiveness of light emitting diodes (LEDs) and Lasers in near infrared photoimmunotherapy. Oncotarget. 2016;7:14324–14335. doi:10.18632/oncotarget.7365.
- Ito K, Mitsunaga M, Nishimura T, Kobayashi H, Tajiri H. Combination photoimmunotherapy with monoclonal antibodies recognizing different epitopes of human epidermal growth factor receptor 2: an assessment of phototherapeutic effect based on fluorescence molecular imaging. Oncotarget. 2016;7:14143–14152. doi:10.18632/oncotarget.7490.
- Paraiso KH, Smalley KS. Fibroblast-mediated drug resistance in cancer. Biochem Pharmacol. 2013;85:1033–1041. doi:10.1016/j.bcp.2013.01.018.
- Hoffman RM, Yang M. Color-coded fluorescence imaging of tumor-host interactions. Nat Protoc. 2006;1:928–935. doi:10.1038/nprot.2006.119.
- Gros SJ, Dohrmann T, Rawnaq T, Kurschat N, Bouvet M, Wessels J, Hoffmann RM, Izbicki JR, Kaifi JT. Orthotopic fluorescent peritoneal carcinomatosis model of esophageal cancer. Anticancer Res. 2010;30:3933–3938.
- Hoffman RM. Orthotopic metastatic mouse models for anticancer drug discovery and evaluation: a bridge to the clinic. Invest New Drugs. 1999;17:343–359.
- Ohara T, Takaoka M, Sakurama K, Nagaishi K, Takeda H, Shirakawa Y, Yamatsuji T, Nagasaka T, Matsuoka J, Tanaka N, et al. The establishment of a new mouse model with orthotopic esophageal cancer showing the esophageal stricture. Cancer Lett. 2010;293:207–212. doi:10.1016/j.canlet.2010.01.017.
- Hoffman RM. Patient-derived orthotopic xenografts: better mimic of metastasis than subcutaneous xenografts. Nat Rev Cancer. 2015;15:451–452. doi:10.1038/nrc3972.
- Kato T, Noma K, Ohara T, Kashima H, Katsura Y, Sato H, Komoto S, Katsube R, Ninomiya T, Tazawa H, et al. Cancer-associated fibroblasts affect intratumoral CD8(+) and FoxP3(+) T cells via IL6 in the tumor microenvironment. Clin Cancer Res. 2018;24:4820–4833. doi:10.1158/1078-0432.CCR-18-0205.
- Cohen N, Shani O, Raz Y, Sharon Y, Hoffman D, Abramovitz L, Erez N. Fibroblasts drive an immunosuppressive and growth-promoting microenvironment in breast cancer via secretion of Chitinase 3-like 1. Oncogene. 2017;36:4457–4468. doi:10.1038/onc.2017.65.
- Takahashi H, Sakakura K, Kudo T, Toyoda M, Kaira K, Oyama T, Chikamatsu K. Cancer-associated fibroblasts promote an immunosuppressive microenvironment through the induction and accumulation of protumoral macrophages. Oncotarget. 2017;8:8633–8647. doi:10.18632/oncotarget.14374.
- Yang X, Lin Y, Shi Y, Li B, Liu W, Yin W, Dang Y, Chu Y, Fan J, He R. FAP promotes immunosuppression by cancer-associated fibroblasts in the tumor microenvironment via STAT3-CCL2 signaling. Cancer Res. 2016;76:4124–4135. doi:10.1158/0008-5472.CAN-15-2973.
- Ogawa M, Tomita Y, Nakamura Y, Lee MJ, Lee S, Tomita S, Nagaya T, Sato K, Yamauchi T, Iwai H, et al. Immunogenic cancer cell death selectively induced by near infrared photoimmunotherapy initiates host tumor immunity. Oncotarget. 2017;8:10425–10436. doi:10.18632/oncotarget.14425.