
ABSTRACT
Neuroblastoma is the most common malignancy in infants. Overexpression of the epidermal growth factor receptor (EGFR) in neuroblastoma tumors underlies resistance to chemotherapeutics. UBE4B, an E3/E4 ubiquitin ligase involved in EGFR degradation, is located on chromosome 1p36, a region in which loss of heterozygosity is observed in approximately one-third of neuroblastoma tumors and is correlated with poor prognosis. In chemoresistant neuroblastoma cells, depletion of UBE4B yielded significantly reduced cell proliferation and migration, and enhanced apoptosis in response to EGFR inhibitor, Cetuximab. We have previously shown that UBE4B levels are inversely correlated with EGFR levels in neuroblastoma tumors. We searched for additional targets of UBE4B that mediate cellular alterations associated with tumorogenesis in chemoresistant neuroblastoma cells depleted of UBE4B using reverse phase protein arrays. The expression of STAT5a, an effector protein downstream of EGFR, doubled in the absence of UBE4B, and verified by quantitative immunoblotting. Chemoresistant neuroblastoma cells were treated with SH-4-54, a STAT5 inhibitor, and observed insignificant effects on cell proliferation, migration, and apoptosis. However, SH-4-54 significantly enhanced the anti-proliferative and anti-migratory effects of Cetuximab in naïve SK-N-AS neuroblastoma cells. Interestingly, in UBE4B depleted SK-N-AS cells, SH-4-54 significantly potentiated the effect of Cetuximab rendering cells increasingly sensitive an otherwise minimally effective Cetuximab concentration. Thus, neuroblastoma cells with low UBE4B levels were significantly more sensitive to combined EGFR and STAT5 inhibition than parental cells. These findings may have potential therapeutic implications for patients with 1p36 chromosome LOH and low tumor UBE4B expression.
KEYWORDS:
Introduction
Neuroblastoma is the most common extracranial solid tumor in childrenCitation1 and infants.Citation2 Treatments for neuroblastoma include surgical resection, radiation therapy, and myeloablative therapy combined with bone marrow transplant.Citation2 However, over 70% of children with neuroblastoma are diagnosed after metastasis has occurred, making a complete surgical cure unlikely.Citation3 For children with a relapsed neuroblastoma, the treatment options are limited because tumor cells rapidly develop resistance to conventional chemotherapeutics.Citation4 Relapsed cancers often develop resistance mechanisms that use drug efflux pumps, DNA repair mechanisms, or increased intracellular signaling to enhance their resistance to conventional treatment.Citation5 Two common cellular resistance mechanisms include an increase in the number of cell surface growth factor receptors and/or enhanced activation of downstream growth factor signaling pathways that result in uncontrolled cell proliferation, migration, and metastasis.Citation6-Citation8
Epidermal growth factor receptor (EGFR) plays a role in cancer initiation and progression.Citation9-Citation11 EGFR is overexpressed in many neuroblastoma tumorsCitation12 and typically results in poor outcomes.Citation7,Citation13-Citation15 EGFR expression and signaling are regulated by endocytic trafficking.Citation16,Citation17 Upon ligand binding and receptor dimerization, the EGFR is internalized from the plasma membrane, moves through the endocytic pathway, and sorted at the late endosome/multivesicular body (MVB) either for degradation upon MVB-lysosome fusion or for recycling back to the cell surface for continued proliferative signalling.Citation16-Citation19 Ubiquitination of membrane proteins on the limiting endosomal membrane regulates internalization into internal vesicles (ILVs) of the MVB,Citation12,Citation20 an important step that determines the subsequent itinerary of the EGFR.Citation21-Citation25 EGFR ubiquitination and subsequent lysosomal degradation can regulate the amount of EGFR on the cell surface and thereby modulates EGFR-mediated signaling.Citation7 Interestingly, EGFR inhibitors have not proven efficacious in neuroblastoma patients.Citation26 Moreover, the EGFR inhibitor CetuximabCitation7 and the EGFR tyrosine kinase inhibitor Erlotinib, are ineffective in inhibiting neuroblastoma cell proliferation.Citation7,Citation27
The Ubiquitin Conjugating factor E4B (UBE4B) is a cytosolic E3/E4 ubiquitin ligaseCitation20,Citation28 localized on chromosome 1p36 in a region that has a loss of heterozygosity (LOH) in about one-third of neuroblastoma patients.Citation29 UBE4B regulates the endosomal trafficking of EGFRCitation25 and UBE4B levels are inversely proportional to EGFR levels in neuroblastoma tumors.Citation7 Low UBE4B protein expression is also correlated with low cellular differentiation in neuroblastoma tumors.Citation14 Tumor UBE4B levels are also inversely proportional to the length of survival for neuroblastoma patientsCitation7 implicating UBE4B in neuroblastoma.
In tumor cell lines, transient depletion of UBE4B results in an increase in EGFR levels and activation of the downstream MAPK/ERK signaling pathway,Citation20 while overexpression of UBE4B decreases EGF-stimulated proliferation.Citation7 Overexpression of a UBE4B point mutant lacking ligase activity, UBE4BP1140A, decreases EGFR degradation.Citation7,Citation20 These data suggest a link between EGFR and UBE4B whereby decreased UBE4B expression, or inactivation of its enzyme activity, results in increased levels of EGFR and enhanced cellular proliferationCitation10 and implicates UBE4B regulation of EGFR trafficking in neuroblastoma proliferation. Increased EGFR levels are linked with chemoresistance.Citation30 We hypothesized that decreased levels of UBE4B, would render resistant neuroblastoma cells more sensitive to therapeutics targeting the EGFR. We reasoned that the increased levels of EGFR produced when UBE4B is depleted may provide an increased number of targets for drugs such as Cetuximab, a monoclonal antibody-based therapeutic that specifically targets the EGFR ectodomain,Citation10,Citation31,Citation32 and therefore improve its ability to inhibit proliferation and migration of resistant neuroblastoma cells.
We observed that Cetuximab reduced cellular proliferation in neuroblastoma cells depleted of UBE4B but did not significantly inhibit proliferation in parental neuroblastoma cells. To examine additional potential targets that may mediate the effects revealed in UBE4B-depleted tumor cells, a reverse phase protein array screen on UBE4B depleted chemoreisitant neuroblastoma cells was performed revealing a number of proteins whose levels were altered compared to control cells. Interestingly, the expression of STAT5a, an effector protein downstream of EGFR, doubled in the absence of UBE4B compared to parental cells and those treated with a scrambled ShRNA, an observation verified by quantitative immunoblotting. We targeted both EGFR and STAT5 in neuroblastoma cells using single agents alone (Cetuximab and the STAT5 inhibitor SH-4-54), or concurrently, and found that the combination of EGFR and STAT5 inhibition significantly reduced proliferation and migration of UBE4B-depleted neuroblastoma cells whereas either drug alone had minimal anti-proliferative or -migratory effect in control cells. UBE4B depletion also revealed an apoptotic effect of EGFR+STAT5 inhibition that was not observed in control cells. These findings offer potential therapeutic implications for neuroblastoma patients with 1p36 LOH and low tumor UBE4B expression.
Results
SK-N-AS and SK-N-BE(2) are resistant and LAN5 and CHP134 are sensitive neuroblastoma cell lines
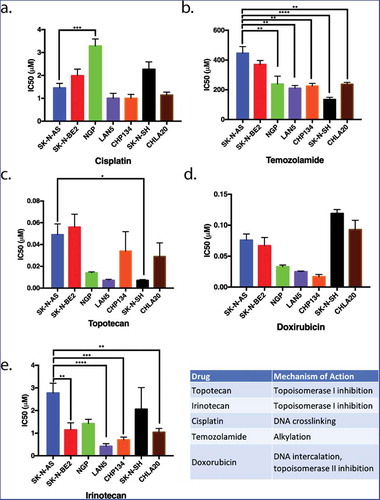
The relative sensitivity or resistance of commonly used neuroblastoma cell lines to chemotherapeutics has been previously described,Citation33 however, cross-lab variability because of cell passage number, culture conditions, drug formulation variability, and assay variability can affect these results.Citation34 Therefore, to determine which neuroblastoma cell lines were relatively resistant to chemotherapeutics, we examined the sensitivity of seven neuroblastoma cell lines () to five chemotherapeutics using the MTT metabolic activity assay. The concentration of drug that inhibits proliferation by 50% (IC50) was calculated for each drug in each cell line. These data revealed that SK-N-AS and SK-N-BE(2) cell lines were the most resistant, and LAN5 and CHP134 cells lines were the most sensitive to an array of chemotherapeutics ().
Figure 1. The proliferation of neuroblastoma cell lines in response to five commonly used chemotherapeutics. Seven different neuroblastoma cell lines were treated with various chemotherapeutic agents. The inhibitory concentrations required for 50% inhibition of proliferation (IC50) in vitro 72 hours following drug treatment were assessed as a means to compare the relative resistance of these cell lines to various chemotherapeutic agents. SK-N-AS and SK-N-BE(2) (blue and red, respectively) were generally more resistant to most drugs tested in that higher concentrations of chemotherapeutics were required for inhibition of proliferation. LAN5 and CHP134 (purple and orange) were generally more sensitive to most chemotherapeutics in that lower drug concentrations were required to inhibit proliferation. Graphs show the mean ± S.E.M. from at least three independent trials. Comparisons were made using ANOVA with post hoc Tukey test. * denotes p < .05, ** denotes p < .01, *** denotes p < .001.
Depletion of UBE4B in SK-N-AS results in increased EGFR levels and increased anti-proliferative responses to Cetuximab
We hypothesized that, since UBE4B promotes the degradation of the EGFR,Citation20 resistant cell lines that are depleted of UBE4B might become more sensitive to EGFR inhibition because of the increased EGFR expression. UBE4B was depleted in SK-N-AS cells using a lentiviral-delivered shRNA against UBE4B followed by antibiotic selection. Following one week of selection, we observed nearly undetectable levels of UBE4B in SK-N-AS cells infected with shUBE4B virus compared to scrambled virus or parental SK-N-AS cells (). In agreement with our previous dataCitation12 we observed a two-fold increase in EGFR levels following UBE4B depletion in SK-N-AS cellsCitation20 ().
Figure 2. Depletion of UBE4B reveals an inhibitory effect of Cetuximab on neuroblastoma cell proliferation in vitro. (a) Two different shRNAs (shRNA1, shRNA2) were delivered to SK-N-AS neuroblastoma cells using lentiviruses resulting in undetectable levels of UBE4B. (b) Depletion of UBE4B resulted in a concomitant increase in EGFR as previously described (Sirisaengtaksin et. al. 2014). (c) Proliferation of parental SK-N-AS cells (blue circles) or those infected with lentivirus encoding a scrambled shRNA (red squares) or an shRNA targeting UBE4B (green triangles) was similar. However, Cetuximab significantly inhibited proliferation only when UBE4B was depleted (d) compared to parental cells and those infected with a scrambled shRNA measured using an MTT assay (n = 3). Graphs (b-d) show the mean ±/- S.E.M. from three independent trials. Comparisons were made using ANOVA with post hoc Dunnett multiple comparison test. * denotes p < .05, ** denotes p < .01, *** denotes p < .001.
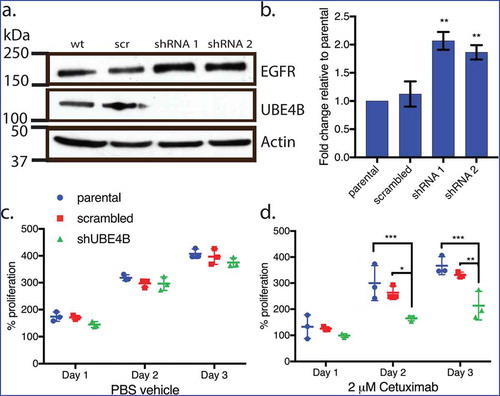
Increased EGFR levels promote cell proliferation in neuroblastomaCitation35 and are correlated with poor patient outcomes.Citation7,Citation27 We examined whether the increase in EGFR expression observed in chemoresistant neuroblastoma cells that were depleted of UBE4B might improve the ability of the anti-EGFR antibody, CetuximabCitation11 to inhibit cell proliferation. Treatment of UBE4B-depleted SK-N-AS cells with Cetuximab significantly inhibited cell proliferation compared to the effect of Cetuximab on parental cells (). Control experiments revealed that Cetuximab did not significantly affect the proliferation of parental SK-N-AS cells or SK-N-AS cells infected with a scrambled shRNA (). These data suggest that UBE4B depletion and subsequent increase in EGFR expression render resistant neuroblastoma cells more sensitive to the chemotherapeutic Cetuximab.
Depletion of UBE4B in SK-N-AS cells results in an increase in STAT5a expression
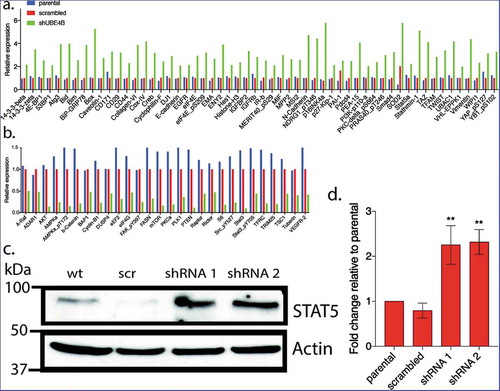
To examine whether UBE4B-depletion affects the expression of proteins that may be related to tumorigenesis we compared the reverse phase protein array (RPPA) profiles of parental SK-N-AS cells to SK-N-AS cells that had been depleted of UBE4B using a UBE4B specific shRNA or SK-N-AS cells infected with a scrambled shRNA (). The RPPA screen yielded quantitative data on 305 proteins linked to cancer proliferation, metastasis, and signaling (https://www.mdanderson.org/research/research-resources/core-facilities/functional-proteomics-rppa-core.html). We observed that the levels of 57 proteins increased by two-fold or more () and 26 proteins decreased by 50% or more (). As an internal control, EGFR was included in the analysis and RPPA confirmed a two-fold increase in EGFR which we verified using immunoblotting (), consistent with our previous studies.Citation7,Citation12,Citation20 Interestingly, RPPA analysis also revealed a two-fold increase in STAT5a levels that we confirmed by quantitative immunoblotting (. STAT5a is a member of the Jak/STAT signaling pathway activated by EGFR.Citation36 These data suggest that depletion of UBE4B in SK-N-AS cells can affect the levels of multiple proteins involved in EGFR-mediated signaling.
Figure 3. Reverse phase protein analysis (RPPA) was used to screen levels of 305 proteins associated with tumorgenesis in SK-N-AS cells that had been depleted of UBE4B using a UBE4B specific shRNA or SK-N-AS cells infected with a scrambled shRNA. Complete dataset showing the levels of 57 proteins that increased by two-fold or more () and 26 proteins that decreased by 50% or more (). [Please see methods for details on methodology and (https://www.mdanderson.org/research/research-resources/core-facilities/functional-proteomics-rppa-core.html)].
![Figure 3. Reverse phase protein analysis (RPPA) was used to screen levels of 305 proteins associated with tumorgenesis in SK-N-AS cells that had been depleted of UBE4B using a UBE4B specific shRNA or SK-N-AS cells infected with a scrambled shRNA. Complete dataset showing the levels of 57 proteins that increased by two-fold or more (Figure 3(a)) and 26 proteins that decreased by 50% or more (Figure 3(b)). [Please see methods for details on methodology and (https://www.mdanderson.org/research/research-resources/core-facilities/functional-proteomics-rppa-core.html)].](/cms/asset/f244e8f4-ac02-4838-a3ce-83c545d5a0ca/kcbt_a_1647049_f0003_oc.jpg)
Figure 4. Reverse Phase Protein Array (RPPA) was used to quantitatively measure changes in levels of 305 cancer-associated proteins following UBE4B depletion in neuroblastoma SK-N-AS cells. Protein levels were either increased (a) or decreased (b) relative to parental SK-N-AS or SK-N-AS cells infected with a scrambled shRNA. A positive control (EGFR) was included in the analysis and its levels were increased as previously described (Sirisaengtaksin et al 2014; and see STAT5a, increased in levels according to the RPPA analysis (a) and this increase was confirmed with quantitative immunoblotting in UBE4B-depleted SK-N-AS cells (c-d). (n = 3). D. Graph shows the mean ±/- S.E.M. Comparisons were made using ANOVA with post hoc Dunnett multiple comparison test. ** denotes p < .01.
Depletion of UBE4B enhances the anti-proliferative effect of Cetuximab
The increase in STAT5a levels observed after UBE4B depletion in SK-N-AS cells is of interest because of the role that STAT5 plays in proliferative cancers,Citation37-Citation39 tumor cell migration,Citation40 and because its constitutive activation can contribute to resistance to chemotherapy and EGFR-inhibitor mediated inhibition of proliferation.Citation41 We hypothesized that simultaneous targeting of both EGFR and STAT5 may be more effective at inhibiting SK-N-AS proliferation than either agent alone.
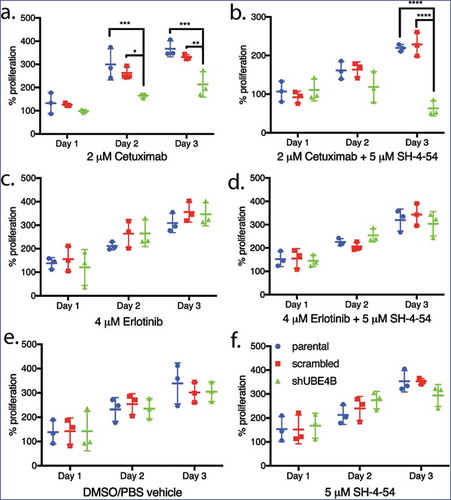
Parental neuroblastoma SK-N-AS cells were treated with Cetuximab and cell proliferation was measured. Cetuximab had no significant effect on proliferation of parental SK-N-AS cells or those that had been infected with the scrambled shRNA although the drug significantly inhibited proliferation of SK-N-AS cells that had been depleted of UBE4B (). Both the tyrosine kinase inhibitor, Erlotinib () and the STAT5 inhibitor, SH-4-54, had no significant effect on SK-N-AS cell proliferation in either parental SK-N-AS cells or those infected with a lentivirus containing a scrambled or UBE4B-specific shRNA (). The proliferation of SK-N-AS cells was also not affected by treatment with the diluent used for drug dilution (). However, the combination of Cetuximab and SH-4-5-4 resulted in an increased anti-proliferative effect compared to either agent alone only in SK-N-AS cells that had been depleted of UBE4B (). The enhanced sensitivity of SK-N-AS cells to Cetuximab in combination with SH-4-54 was not observed when SH-4-54 was combined with the EGFR tyrosine kinase inhibitor Erlotinib ().
Figure 5. Proliferation of wild type, scrambled, and UBE4B-depleted SK-N-AS neuroblastoma cells measured following treatment with either (a) Cetuximab alone, (c) Erlotinib alone, (b) a combination of Cetuximab with the STAT5 inhibitor, SH-4-54 (d) or a combination of Erlotinib with SH-4-54. Controls included treatment with the vehicle alone (e) or the STAT5 inhibitor SH-4-54 (f). Proliferation was assessed using an MTT assay every 24 hrs for 72 hrs. Percent proliferation is determined by dividing absorbance at day 1, 2, or 3 by the absorbance taken at day 0 (prior to drug administration) (n = 3). All data points and the mean ± S.E.M. are displayed for each time point and reflect the average of three independent trials. Comparisons were made using ANOVA with post hoc Dunnett multiple comparison test. * denotes p < .05, ** denotes p < .01, *** denotes p < .001.
The anti-proliferative effect of the Cetuximab/SH-4-54 combination is enhanced in UBE4B-depleted neuroblastoma cells
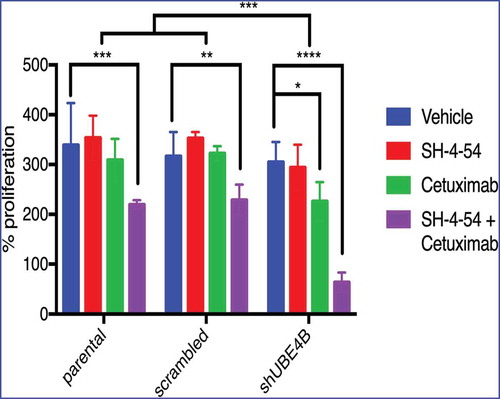
While neither Cetuximab or SH-4-54 inhibited proliferation of parental SK-N-AS cells (, left bars), Cetuximab inhibited SK-N-AS cell proliferation in UBE4B-depleted ( right bars, green vs blue or red), but not control (parental cells or parental cells infected with a scrambled shRNA) cells ( left and middle bars, green vs blue or red). STAT5 inhibition alone had no significant effect on SK-N-AS cell proliferation (red vs blue bars). Interestingly, the combination of Cetuximab and SH-4-54 significantly reduced proliferation of parental SK-N-AS cells ( left bars). We hypothesized that depletion of UBE4B may enhance the anti-proliferative effect of the SH-4-54+Cetuximab combination on SK-N-AS cells and we observed that the combination of SH-4-54 +Cetuximab has a significantly larger anti-proliferative effect in UBE4B-depleted SK-N-AS neuroblastoma compared to parental cells or cells expressing a scrambled shRNA ( right bars compared to left bars). These data suggest that low tumor UBE4B levels may render resistant neuroblastoma cells more sensitive to combination therapy targeting EGFR and STAT5a.
Figure 6. Depletion of UBE4B reveals an enhanced inhibitory effect of the combination of Cetuximab and SH-4-54 on the proliferation of SK-N-AS cells. SK-N-AS cells were treated with either vehicle, Cetuximab, SH-4-54, or Cetuximab+SH-4-54 and proliferation was assessed 72 hours following treatment initiation. Cetuximab (2μM) alone (green bars) significantly decreased proliferation only in cells that were depleted of UBE4B. Cetuximab did not significantly alter cell proliferation in parental cells or those infected with a lentivirus containing a scrambled shRNA (green bars). SH-4-54 did not alter SK-N-AS cell proliferation (red bars). Cetuximab inhibited SK-N-AS cell proliferation only when UBE4B was depleted (green bars). Treatment of SK-N-AS cells with a combination of Cetuximab and SH-4-54 significantly decreased proliferation in parental, scrambled, and UBE4B-depleted cells compared to cells treated with Cetuximab alone (purple bars). The antiproliferative effect of Cetuximab + SH-4-54 was significantly enhanced in UBE4B-depleted cells compared to parental cells or parental cells infected with lentivirus encoding a scrambled shRNA (purple bars, upper most comparison bar). All data points and the mean ± S.E.M. are displayed for each time point and reflect data collected from three independent trials. Comparisons were made using ANOVA with post hoc Dunnett multiple comparison test. * denotes p < .05, ** denotes p < .01, *** denotes p < .001.
Cetuximab and the STAT5 inhibitor SH-4-54 inhibit neuroblastoma cell migration
One of the challenges in treating stage 4 neuroblastoma is that the disease often has metastasized to other organs prior to diagnosis.Citation3 Cell migration is an initial step in the metastatic processCitation42 and is regulated by EGFR activation and downstream signaling cascades.Citation43 We used a trans-well model to determine whether EGFR and STAT5a inhibition might affect tumor cell migration in neuroblastoma cells that are UBE4B depleted.
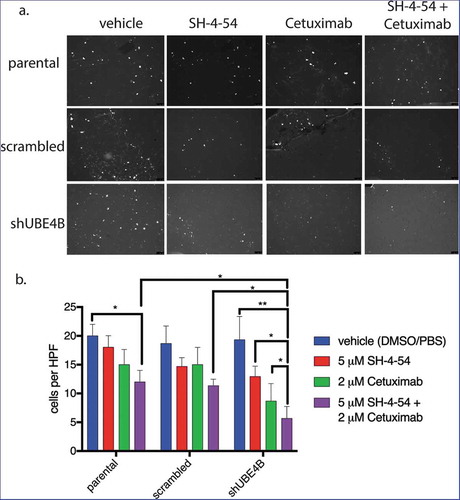
UBE4B-depleted SK-N-AS cells and control cells (parental cells and cells transfected with a scrambled shRNA) were pre-treated for 24 hours with a combination of Cetuximab and SH-4-54. Cetuximab and SH-4-54 alone did not significantly affect the migration of parental, scrambled, or UBE4B-depleted cells (). However, the combination of Cetuximab and SH-4-54 significantly reduced trans-well migration in UBE4B-depleted SK-N-AS cells when compared to the effect of the combination in parental and scrambled control cells (). These data suggest that in neuroblastoma cells with low levels of UBE4B, the combination of Cetuximab and SH4-54 may reduce tumor cell migration and may therefore inhibit tumor metastasis.
Figure 7. The migration of UBE4B-depleted SK-N-AS neuroblastoma cells is inhibited when treated with a combination of the STAT5 inhibitor SH-4-54 and Cetuximab. Cells were pretreated for 24 hours with the PBS/DMSO vehicle control (blue bars), SH-4-54 alone (red bars), Cetuximab alone (green bars), or a combination of SH-4-54 and Cetuximab (purple bars). Cells were seeded on the top surface of transwell membranes submerged in media supplemented with EGF. Membranes containing SK-N-AS cells were incubated for 24 hours in the presence of their respective drug treatment at 37°C. Membranes were then washed, fixed, and stained with DAPI to visualize migratory cells (a) which were then quantified by counting cells visible in a high-power field at 10x magnification and averaging at least three fields per condition (b) (n = 3). The antimigratory effect of Cetuximab+SH-4-54 was significantly enhanced in UBE4B-depleted cells compared to parental cells or parental cells infected with lentivirus encoding a scrambled shRNA (purple bars, top two upper most comparison bars). The mean ± S.E.M. are displayed for each condition and reflect data collected from three independent trials. Comparisons were made using ANOVA with post hoc Dunnett multiple comparison test. * denotes p < .05, ** denotes p < .01, *** denotes p < .001.
Simultaneous inhibition of both EGFR and STAT5 enhances the apoptosis of chemoresistant neuroblastoma cells
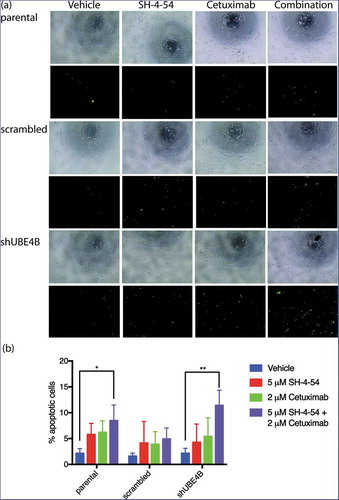
The decrease in cell proliferation produced by EGFR and STAT5 inhibition may be a result of increased cellular apoptosis. UBE4B-depleted SK-N-AS cells, parental cells, or cells transfected with a scrambled shRNA were treated with the drugs Cetuximab and SH-4-54, either individually or in combination, to determine whether EGFR and STAT5 inhibition affect cellular apoptosis. Using an assay that measures caspase 3 and 7 activation, we calculated the ratio of caspase 3 and 7 activated cells to the total number of cells as an indicator of cellular apoptosis (). Apoptotic activity was significantly increased in SK-N-AS cells that were treated with the combination of SH-4-54 and Cetuximab (15.3 ± 2.3% GFP positive) when compared with apoptosis in cells treated with SH-4-54 (4.3 ± 2.0%), or Cetuximab (5.4 ± 2.1%) compared to vehicle treated cells (2.2 ± 0.6% GFP positive cells). These data suggest that SH-4-54 enhances the effect of Cetuximab on apoptosis in SK-N-AS cells that are depleted of UBE4B.
Figure 8. Apoptosis of SK-N-AS neuroblastoma cells is enhanced by treatment with Cetuximab and SH-4-54. Parental SK-N-AS cells, SK-N-AS cells infected with a scrambled shRNA, or SK-N-AS cells depleted of UBE4B, were treated with vehicle (blue bars), SH-4-54 (5 μM, red bars) Cetuximab (2 μM, green bars), or a combination of Cetuximab and SH-4-54 (purple bars). Caspase-3/7 activity was assessed with CellEvent detection reagent and phase contrast microscopy to quantify cell numbers. Percent apoptotic cells (the ratio of fluorescent cells/total cell count) was significantly greater in UBE4B-depleted and parental cells treated with the drug combination compared to SK-N-AS cells treated with vehicle, or cells treated with either Cetuximab or SH-4-54 alone. The mean ±S.E.M. is displayed for each condition and reflects data collected from three independent trials. Comparisons were made using ANOVA with post hoc Dunnett multiple comparison test. * denotes p < .05, ** denotes p < .01, *** denotes p < .001.
Discussion
The UBE4B gene is located on chromosome 1p36, a region in which loss of heterozygosity is observed in approximately one-third of neuroblastoma tumors and is correlated with poor prognosis.Citation44-Citation46 The UBE4B gene is one of a small number of genes lying within the region of 1p36 that is associated with neuroblastoma.Citation12,Citation44,Citation47 UBE4B protein expression is reduced in high-stage tumors and is correlated with poor patient outcomesCitation48,Citation49 . The correlation between patient outcomes and UBE4B expression suggest that UBE4B may play a role in neuroblastoma, although the mechanisms and the relationship between UBE4B and neuroblastoma tumorigenesis are unknown.
We have previously reported that UBE4B is required for efficient degradation of the EGFR,Citation7,Citation20,Citation25 and that in patient tumor samples UBE4B expression is inversely related to EGFR protein expression,Citation7 signaling,Citation20 and cellular differentiation.Citation14 Thus, the decreased UBE4B levels resulting from an LOH on chromosome 1p36 may affect cellular EGFR levels by regulating the EGFR degradation pathwayCitation7 and result in increased proliferation. In the present study, we examined whether low UBE4B levels affected the sensitivity of chemoresistant neuroblastoma cells to therapeutics targeted toward the EGFR. Since depletion of UBE4B increases cellular EGFR levels, we hypothesized that the sensitivity of neuroblastoma cells to EGFR targeted treatments may be enhanced because of the additional EGFR targets expressed on the tumor cells. However, in addition to altered EGFR trafficking and downstream signaling,Citation12 low UBE4B levels may affect other targets. We therefore used reverse phase protein array (RPPA) to examine the effect of UBE4B depletion on levels of other oncogenic proteins.
We have previously shown that EGFR levels are increased when UBE4B is depleted and that inefficient endocytic trafficking of EGFR likely underlies this increase.Citation20 We observed that chemoresistant neuroblastoma cells that had been depleted of UBE4B became sensitive to Cetuximab. This is interesting because Cetuximab has not shown therapeutic benefit in pediatric solid tumors.Citation50 Since, we observed that the antiproliferative effect of Cetuximab is only observed in cells depleted of UBE4B, we hypothesize that that while Cetuximab may not be effective for all neuroblastoma patients, it may have benefit for those with low UBE4B tumor levels. Therefore, selection of patients based on either 1p36 LOH, or genetic/biochemical evaluation of resected tumors, may reveal a group of neuroblastoma patients for whom Cetuximab may be beneficial.
While many proteins were altered in neuroblastoma cells following UBE4B depletion, we observed a two-fold increase in STAT5 following depletion of UBE4B. The Jak/STAT pathway underlies proliferation in several cell typesCitation51-Citation54 and is downstream of EGFR,Citation36,Citation55 making this finding potentially interesting.Citation36 STAT5 has been pharmacologically targeted in treatments for breast cancer,Citation56 prostate cancer,Citation39 and leukemia.Citation57 Likewise, EGFR has been targeted with both antibodies and small molecule inhibitors in many cancer types, including non-small-cell lung cancer,Citation58 metastatic colorectal cancer,Citation59,Citation60 head and neck cancer,Citation61 pancreatic cancer,Citation9 and breast cancer.Citation62 Because EGFR and STAT5 lie in the same pathway, we tested whether depletion of UBE4B in chemoresistant neuroblastoma cells could increase the sensitivity of these cells to inhibition of proliferation by inhibiting STAT5 signaling. We observed that a combination of EGFR and STAT5 inhibition decreased neuroblastoma proliferation and increased apoptotic cell death in the chemoresistant neuroblastoma tumor line, SK-N-AS. These data suggest that a combination of EGFR and STAT5 inhibition may provide enhanced therapeutic benefit in neuroblastoma patients with low UBE4B expressing tumors.
Tumor cell migration underlies metastatic spread of disease,Citation42,Citation63 and metastasis to distant tissue sites is a hallmark of more advanced neuroblastoma.Citation64 EGFR activation and signaling leads to cancer cell proliferation in addition to cell migration.Citation65 In this regard, we observed that by themselves Cetuximab or SH-4-54 marginally inhibited cell migration, but that the combination of these drugs produced a significantly greater inhibition of migration than either drug alone. Moreover, migration in UBE4B-depleted cells was inhibited to a significantly greater extent than in parental SK-N-AS cells. Given that 70% of neuroblastoma patients present with tumor cell metastasis at the time of diagnosis,Citation3 these results provide a potential mechanism for screening patients that may be particularly receptive to this combination of drugs. Patients with refractory neuroblastoma often have fewer chemotherapeutic options because their cancer has evolved resistance to conventional frontline agents that target cell division and DNA replication. The novel combination of EGFR and STAT5 inhibition described here may provide an additional option for relapsed patients with 1p36 deletions and lower tumor UBE4B levels.
Materials and methods
Tissue culture
The SK-N-AS, SK-N-BE(2), CHP134, LAN5, CHLA20, and SK-N-SH human neuroblastoma cell lines used in this study have been previously utilized and described by our laboratory.Citation66 Cells were cultured in RPMI media (Corning Life Sciences, 10–040-CV) supplemented with 10% fetal bovine serum and 1% L-glutamine. TLA-HEK293T cells used for lentivirus production (Thermo Fisher Scientific, HCL4515) were cultured in DMEM (Corning Life Sciences, MT10013CV) with 10% fetal bovine serum at 37°C with 5% CO2 and passaged to maintain 20–80% confluence.
Chemotherapy agents
The chemotherapy agents Topotecan (T2705), Irinotecan (1406), Doxorubicin (PHR1789), Temozolomide (T2577), and Cisplatin (BP809) were obtained from Sigma. Topotecan was dissolved in PBS to make a 0.5 mM stock, Irinotecan was dissolved in DMSO (Sigma, W387520) to make a 50 mM stock, Doxorubicin was dissolved in PBS to make a 6.9 mM stock, Temozolomide was dissolved in DMSO to make a 50 mM stock, and Cisplatin was dissolved in PBS to make a 3 mM stock. Cetuximab (Erbitux, Eli Lilly) in a stock concentration of 2 mg/mL was a generous gift of the University of Texas MD Anderson Cancer Center pharmacy. The STAT5 inhibitor SH-4-54 (ApexBio Technology, B4789) was purchased as a 10 mM stock solution in DMSO. Drug dilutions were prepared in cell culture media from stock solutions prior to cell treatment.
Lentiviral depletion of UBE4B in neuroblastoma cells
UBE4B-shRNA was obtained from Sigma’s Mission shRNA library. See table for sequences (). Lentiviral packaging plasmids pMD2.g, pRSV-Rev, pMDLg/pRRE, and scrambled shRNA sequences were a gift of Dr. Sara Prijic (UTHealth McGovern Medical School, Houston, TX). Plasmid DNA was purified (Qiagen, 27104) and Lipofectamine 3000 (Thermo Fisher Scientific,L3000001) was used to transfect HEK 293T cells (60% confluent at the time of transfection) using the following amounts of DNA in each reaction: 2.24 µg shUBE4B or shScrambled DNA, 5.6 µg pMDLg/pRRE, 2.8 µg pRSV-Rev, and 3.36 µg pMD2.g. Twenty-four hours after HEK 293T cell transfection, culture media was aspirated and fresh media was added for an additional 48-hour incubation period. Following incubation, virus-containing culture medium was collected and supplemented with 1 μg polybrene (Sigma, H9268) per 1 mL of media, filtered through a 0.45-micron PVDF membrane (Thermo Fisher Scientific, PB5240) and used to infect target neuroblastoma cells plated at 80% confluence. Neuroblastoma cells were incubated with virus overnight, the media was changed to virus-free media, and the cells were incubated in fresh culture medium for 48 hours. Forty-eight hours after infection, the media was supplemented with 1 μg puromycin (Thermo Fisher Scientific, A1113803) per 1 mL of media to select for infected cells. Cells were selected until uninfected control cells had died, which typically took four days. Immunoblotting was used to examine UBE4B levels in infected and parental cells.
Table 1. shDNA sequences used for depleting UBE4B in neuroblastoma cell lines (Sigma Mission shRNA).
Western blotting
Cells were collected by scraping or using 5 mM EDTA (Millipore Sigma, 324503) and were centrifuged at 1500 x g for 10 minutes, resuspended in a small volume of RIPA (1% Triton X-100, 6.1% SDS, 150 mM NaCl, 50 mM Tris-HCl pH 8.0, 1% NP-40) buffer with a protease inhibitor cocktail (10 mM leupeptin, 1 µg/µL pepstatin, 0.3 mM aprotinin, and 1.74 µg/µL PMSF) (Thermo Fisher Scientific, 78438), lysed using sonication (5 pules of 1 second at output control 3, Branson Sonifier 250, VWR Scientific), and centrifuged at 2000 x g to separate membranes from cytosolic protein. Protein concentrations were quantified using BCA protein assay (Thermo Fisher, A53225) according to the manufacturer’s instructions. Twenty μg of protein were mixed with 6x loading buffer (50 mM Tris-HCl at pH 6.8, 4% SDS, 60% glycerol, 0.6% bromophenol blue, and 30% ß-mercaptoethanol), boiled for 5 minutes at 100°C, and separated using polyacrylamide gel electrophoresis (SDS-PAGE, 5% stacking, 10% separating) and transferred to nitrocellulose membranes under standard conditions. Membranes were blocked using 5% nonfat dry milk in PBS or 5% BSA in PBS based on manufacturer instructions. Membranes were incubated overnight at 4°C with anti-actin antibody (Sigma, A2066), anti-UBE4B antibody (Abcam, ab126759), anti-EGFR antibody (Invitrogen, 44-789G), or anti-STAT5 antibody (Cell Signaling, 9363). Membranes were subsequently washed three times with PBS-T and then incubated in a goat anti-rabbit secondary antibody (1:5000 for EGFR, 1:2000 for UBE4B, 1:5000 for actin, and 1:2000 for STAT5) conjugated to horseradish peroxidase (Sigma, A0545) for 1 hour at room temperature. The resulting signal was visualized using chemiluminescence (SuperSignal West Pico, Thermo Fischer Scientific, 34580) and film.
Methylthiazolyldiphenyl-tetrazolium bromide (MTT) cell metabolic activity assays
Human neuroblastoma cells were diluted 1:1 with trypan blue and counted with the Countess automated cell counter (Invitrogen). Cells were then diluted in RPMI media to enable plating at a confluence of 7.5e3 cells per well in a 96-well plate and incubated for 24 hours to allow adherence. On the second day, the media from each well was aspirated and replaced with 100 µL of complete RPMI media containing either a chemotherapy agent or the appropriate vehicle control. For experiments where only a 72-hour time point was taken, the treated cells were incubated for three days at 37°C with 5% CO2. In experiments involving Cetuximab, the drug was added fresh to the cells daily. For experiments involving daily measurements, cells were plated in triplicate so that daily MTT assays could be performed. MTT measures mitochondrial metabolic activity and is a surrogate measure for cell viability in response to a drug challenge. A stock solution of 5 mg/mL MTT (Sigma, M2128) in PBS was first prepared at a final concentration 0.5 mg/mL. The plate was protected from light and incubated for 4 hours prior to removal of the media.100 µL of DMSO was added to each well, incubated for 10 minutes, and the absorbance (560 nm) of each well was measured. The background absorbance of media only with the MTT reagent was measured and subtracted from the values recorded for each sample. Samples assessed daily were compared to the absorbance of cells at Day 0 before drug treatment. Statistical significance was calculated using a two-way ANOVA and Dunnett’s multiple comparisons test. All statistical analysis was performed with GraphPad Prism software version 7.
Calculation of IC50 values was done using a Boltzmann best-fit regression. Only data with a Pearson correlation coefficient ≥ 0.8 and at least three measurements between 20% and 80% viability were used for analysis. Significance of the IC50 results was assessed with a one-way ANOVA with a Tukey multiple comparison test.
Cleaved caspase assay
Parental, scrambled, and shUBE4B SK-N-AS cells were counted with the Countess automated cell counter and then plated at a density of 4e5 cells in 96-well plates and allowed to adhere overnight. Media was aspirated and replaced with 100 µL of media alone, media containing 5 μM SH-4-54, media containing 2 μM Cetuximab, or media containing a combination of 5 μM SH-4-54 and 2 μM cetuximab. CellEvent Caspase 3/7 Green Detection Reagent (Invitrogen, C10423) was added to the media of all four treatment groups at a final concentration of 3 μM, and the cells were incubated for 48 hrs at 37°C with 5% CO2 protected from light. Next, the cells were imaged using first phase contrast microscopy and then florescent microscopy using a GFP filter. The percentage of green-fluorescing cells to total cells was then calculated. Significance between groups was determined using a two-way ANOVA with Dunnett multiple comparison test using GraphPad Prism software version 7.
Transwell migration assay
Cells were seeded in six well plates at a density of 3e5 cells per well and incubated overnight at 37°C with 5% CO2 to adhere. The cells were treated with vehicle (DMSO and PBS) and media alone, media containing 5 μM SH-4-54, media containing 2 μM cetuximab, or media containing a combination of 5 μM SH-4-54 and 2 μM Cetuximab. The cells were incubated for an additional 24 hours. Cells were detached with trypsin and counted using the Countess automated cell counter. EGF was added to RPMI for a concentration of 100 ng/mL, and 750 μL was added to wells of a 12 well plate. Falcon Cell Culture inserts (Corning Life Sciences, ECM508) with 8 μm pores were submerged in the wells. Finally, 1.5e5 of the pre-treated SK-N-AS cells were diluted in serum-free RPMI media and added to the cell culture insert. The cells were allowed to incubate overnight 37°C with 5% CO2.
The following day the cells were washed and fixed for microscopy. Non-invading cells were scrubbed from the top surface of the membrane using a cotton-tipped swab moistened with media. Next, the membranes were fixed with 100% methanol for 5 minutes at room temperature. The membranes were then rinsed in diH2O for 1 minute and stained with a 1 μg/mL DAPI in PBS with 0.1% Tween for 20 minutes at room temperature protected from light. The membranes were then washed again in diH2O for 1 minute and inverted to dry. Lastly, a fine-tipped scalpel was used to cut the membranes from the insert. The membranes were placed bottom-side-up on a glass microscope slide. FluroSave reagent (Millipore Sigma, 345789) was added dropwise to the membranes. They were then covered with glass coverslips and then sealed with nail polish.
The glass slides were stored at 4°C protected from light and later imaged with 10x magnification on a fluorescent microscope. The instrument was set for DAPI with an excitation wavelength of 358 nm and an emission wavelength of 461 nm. At least three 10x fields on each membrane were counted, and the average number of cells that had migrated through the membrane was counted to compute the number of cells per high-powered field (HPF). The experiment was performed in triplicate and significance was determined with a two-way ANOVA and Dunnett’s multiple comparison test using GraphPad Prism.
Abbreviations
Author contributions
KM – Performed experiments, drafted and edited the manuscript.
DJS – Performed experiments, drafted and edited the manuscript.
AJB – Conceived of the project, provided funding, drafted and edited the manuscript.
Disclosure of potential conflicts of interest
No potential conflicts of interest were disclosed.
Acknowledgments
The authors would like to acknowledge Dr. Monica Gireud-Goss for help editing the manuscript, Dr. Max Odem for guidance on statistical analysis, and Linna Zhang for her help with MTT assays.
Additional information
Funding
References
- Valter K, Zhivotovsky B, Gogvadze V. Cell death-based treatment of neuroblastoma. Cell Death Dis. 2018;9:113. doi:10.1038/s41419-018-1111-y.
- Davidoff A. Neuroblastoma. Semin Pediatr Surg. 2012;21:2–14. doi:10.1053/j.sempedsurg.2011.10.009.
- Ara T, DeClerck YA. Mechanisms of invasion and metastasis in human neuroblastoma. Cancer Metastasis Rev. 2006;25:645–657. doi:10.1007/s10555-006-9028-9.
- Megison ML, Gillory LA, Beierle EA. Cell survival signaling in neuroblastoma. Anticancer Agents Med Chem. 2013;13:563–575.
- Holohan C, Van Schaeybroeck S, Longley DB, Johnston PG. Cancer drug resistance: an evolving paradigm. Nat Rev Cancer. 2013;13:714–726. doi:10.1038/nrc3599.
- Piskareva O, Harvey H, Nolan J, Conlon R, Alcock L, Buckley P, Dowling P, Henry M, O’Sullivan F, Bray I, et al. The development of cisplatin resistance in neuroblastoma is accompanied by epithelial to mesenchymal transition in vitro. Cancer Lett. 2015;364:142–155. doi:10.1016/j.canlet.2015.05.004.
- Zage PE, Sirisaengtaksin N, Liu Y, Gireud M, Brown BS, Palla S, Richards KN, Hughes DPM, Bean AJ. UBE4B levels are correlated with clinical outcomes in neuroblastoma patients and with altered neuroblastoma cell proliferation and sensitivity to epidermal growth factor receptor inhibitors. Cancer. 2013;119:915–923. doi:10.1002/cncr.27785.
- Witsch E, Sela M, Yarden Y. Roles for growth factors in cancer progression. Physiology. 2011;25:85–101. doi:10.1152/physiol.00045.2009.
- Mendelsohn J, Baselga J. Status of epidermal growth factor receptor antagonists in the biology and treatment of cancer. J Clin Oncol. 2003;21:2787–2799. doi:10.1200/JCO.2003.01.504.
- Lu Y, Li X, Liang K, Luwor R, Siddik ZH, Mills GB, Mendelsohn J, Fan Z. Epidermal growth factor receptor (EGFR) ubiquitination as a mechanism of acquired resistance escaping treatment by the anti-EGFR monoclonal antibody cetuximab. Cancer Res. 2007;67:8240–8247. doi:10.1158/0008-5472.CAN-07-0589.
- Mendelsohn J, Baselga J. Epidermal growth factor receptor targeting in cancer. Semin Oncol 2006;33:369–385. doi:10.1053/j.seminoncol.2006.04.003.
- Zage PE, Bean AJ. Growth factor receptor trafficking as a potential therapeutic target in pediatric cancer. Front Biol 2012;7:1–13. doi:10.1007/s11515-011-1181-z.
- Zheng C, Shen R, Li K, Zheng N, Zong Y, Ye D, Wang Q, Wang Z, Chen L, Ma Y. Epidermal growth factor receptor is overexpressed in neuroblastoma tissues and cells. Acta Biochim Biophys Sin (Shanghai). 2016;48:762–767. doi:10.1093/abbs/gmw064.
- Woodfield SE, Guo R, Liu Y, Major A, Hollingsworth E, Indiviglio S, Whittle S, Mo Q, Bean A, Ittmann M, et al. Neuroblastoma patient outcomes, tumor differentiation, and ERK activation are correlated with expression levels of the ubiquitin ligase UBE4B. Genes Cancer. 2016;7:13–26.
- Simon T, Berthold F, Borkhardt A, Kremens B, De Carolis B, Hero B. Treatment and Outcomes of patients with relapsed, high-risk neuroblastoma: results of German trials. Pediatr Blood Cancer. 2011;56:578–583. doi:10.1002/pbc.22696.
- Tomas A, Futter CE, Eden ER. EGF receptor trafficking: consequences for signaling and cancer. Trends Cell Biol. 2014;24:26–34. doi:10.1016/j.tcb.2013.11.002.
- Henriksen L, Grandal MV, Knudsen SLJ, van Deurs B, Grøvdal LM. Internalization mechanisms of the epidermal growth factor receptor after activation with different ligands. PLoS One. 2013;8:e58148. doi:10.1371/journal.pone.0058148.
- Gruenberg J. The endocytic pathway: a mosaic of domains. Nat Rev Mol Cell Biol 2001;2:721–730. doi:10.1038/35096054.
- Wong C, Mcnally C. EGF receptor ubiquitination is not necessary for its internalization. Proc Natl Acad Sci 2007;104:16904–16909. doi:10.1073/pnas.0707416104.
- Sirisaengtaksin N, Gireud M, Yan Q, Kubota Y, Meza D, Waymire JC, Zage PE, Bean AJ. UBE4B protein couples ubiquitination and sorting machineries to enable epidermal growth factor receptor (EGFR) degradation. J Biol Chem 2014;289:3026–3039. doi:10.1074/jbc.M113.495671.
- Eden ER, Huang F, Sorkin A, Futter CE. The role of EGF receptor ubiquitination in regulating its intracellular traffic. Traffic. 2012;13:329–337. doi:10.1111/j.1600-0854.2011.01305.x.
- Marmor MD, Yarden Y. Role of protein ubiquitylation in regulating endocytosis of receptor tyrosine kinases. Oncogene. 2004;23:2057–2070. doi:10.1038/sj.onc.1207444.
- Sun W, Vida TA, Sirisaengtaksin N, Merrill SA, Hanson PI, Bean AJ. Cell-free reconstitution of multivesicular body formation and receptor sorting. Traffic. 2010;11:867–876. doi:10.1111/tra.2010.11.issue-6.
- Mouneimne G, Hansen S, Selfors L, Petrak L, Hickey M, Gallegos L, Simpson K, Lim J, Gertler F, Hartwig J, et al. Differential remodeling of actin cytoskeleton architecture by profilin isoforms leads to distinct effects on cell migration and invasion. Cancer Cell. 2012;22:615–630. doi:10.1016/j.ccr.2012.09.027.
- Gireud-Goss M, Reyes S, Wilson M, Farley M, Memarzadeh K, Srinivasan S, Sirisaengtaksin N, Yamashita S, Tsunoda S, Lang FF, et al. Distinct mechanisms enable inward or outward budding from late endosomes/multivesicular bodies. Exp Cell Res. 2018;372:1–15. doi:10.1016/J.YEXCR.2018.08.027.
- Rössler J, Odenthal E, Geoerger B, Gerstenmeyer A, Lagodny J, Niemeyer CM, Vassal G. EGFR inhibition using gefitinib is not active in neuroblastoma cell lines. Anticancer Res. 2009;29:1327–1334.
- Richards KN, Zweidler-McKay PA, Van Roy N, Speleman F, Trevino J, Zage PE, Hughes DPM. Signaling of ERBB receptor tyrosine kinases promotes neuroblastoma growth in vitro and in vivo. Cancer. 2010;116:3233–3243. doi:10.1002/cncr.v116:13.
- Du C, Wu H, Leng RP. UBE4B targets phosphorylated p53 at serines 15 and 392 for degradation. 2015;7:2823–2836.
- Carén H, Fransson S, Ejeskär K, Kogner P, Martinsson T. Genetic and epigenetic changes in the common 1p36 deletion in neuroblastoma tumours. Br J Cancer. 2007;97:1416–1424. doi:10.1038/sj.bjc.6604032.
- Song S, Honjo S, Jin J, Chang -S-S, Scott AW, Chen Q, Kalhor N, Correa AM, Hofstetter WL, Albarracin CT, et al. The hippo coactivator YAP1 mediates EGFR overexpression and confers chemoresistance in esophageal cancer. Clin Cancer Res 2015;21:2580–2590. doi:10.1158/1078-0432.CCR-14-2191.
- Pozzi C, Cuomo A, Spadoni I, Magni E, Silvola A, Conte A, Sigismund S, Ravenda PS, Bonaldi T, Zampino MG, et al. The EGFR-specific antibody cetuximab combined with chemotherapy triggers immunogenic cell death. Nat Med 2016;22:624–631. doi:10.1038/nm.4078.
- Cunningham D, Cunningham D, Humblet Y, Siena S, Khayat D, Bleiberg H, Santoro A, Bets D, Mueser M, Harstrick A, et al. Cetuximab monotherapy and cetuximab plus irinotecan in irinotecan-refractory metastatic colorectal cancer. N Engl J Med 2004;351:337–345. doi:10.1056/NEJMcp041956.
- Thiele CJ. Neuroblastoma cell lines. Hum Cell. 1998;1:21–53.
- Kalliokoski T, Kramer C, Vulpetti A, Gedeck P, Cavalli A. Comparability of mixed IC50 data - a statistical analysis. PLoS One. 2013;8:e61007. doi:10.1371/journal.pone.0061007.
- Ho R, Minturn JE, Hishiki T, Zhao H, Wang Q, Cnaan A, Maris J, Evans AE, Brodeur GM. Proliferation of human neuroblastomas mediated by the epidermal growth factor receptor. Cancer Res. 2005;65:9868–9875. doi:10.1158/0008-5472.CAN-04-4557.
- Quesnelle KM, Boehm AL, Grandis JR. STAT‐mediated EGFR signaling in cancer. J Cell Biochem 2007;102:311–319. doi:10.1002/(ISSN)1097-4644.
- Schafranek L, Nievergall E, Powell JA, Hiwase DK, Leclercq T, Hughes TP, White DL. Sustained inhibition of STAT5, but not JAK2, is essential for TKI-induced cell death in chronic myeloid leukemia. Leukemia. 2015;29:76–85. doi:10.1038/leu.2014.245.
- Wingelhofer B, Maurer B, Heyes EC, Cumaraswamy AA, Berger-Becvar A, de Araujo ED, Orlova A, Freund P, Ruge F, Park J, et al. Pharmacologic inhibition of STAT5 in acute myeloid leukemia. Leukemia. 2018;1–12. doi:10.1038/s41375-017-0005-9.
- Mohanty SK, Yagiz K, Pradhan D, Luthringer DJ, Amin MB, Alkan S, Cinar B. STAT3 and STAT5A are potential therapeutic targets in castration-resistant prostate cancer. Oncotarget. 2017;8:85997–86010. doi:10.18632/oncotarget.v8i49.
- Roos A, Dhruv HD, Peng S, Inge LJ, Tuncali S, Pineda M, Millard N, Mayo Z, Eschbacher JM, Loftus JC, et al. EGFRvIII–stat5 signaling enhances glioblastoma cell migration and survival. Mol Cancer Res 2018;16:1185–1195. doi:10.1158/1541-7786.MCR-18-0125.
- Koppikar P, Lui VWY, Man D, Xi S, Chai RL, Nelson E, Tobey ABJ, Grandis JR. Constitutive activation of STAT5 contributes to tumor growth, epithelial-mesenchymal transition, and resistance to EGFR targeting. Clin Cancer Res. 2008;14:7682–7690. doi:10.1158/1078-0432.CCR-08-1328.
- Van Zijl F, Krupitza G, Mikulits W. Initial steps of metastasis: cell invasion and endothelial transmigration. Mutat Res Rev Mutat Res 2011;728:23–34. doi:10.1016/j.mrrev.2011.05.002.
- Alper O, Bergmann-Leitner ES, Bennett TA, Hacker NF, Stromberg K, Stetler-Stevenson WG. Epidermal growth factor receptor signaling and the invasive phenotype of ovarian carcinoma cells. J Natl Cancer Inst. 2001;93:1375–1384. doi:10.1093/jnci/93.18.1375.
- Caron H, van Sluis P, de Kraker J, Bökkerink J, Egeler M, Laureys G, Slater R, Westerveld A, Voûte PA, Versteeg R. Allelic loss of chromosome 1p as a predictor of unfavorable outcome in patients with neuroblastoma. N Engl J Med 1996;334:225–230. doi:10.1056/NEJM199606133342404.
- Attiyeh EF, London WB, Mossé YP, Wang Q, Winter C, Khazi D, McGrady PW, Seeger RC, Look AT, Shimada H, et al. Chromosome 1p and 11q deletions and outcome in neuroblastoma. N Engl J Med 2005;353:2243–2253. doi:10.1056/NEJMoa052399.
- Maris JM, Guo C, Blake D, White PS, Hogarty MD, Thompson PM, Rajalingam V, Gerbing R, Stram DO, Matthay KK, et al. Comprehensive analysis of chromosome 1p deletions in neuroblastoma. Med Pediatr Oncol 2001;36:32–36. doi:10.1002/(ISSN)1096-911X.
- Hatakeyama S, Yada M, Matsumoto M, Ishida N, Nakayama KI. U box proteins as a new family of ubiquitin-protein ligases. J Biol Chem 2001;276:33111–33120. doi:10.1074/jbc.M102755200.
- Krona C, Ejeskär K, Abel F, Kogner P, Bjelke J, Björk E, Sjöberg R-M, Martinsson T. Screening for gene mutations in a 500 kb neuroblastoma tumor suppressor candidate region in chromosome 1p; mutation and stage-specific expression in UBE4B/UFD2. Oncogene. 2003;22:2343–2351. doi:10.1038/sj.onc.1206324.
- Carén H, Ejeskär K, Fransson S, Hesson L, Latif F, Sjöberg R-M, Krona C, Martinsson T. A cluster of genes located in 1p36 are down-regulated in neuroblastomas with poor prognosis, but not due to CpG island methylation. Mol Cancer. 2005;4:10. doi:10.1186/1476-4598-4-10.
- Trippett TM, Herzog C, Whitlock JA, Wolff J, Kuttesch J, Bagatell R, Hunger SP, Boklan J, Smith AA, Arceci RJ, et al. Phase I and pharmacokinetic study of cetuximab and irinotecan in children with refractory solid tumors: A study of the pediatric oncology experimental therapeutic investigators’ consortium. J Clin Oncol. 2009;27:5102–5108. doi:10.1200/JCO.2008.20.8975.
- Niu G, Wright KL, Huang M, Song L, Haura E, Turkson J, Zhang S, Wang T, Sinibaldi D, Coppola D, et al. Constitutive Stat3 activity up-regulates VEGF expression and tumor angiogenesis. Oncogene. 2002;21:2000–2008. doi:10.1038/sj.onc.1205260.
- Hatakeyama S. Ubiquitin-mediated regulation of JAK-STAT signaling in embryonic stem cells. Jak-Stat. 2012;1:168–175. doi:10.4161/jkst.21560.
- Dowlati A, Nethery D, Kern JA. Combined inhibition of epidermal growth factor receptor and JAK / STAT pathways results in greater growth inhibition in vitro than single agent therapy Combined inhibition of epidermal growth factor receptor and JAK / STAT pathways results in greater grow. 2004:3(4):459–463.
- Darnell J, Kerr I, Stark G. Jak-STAT pathways and transcriptional activation in response to IFNs and other extracellular signaling proteins. Science (80-). 1994;264:1415–1421. doi:10.1126/science.8197455.
- Rawlings JS, Rosler KM, Harrison DA. The JAK/STAT signaling pathway. J Cell Sci 2004;117:1281–1283. doi:10.1242/jcs.00963.
- Barash I. Stat5 in breast cancer: potential oncogenic activity coincides with positive prognosis for the disease. Carcinogenesis. 2012;33:2320–2325. doi:10.1093/carcin/bgs362.
- Warsch W, Kollmann K, Eckelhart E, Fajmann S, Cerny-Reiterer S, Holbl A, Gleixner KV, Dworzak M, Mayerhofer M, Hoermann G, et al. High STAT5 levels mediate imatinib resistance and indicate disease progression in chronic myeloid leukemia. Blood. 2011;117:3409–3420. doi:10.1182/blood-2009-10-248211.
- Douillard J-Y, Pirker R, O'Byrne KJ, Kerr KM, Störkel S, von Heydebreck A, Grote HJ, Celik I, Shepherd FA. Relationship between EGFR expression, EGFR mutation status, and the efficacy of chemotherapy plus cetuximab in FLEX study patients with advanced non-small-cell lung cancer. J Thorac Oncol. 2014;9:717–724. doi:10.1097/JTO.0000000000000011.
- Rouyer M, François E, Cunha AS, Monnereau A, Noize P, Robinson P, Droz-Perroteau C, Le Monies de Sagazan A, Jové J, Lassalle R, et al. Effectiveness of cetuximab as first-line therapy for patients with wild-type KRAS and unresectable metastatic colorectal cancer in real-life practice: results of the EREBUS cohort. Clin Colorectal Cancer. 2018;33:1–11.
- Karapetis C, Khambata-Ford S, Jonker DJ, O'Callaghan CJ, Tu D, Tebbutt NC, Simes RJ, Chalchal H, Shapiro JD, Robitaille S, et al. K-ras mutations and benefit from cetuximab in advanced colorectal cancer. N Engl J Med 2015;372:311–319.
- Santuray RT, Johnson DE, Grandis JR. New therapies in head and neck cancer. Trends Cancer. 2018;4:385–396. doi:10.1016/j.trecan.2018.03.006.
- Modjtahedi H, Essapen S. Epidermal growth factor receptor inhibitors in cancer treatment: advances, challenges and opportunities. Anticancer Drug. 2009;20:851–855. doi:10.1097/CAD.0b013e3283330590.
- Entschladen F, Drell TL VI, Lang K, Joseph J, Zaenker KS. Tumour-cell migration, invasion, and metastasis: navigation by neurotransmitters. Lancet Oncol. 2004;5:254–258. doi:10.1016/S1470-2045(04)01431-7.
- Monclair T, Brodeur GM, Ambros PF, Brisse HJ, Cecchetto G, Holmes K, Kaneko M, London WB, Matthay KK, Nuchtern JG, et al. The International Neuroblastoma Risk Group (INRG) staging system: an INRG task force report. J Clin Oncol. 2009;27:298–303. doi:10.1200/JCO.2008.16.6876.
- Hölsken A, Gebhardt M, Buchfelder M, Fahlbusch R, Blumcke I, Buslei R. EGFR signaling regulates tumor cell migration in craniopharyngiomas. Clin Cancer Res. 2011;17:4367–4377. doi:10.1158/1078-0432.CCR-10-2811.
- Zhang L, Scorsone K, Woodfield SE, Zage PE. Sensitivity of neuroblastoma to the novel kinase inhibitor cabozantinib is mediated by ERK inhibition. Cancer Chemother Pharmacol 2015;76:977–987. doi:10.1007/s00280-015-2871-z.