
ABSTRACT
EGFR-TKIs such as erlotinib and gefitinib have been introduced into the first-line treatment for patients having a mutation of deletion in exon 19 or L858R missense mutations in exon 21. Almost all patients who respond to EGFR-TKIs at first place eventually develop acquired resistance after several months of therapy. The secondary mutations and bypass signaling activation are involved in the generation of the resistance. Hypoxia in non-small cell lung cancer (NSCLC) is an important factor in treatment resistance including radiotherapy, chemotherapy and EGFR-TKI therapy. In this study, the effect of hypoxic cancer microenvironment in the bypass signaling activation was investigated. We found that bone marrow-derived mesenchymal stem cells (BMSCs) residing in the hypoxic solid cancer microenvironment highly produced molecules associated with adipocytes including adipokine leptin and IGFBPs. Leptin could induce the resistance of lung cancer cells to erlotinib through activating IGF-1R signaling. IGFBP2 counteracted the activation role of IGF-1 and induced erlotinib resistance by activating IGF-1R signaling in an IGF-1 independent manner. IGFBP2 had synergistic effect with leptin to induce erlotinib resistance. Leptin and IGFBP2 may be predictive factors for acquired resistance for EGFR-TKIs.
Introduction
Lung cancer is the leading cause of cancer-related mortality around the world. Tyrosine kinase inhibitors (TKIs) against the epidermal growth factor receptor (EGFR-TKIs) such as erlotinib and gefitinib have demonstrated improved progression-free survival (PFS) and overall survival (OS) in patients and are currently approved for the management of non-small cell lung cancer (NSCLC) patients.Citation1
Patients whose tumors harbor EGFR exon 19 deletions or L858R missense mutations in exon 21 display obvious response rate to erlotinib.Citation2 However, erlotinib may also have efficacy against EGFR mutation-negative NSCLC.Citation3,Citation4 EGFR-TKIs resulted in significantly prolonged PFS in all patients who received EGFR-TKIs following first-line platinum chemotherapy regardless of EGFR status or expression.Citation5 Some researchers recommended that EGFR-TKIs should be considered for all NSCLC patients in the second-line, third-line, or maintenance setting, including those patients who are EGFR mutation negative.Citation6 On the other hand, a substantial fraction of patients who have EGFR sensitive mutations fail to respond to EGFR-TKIs.Citation7,Citation8 Despite the obvious responses, the use of EGFR-TKIs is limited because acquired resistance always occurs after a median of approximately 10 months.Citation9 The known mechanisms for these acquired resistance include EGFR T790M mutation, MET or ErbB2 amplification or activation of bypass signaling.Citation9,Citation10. NSCLC cells harboring either wild-type (WT) EGFR or mutant L858R EGFR become resistant to the effects of TKIs by Src activation.Citation10
Hypoxia is a feature of solid tumors. Hypoxia in NSCLC is an important factor in treatment resistance including radiotherapy, chemotherapy and EGFR-TKI treatment.Citation11 The combination of EGFR-TKIs with hypoxia-targeted therapies has been intensively studied.Citation11 Hypoxia promotes EGFR-TKI resistance in EGFR-sensitive-mutant NSCLC cell lines through activation of IGF-1R, whereas HIF-1α inhibition could reverse the resistance.Citation12 As EGFR mutant cells are highly dependent on EGFR pathway. In this study, we aim to study how bypass signaling induce EGFR-TKI resistance regardless of EGFR mutations. Bone Marrow-derived Mesenchymal stem cells (BMSCs) are recruited to cancer sites in response to chemokines from cancer cells and are the main component of cancer microenvironment.Citation13 BMSCs possess the potential to differentiate into osteoblast, adipocytes, etc. Hypoxia affects the differentiation of BMSCs.Citation14 In the present study, we are going to elucidate the effect of BMSCs in hypoxic cancer microenvironment on the EGFR-TKI resistance. To exclude the effect of EGFR resistant mutation, we used A549 cells, H358 cells, H460 cells and mouse Lewis Lung Carcinoma LLC cells which are normally used for EGFR-TKI treatment research without sensitive mutations or resistant T790M mutation, because they respond to EGFR-TKI in vitro and in vivo although lack of EGFR sensitive mutation.Citation15
Results
BMSCs contribute to the resistance of lung cancer cells to erlotinib in hypoxia
NSCLC cell lines A549 cells, H358 cells, H460 cells and mouse lung carcinoma cell line LLC cells were used in the study. Erlotinib inhibited the proliferation of A549, H358, H460 cell lines and LLC cells in a dose-dependent manner ()). Bone marrow is hypoxic and has an oxygen tension around 1–7%.Citation16 Areas with very low (down to zero) oxygen partial pressures exist in solid tumors because aggressive tumor cells rapidly surpass the capacity of the nearest blood vessel.Citation17 BMSCs were exposed to extreme hypoxia when they move to tumor sites. We then examined the effects of BMSCs on the erlotinib resistance in lung cancer cells under hypoxic tumor microenvironment. We co-cultured BMSCs with lung cancer cells in hypoxic chamber for 3 days in the presence of erlotinib. Co-culture with BMSCs promoted lung cancer cell growth after treatment of erlotinib in hypoxic chamber which were set to be 0.2% of oxygen ()). We also collected the hypoxic-conditioned media from hypoxia-treated BMSCs and treated lung cancer cells with the media in the presence of erlotinib. We found that the hypoxic-conditioned media induced the resistance of lung cancer cells to erlotinib compared to media collected from normoxic BMSCs ()). This finding suggested that hypoxic BMSCs improved the resistance of lung cancer cells to erlotinib mediated by secreted molecules.
Figure 1. BMSCs contribute to erlotinib resistance in lung cancer cells in hypoxia. (a) Erlotinib inhibited the proliferation of A549, H358, H460 cell lines and LLC cells in a dose-dependent manner. (b) Co-culture with BMSCs increased lung cancer cell growth after treatment of erlotinib in hypoxic conditions. (c) Media collected from hypoxic BMSCs increased cancer cell growth after treatment of erlotinib.CCK-8 cell viability assay was performed to evaluate cell viability after treatment of erlotinib. Results are presented as the median of three independent experiments (**p < .01, ***p < .001, Student’s t test). (d) BMSCs promoted erlotinib resistance in syngeneic mouse lung cancer model. LLC cells with or without BMSCs were injected subcutaneously into C57BL/6 mice. When the tumor reached approximately 250–300 mm3, the mice were treated with erlotinib. Tumors excised from the mice are shown. (e) Tumor growth curve presenting in tumor volume. Each bar represents the mean tumor volume with 95% confidence intervals. Tumors were measured every 2 days. Results are presented as the median of three independent experiments (*p < .05, **p < .01, Student’s t test). (f) Immunofluorescence analysis of ki67 in tumors. Upper: tumors from mice receiving co-injection of BMSCs and LLC; lower: tumors from mice receiving injection of LLC alone. Red dots indicate the ki67 positive cells. The amplifications were presented. (g) Scatter plot of the observed expression scores of ki67. Expression was scored semi-quantitatively by positive area.
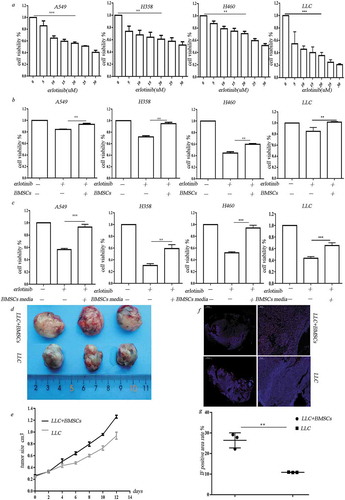
To assess the in vivo effect of BMSCs on erlotinib resistance in lung cancer cells, we established a syngeneic model in which Lewis Lung Carcinoma cells were mixed with mice BMSCs at 1:1 ratio and injected subcutaneously into C57BL/6mice. The mice of control group were administrated with same amount of LLC cells. When the mean tumor volume reached 250–300 mmCitation3, the mice were orally administrated with erlotinib. Co-injection of LLC cells and BMSCs led to increased tumor size after treatment of erlotinib compared to LLC injection alone (, ), n = 3/group, p < .05, ANOVA).A higher expression of the proliferative marker ki67 was observed in tumors in co-injection group compared to control group (, )).
Adipocyte-associated cytokines secreted from BMSCs under hypoxia
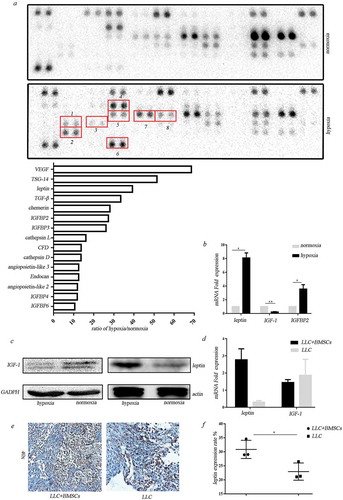
Our previous work demonstrated that BMSCs have the potential to differentiate into adipocytes under extreme hypoxia and expressed adipocyte-related genes including leptin, CFD, LPL, etc.Citation18 We then examined the effect of hypoxia on adipokine secretion by BMSCs. Adipokine array assay revealed that the secretion of adipokines by BMSCs was significantly enhanced after hypoxic treatment, including LEP, CFD, Cathepsin L, etc. We also found that the secreted TGF-β1, VEGF, Angiopoietin-like3, IGFBP-2, IGFBP-3, IGFBP-4, etc. were dramatically elevated ()). Real-time PCR and western blot were performed to confirm the upregulation of leptin in the hypoxia-treated BMSCs (,)). Unexpectedly, IGF-1 which is obesity-associated hormone decreased in hypoxic BMSCs (, )). Leptin mRNA was obviously upregulated in the tumor tissues formed after co-injection of BMSCs and LLC compared with the injection of LLC alone ()). There was no significant difference in IGF-1 expression in tumor tissues of co-injection and LLC injection alone ()). Increased leptin expression in stromal cells was observed in tumor tissues in co-injection tumor tissues (,)).
Figure 2. Adipocyte-associated cytokines secreted from BMSCs under hypoxia. (a) Adipokine array profiling. Determination of expression was based on a comparison of the captured antibody of interest to the positive controls. The signals were captured and the intensity of the dots was quantified using a Bio-Rad ChemiDoc XRS system (Bio-Rad, CA, USA). The resulting images were analyzed using Image J to measure the expression of various targets. A positive control was used to normalize the results from the different membranes being compared. To compare the signal intensities, the relative expression levels are shown below. 1. TGF-β; 2. TSG-14; 3. leptin; 4. CFD; 5. IGFBP2; 6.TNF-α; 7. IGFBP-3; 8. TGFBP-4. (b) Real-time PCR analysis for gene expression in hypoxic BMSCs (*p < .05, **p < .01, Student’s t test). (c) Western blot analysis for protein expression in hypoxic BMSCs. (d) Real-time PCR analysis for gene expression in tumors formed in mice receiving co-injection with BMSCs or LLC injection alone (*p < .05, **p < .01, Student’s t test). (e) IHC analysis of leptin in tumors. (f) Expression of leptin in stromal cells was scored semi-quantitatively.
Leptin mediates erlotinib resistance in lung cancer cells
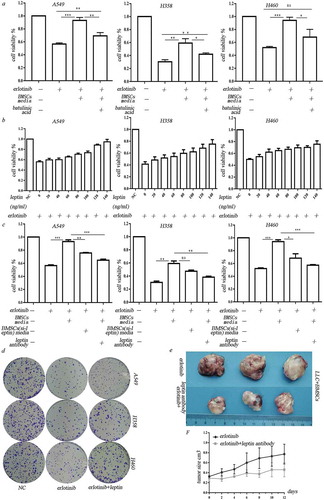
We then examined the effect of adipocyte-associated cytokines on hypoxic BMSC-mediated erlotinib resistance. Betulinic acid, which is the inhibitor for de novo lipogenesis, was added in culture media before the BMSCs were put in hypoxic chamber. Three days after hypoxic treatment, the hypoxic-conditioned media were collected and added to lung cancer cells. Compared to the normal hypoxic-conditioned media, the hypoxic-conditioned media from above impaired adipogenic BMSCs could decrease cell viability of hypoxic BMSC-induced erlotinib resistant cells. It demonstrated that hypoxia induces erlotinib resistance through adipocyte-associated molecules secreted from BMSCs ()). As shown in ), among these adipocyte-associated cytokines, leptin is one of the most abundant adipokines secreted from hypoxic BMSCs. We treated the lung cancer cells with leptin at different dose in the presence of erlotinib for 3 days. We found that leptin increased cancer cell growth in a dose-dependent manner after treatment of erlotinib ()). The clonogenic potential of erlotinib-treated cells was increased after exposed to leptin ()). Transfection of leptin-siRNAs which block the expression of leptin in BMSCs or addition of leptin neutralizing antibody before treatment of hypoxia inhibited growth of erlotinib-treated lung cancer cells ()). These results revealed that leptin secreted by hypoxic BMSCs caused the resistance of lung cancer cells to erlotinib. We then used LLC syngeneic model to assess the in vivo effect of leptin on erlotinib resistance. The tumor-bearing mice with co-injection of LLC and BMSCs were treated with erlotinib with or without leptin neutralizing antibody. The inhibition of leptin with neutralizing antibody sensitized lung cancer cells to erlotinib, confirming the roles of leptin on the erlotinib treatment (,)).
Figure 3. Leptin mediated erlotinib resistance in lung cancer cells. (a) Treatment of leptin increased erlotinib resistance in lung cancer cell A549, H358 and H460. Betulinic acid which inhibits lipogenesis reverses the erlotinib resistance mediated by leptin.(b) Leptin increased cancer cell growth in a dose-dependent manner after treatment of erlotinib.CCK-8 cell viability assay was performed to evaluate cell viability after treatment of erlotinib. Results are presented as the median of three independent experiments (*p < .05, **p < .01, Student’s t test). (c) Treatment of leptin increased clonogenic potential after treatment of erlotinib. (d) Transfection of leptin-siRNAs which block the expression of leptin in BMSCs or addition of leptin neutralizing antibody before treatment of hypoxia enhanced erlotinib-induced cytotoxicity in lung cancer cells. Results are presented as the median of three independent experiments (*p < .05, **p < .01, Student’s t test).(e) Leptin promoted erlotinib resistance in syngeneic mouse lung cancer model. The tumor-bearing mice with co-injection of LLC and BMSCs were treated with erlotinib with or without leptin antibody. The inhibition of leptin with neutralizing antibody sensitized lung cancer cells to erlotinib. Tumors excised from the mice are shown. (f) Tumor growth curve presenting in tumor volume. Each bar represents the mean tumor volume with 95% confidence intervals. Tumors were measured every 2 days. Results are presented as the median of three independent experiments (*p < .05, **p < .01, Student’s t test).
Leptin increases erlotinib resistance in lung cancer cells by activating IGF-1R signaling in the absence of IGF-1 in hypoxia
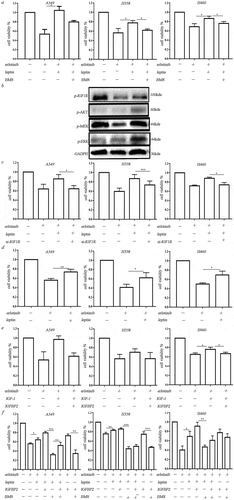
As the IGF-1 was downregulated and IGFBPs were upregulated in the hypoxic BMSCs, we then examine the effect of IGF-1R signaling on the hypoxic BMSCs mediated erlotinib resistance. We found that IGF-1R inhibitor BMS-754807 could significantly inhibit the leptin-induced growth of erlotinib-treated cells ()). Leptin-induced IGF-1R phosphorylation and activated downstream MEK/ERK and AKT signaling ()). Transfection of IGF-1R-siRNA in lung cancer cells inhibited leptin-induced growth of erlotinib-treated cells ()). It demonstrated that leptin induces erlotinib resistance by activating IGF-1R signaling. Addition of leptin alone could increase the growth of erlotinib-treated lung cancer cells in the absence of IGF-1, suggesting that leptin-induced IGF-1R phosphorylation is IGF-1 independent ()). The opposite expression of IGFBP2 and IGF-1 in hypoxic BMSCs suggested the negative regulation. We treated cells with IGF-1 with or without IGFBP2. IGFBP2 could counteract the effect of IGF-1 on the erlotinib resistance, indicating that lack of IGF-1 could be the result of highly expressed IGFBP2 ()). On the other hand, IGFBP2 alone obviously promote the growth of erlotinib-treated lung cancer cell. BMS-754807 which inhibits IGF-1R reversed the erlotinib resistance mediated by IGFBP2. IGFBP2 had synergistic effect with leptin to induce erlotinib resistance in lung cancer cells ()).
Figure 4. Leptin increased erlotinib resistance in lung cancer cells by activating IGF-1R signaling in hypoxia. (a) IGF-1R inhibitor BMS-754807 could significantly reverse the erlotinib resistance mediated by leptin. (b) Western blot analysis of IGF-1R phosphorylation and downstream MEK/ERK and AKT signaling induced by leptin. (c) Transfection of IGF-1R-siRNA in lung cancer cells before treatment of leptin resulted in the sensitization of lung cancer cells to erlotinib. (d) Leptin increased the growth of erlotinib-treated lung cancer cells in the absence of IGF-1. (e) IGFBP2 could counteract the effect of IGF-1 on the erlotinib resistance. (f) IGFBP2 promoted the lung cancer cell growth after treatment of erlotinib in IGF-1 independent through activating IGF-1R signaling. CCK-8 cell viability assay was performed to evaluate cell viability after treatment of erlotinib. Results are presented as the median of three independent experiments (*p < .05, **p < .01, Student’s t test).
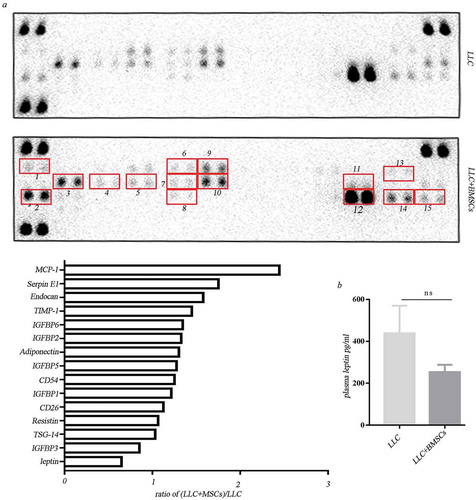
Leptin exerts function locally but not systemically
We further investigated if the adipokines derived from BMSCs are secreted into systemic circulation and exert systemic function. Antibody array assay revealed that compared to the serum from mice receiving LLC injection alone, adipokines including IGFBPs, leptin in circulation were not obviously upregulated in the serum from mice receiving mixture injection of LLC and BMSCs ()). Plasma leptin was measured using mice leptin ELISA and did not show obvious difference between the LLC injection alone and the co-injection with LLC and BMSCs ()).
Figure 5. Leptin exerted function locally but not systemically. (a) Adipokine array profiling. Determination of expression was based on a comparison of the captured antibody of interest to the positive controls. The signals were captured and the intensity of the dots was quantified using a Bio-Rad ChemiDoc XRS system (Bio-Rad, CA, USA). The resulting images were analyzed using Image J to measure the expression of various targets. A positive control was used to normalize the results from the different membranes being compared. To compare the signal intensities, the relative expression levels are shown below. 1. Adiponectin; 2. CD26/DPP4; 3. Endocan; 4.CD54; 5.IGFBP-1; 6.IGFBP-2; 7. IGFBP-5; 8.TSG-14; 9. IGFBP-3; 10. IGFBP-6; 11. Leptin; 12. Resistin; 13. MCP-1; 14. SerpinE; 15. TIMP-1. (b) Elisa analysis of plasma leptin in mice receiving LLC injection alone or the co-injection with LLC and MSCs.
Discussion
The present work aims at a better understanding of the roles of cancer microenvironment on the cancer therapeutic resistance. We found that BMSCs contribute to erlotinib resistance in lung cancer cells through leptin-induced activation of IGF-1R signaling in hypoxia.
Many mechanisms of EGFR-TKIs acquired resistance have been identified. Development of T790M is detected in a small percentage of EGFR-mutant lung cancer, which confers the resistance to EGFR-TKIs.Citation19,Citation20 The T790M mutation may be de novo or acquired following first-line treatment of the first generation of EGFR-TKI such as gefitinib and erlotinib.Citation21 Mutations of KRAS also confer resistance to EGFR-TKIs. KRAS mutations and EGFR mutations are mutually exclusive. A549 and H358 that carry KRAS G12V mutation respond differently to EGFR-TKIs. Most commonly, the acquired resistance is associated with the activation of bypass track signaling through mechanisms independent of the original drug target.Citation20,Citation22 Amplification of the MET gene or overexpression of its ligand hepatic growth factor (HGF) and following activation of PI3K/AKT and MEK/ERK signaling promote the resistance to EGFR-TKIs.Citation23RAS related GTPase RHOB confers EGFR-TKI resistance via AKT activation.Citation24 IGF-1R activation was reported to promote resistance to gefitinib in EGFR-activating-mutant cancer cells.Citation20,Citation25
The evidence of a link between obesity and cancer is growing.Citation26 Adipokines and hormones generated by adipocytes are involved in the cancer progression. The diminution of chemotherapeutic efficacy in obese cancer patients is attributed to multiple factors.Citation27 The insulin and insulin-like growth factor 1 (IGF-1) are considered to be linked to obesity and cancer. Increased level of insulin activates insulin-IGF pathway, reducing IGFBPs and therefore increasing the level of IGF-1.Citation28 Approximately 98% of IGF-1 is bound to one of the six IGFBPs. The serum IGF-1 is found to predominantly form complex with IGFBP-3 and acid-labile subunit.Citation29 It was reported that EGFR-TKI resistant cells exhibited markedly reduced IGFBP-3 and IGFBP-4 RNA. Loss of IGFBP3, IGFBP4 mediates resistance to EGFR-TKI.Citation25 IGFBP2 is a member of IGFBPs family that circulates or resides locally in the extracellular space, suggesting that IGFBP2 exerts local and systemic functions.Citation30IGFBP-2 can prevent IGF-1 binding to its receptor.Citation31,Citation32 In the present study, the reduced level of IGF-1 in the hypoxic BMSC and tumor biopsies may be because of the increased level of IGFBPs. Unlike other IGFBPs, IGFBP2 exerts function via both IGF-dependent and IGF-independent mechanism.Citation33 Low IGFBP2 level caused a better response to IGF-1R1-targeted therapy.Citation34 In our study, in the hypoxic cancer microenvironment, adipokine leptin secreted by BMSCs promoted erlotinib resistance in lung cancer cells through activating IGF-1R signaling. IGFBP2 attenuated the effect of IGF-1 and promoted the effect of leptin on erlotinib resistance. The downregulated expression of IGF-1 in BMSCs in hypoxic cancer microenvironment may also be partially due to hypoxia-mediated glycolysis of BMSCs. The high level of glycolysis causes high rates of glucose uptake. The resulting low glucose in the cancer microenvironment may downregulate the expression of IGF-1. The activation of IGF-1R is considered to be the result of high level of leptin and IGFBP2 in this study. Inhibition of IGF-1R with BMS754807 reversed erlotinib resistance caused by leptin and IGFBP2. In our study, IGFBP2 counteracted the effect of IGF-1, however, had synergistic but local effect with leptin to promote erlotinib resistance in lung cancer cells.
Materials and methods
Reagents
Erlotinib (OSI-744) and IGF-1R inhibitor BMS-754807 were purchased from Selleck Chemicals (Houston, TX, USA). Erlotinib was dissolved in dimethylsulfoxide (Sigma-Aldrich, Saint Louis, MO, USA). Human IGF-1 (Cat#100-11) and human leptin (300–27) were from Peprotech, USA. Recombinant human IGFBP2 Protein (ab6322) and recombinant human IGFBP2 Protein (ab6322) were purchased from Abcam, USA. Beaulinic Acid (B8936) was obtained from Sigma (Saint Louis, MO, USA). Human and mouse leptin neutralizing antibody were purchased from R&D (MAB398, RD Inc, MN, USA). Human IGF1R si-RNA and leptin si-RNA were designed and synthesized by RIBOBIO (Guangzhou, China).
Cells
NSCLC cell lines including H358, A549, H460 and murine lewis lung carcinoma cells (LLC) were cultured in RPMI-1640 medium supplemented with penicillin G (100 U/mL), streptomycin (100 mg/mL) and 10% fetal calf serum. Cells were grown at 37°C in a humidified atmosphere of 5% CO2 and were routinely sub-cultured using 0.25% (w/v) trypsin-EDTA solution. Human BMSCs were obtained from BM aspirates of non-hematological malignant tumor patients. Samples were from Xiangya Hospital, Central South University, China. The patients were informed about the sample collection and have signed informed consent forms. Collections and use of tissue samples were approved by the ethical review committees of Xiangya Hospital. BMSCs are monolayer cultured in Medium For Human Mesenchymal Stem Cells (HUXMA-03011-440, cyagen). For hypoxia induction, BMSCs were incubated in 0.2% oxygen concentration, 37°C temperature, 5% CO2 concentration, 90% humidity in Hypoxic Workstation (Don Whitley, UK). Cells were lysed for extraction of protein and RNA in the workstation to avoid reoxygenation.
Cell viability assessment
The proliferation of lung cancer cells was measured using a Cell Counting Kit-8 (CCK-8) colorimetric assay (CK04, Dojindo, Japan). Twenty-four hours before treatment, lung cancer cells were seeded at a density of 4 × 10³ cells/well in 96-well plates. Then, the cells were treated with erlotinib and other reagents for 3 days. After treatment, the culture medium was removed and the cells were briefly washed for three times in PBS. 10μL of CCK-8 dye and 100μL of α-MEM cell culture medium were added to each well, and the cells were incubated for another 3 h at 37°C. The absorbance at 450nm was measured by a Varioskan Flash instrument (Thermo Scientific, USA). The experiment was repeated three times and six parallel samples were measured each time. The results are presented as the mean ± SD. A value of p < .05 was considered to be statistically significant.
Clonogenic assay
For evaluation of clonogenic ability, the colony formation assay was performed. A549 cells were treated with corresponding reagents. Cells were washed twice with PBS, harvested and reseeded at a density of 500 cells/well in 6-well plates. After 12 days, colonies were fixed with 4% paraformaldehyde, followed by staining with 0.1% crystal violet. The plates were photographed, and the number of colonies was counted.
Western blotting
The protein lysate used for western blotting was extracted using RIPA buffer (Biotime, Hangzhou, China) containing protease inhibitors (Roche, Basel, Switzerland). Proteins were quantified using the BCATM Protein Assay Kit (Pierce, USA). A western blot system was set up using a Bio-Rad Bis-Tris Gel system, according to the manufacturer’s instructions (Bio-Rad, CA, USA). The cell protein lysates were separated on 10% SDS-polyacrylamide gels and electrophoretically transferred to polyvinylidene difluoride membranes (Millipore, Danvers, MA, USA). The primary antibody solution was prepared in 5% blocking buffer. Primary antibodies against leptin (ab16227, Abcam, USA), IGF-1 (20214-1-AP, Proteintech, Chicago, USA), p-IGF-1R (3024, Cell Signaling Technology, Danvers, MA), p-AKT (4060, Cell Signaling Technology, Danvers, MA), p-ERK (T1289, Abcam, USA), p-MEK1/2 (3958, Cell Signaling Technology, Danvers, MA) were incubated with the membrane at 4°C overnight, followed by a brief wash and incubation with secondary antibody for 1 h at room temperature. An anti-GAPDH antibody control was purchased from Proteintech (Chicago, USA) and was used as a loading control. Finally, a 40:1 solution of peroxide and luminol was added to cover the blot surface for 5 min at room temperature. The chemiluminescent signals were captured, and the intensity of the bands was quantified using a Bio-Rad ChemiDoc XRS system (Bio-Rad, CA, USA).
Animal experiments
Four-week-old male C57BL/6 mice were used to examine allograft tumor growth. Animal experiments were conducted following protocols approved by Central South University, China. Murine Lewis Lung Cancer cells LLC with or without murine MSCs were injected subcutaneously into syngeneic C57BL/6 mice. When the mean tumor volume reached 300–350 mm3, the mice were orally administrated with erlotinib at a dose of 50mg/kg. The animals were examined at different time points after the injection by measuring the size of subcutaneous tumors. The tumors were measured daily using calipers, and their volumes were calculated using the following standard formula: length x width2x 0.5.
Human adipokine array
To investigate the secreted molecules from hypoxic MSCs, the ProteiomeProfilerTMArray Human Adipokine Array Kit (ARY024, R&D Inc, MN, USA) was used according to the manual. Briefly, 3 days after treatment in hypoxic chamber which was set to 0.2% oxygen, media from human BMSCs were collected. Before hybridization, 1 mL of Blocking Buffer was added to the membranes, which were incubated at room temperature with gentle shaking for 1 h. After removing the Blocking Buffer from each container, the above media was added to each array membrane and incubated at 2-8°C overnight. After incubation, the containers were then placed on a shaker and washed three times with 1X Wash Buffer at room temperature. 2 mL of diluted Streptavidin-HRP was then added to each membrane and incubated at room temperature with gentle shaking for 2 h. Finally, the prepared Chemi Reagent Mix was pipetted onto each membrane. The chemiluminescent signals were captured, and the intensity of the dots was quantified using a Bio-Rad ChemiDoc XRS system (Bio-Rad, CA, USA). The resulting images were analyzed using Image J to measure the expression levels of the various targets. A positive control was used to normalize the results from the different membranes being compared.
Immunohistochemistry (IHC) and immunofluorescence (IF)
The established allograft tumors were fixed and embedded in paraffin wax. 4 μm-thick paraffin sections were dewaxed and followed by hydration. The slides were dipped into antigen retrieval buffer (0.01 M citrate buffer, pH 6.0) followed by microwave heating for 5 min. Tissue sections were rinsed with 0.01 M phosphate-buffered saline, pH 7.4 (PBS) and incubated with primary antibody (leptin 1:50 dilution, Abcam, USA) at 4°C overnight in a humidified chamber. After extensive washing with PBS, sections were incubated with biotin-linked goat anti-rabbit IgG antibodies (UltraSensitive S-P Kit, Maixin Biotechnology Company, Fuzhou, China). The sections were then washed and followed by developing in 3ʹ-diaminobenzidine hydrochloride (DAB) as chromogen, and sections were counterstained with hematoxylin. Finally, after dehydration and mounting, the sections were observed and imaged under microscope (OLYMPUS BX-51, Japan).
For immunofluorescence assay for ki67, mice subcutaneous tumor tissue sections of 4-um thickness were dewaxed in xylene and rehydrated in a series of ethanol with a reduced concentration gradient. The slides were dipped into antigen retrieval buffer (0.01 M citrate buffer, pH 6.0). After that, the slides were treated with 3% of H2O2 at room temperature for 10 min to block endogenous peroxisome, then followed by incubation with 5% normal rabbit serum for 20 min. The tissue sections were incubated with primary antibodies to Ki67 antibody (1:200, CY5542, Abways Technology, China) at 4°C overnight in a humid chamber. Following recovery temperature at 37°C, these sections were incubated with fluorescent secondary antibodies to Fluorescein (FITC)–conjugated Affinipure Goat Anti-Rabbit IgG (H + L) (1:200, SA00003-2, Proteintech) at 37°C for 1 h avoiding the light. DAPI solution (1:1000) was added and incubated at room temperature for 20 min. The slides were observed and photographed under a fluorescence microscope (OLYMPUS BX-51, Japan).
ELISA
Whole blood was collected from mice into commercially available EDTA-treated (lavender tops) anticoagulant-treated tubes. Cells are removed from plasma by centrifugation for 10 min at 1,800 g using a refrigerated centrifuge. The supernatant was collected and stored at −80°C to avoid repeated freezing and thawing. Plasma leptin was measured using specific enzyme-linked immunosorbent assay kit (EMD Millipore Corporation, Billerica, MA, USA) according to the manufacturer’ s instruction. Plasma samples were diluted ten times with Wash Buffer and then added to a 96-well plate that had been covered with Assay Buffer. Cover the plate with plate sealer and incubate at room temperature for 2 h on an orbital microtiter plate shaker set to rotate at a moderate speed of 400 to 500 rpm. After three times of washing with diluted Wash Buffer, add 100 µl Detection Antibody to each well incubating followed by shaking at room temperature for 1 h. Enzyme Solution was added and incubated for 30 min. Finally, the substrate solution was added to each well and incubated for 2–5 min at room temperature. With the addition of stop solution, the color of liquid changed from blue to yellow after acidification. The absorbance at 450 nm was measured by a Varioskan Flash instrument (Thermo Scientific, USA). Leptin concentration was calculated according to the standard curve.
Electric transfection/transfection
BMSCs were digested with trypsin and counted with a cell counter (TC20, Bio-RAD) 1x10⁵ BMSCs were collected by centrifugal precipitation and re-suspended with 90 μl of opti-MEM. Then 10 μl of leptin si-RNA (100 nM) was added to the cells and evenly mixed. The mixture was transferred to the electroporation cuvettes (EC-002S, NEPA GENE, Japan) which was set to be 220V, 5mA, 5s. The cells were subsequently cultured in a hypoxic station (whitley H35 hypoxystation) with 0.2% oxygen and 37°C for 3 days.
Statistical analysis
Data are presented as the mean ± S.D. from at least three separate experiments. Statistical analyses were performed using GraphPad Prism 5 (GraphPad Software, Inc., CA, USA). Multiple group comparisons were performed using ANOVA with a post hoc test for the subsequent individual group comparisons. A p value of less than 0.05 was considered to be significant.
Additional information
Funding
Referance
- Emlet DR, Brown KA, Kociban DL, Pollice AA, Smith CA, Ong BB, Shackney SE. 2007. Response to trastuzumab, erlotinib, and bevacizumab, alone and in combination, is correlated with the level of human epidermal growth factor receptor-2 expression in human breast cancer cell lines. Mol Cancer Ther. 6(10):2664–2674. doi:10.1158/1535-7163.MCT-07-0079.
- Lee VH, Tin VP, Choy TS, Lam KO, Choi CW, Chung LP, Tsang JW, Ho PP, Leung DK, Ma ES, et al. 2013. Association of exon 19 and 21 EGFR mutation patterns with treatment outcome after first-line tyrosine kinase inhibitor in metastatic non-small-cell lung cancer. J Thorac Oncol. 8(9):1148–1155. doi:10.1097/JTO.0b013e31829f684a.
- Shepherd FA, Rodrigues Pereira J, Ciuleanu T, Tan EH, Hirsh V, Thongprasert S, Campos D, Maoleekoonpiroj S, Smylie M, Martins R, et al. 2005. Erlotinib in previously treated non-small-cell lung cancer. N Engl J Med. 353(2):123–132. doi:10.1056/NEJMoa050753.
- Ciuleanu T, Stelmakh L, Cicenas S, Miliauskas S, Grigorescu AC, Hillenbach C, Johannsdottir HK, Klughammer B, Gonzalez EE. 2012. Efficacy and safety of erlotinib versus chemotherapy in second-line treatment of patients with advanced, non-small-cell lung cancer with poor prognosis (TITAN): a randomised multicentre, open-label, phase 3 study. Lancet Oncol. 13(3):300–308. doi:10.1016/S1470-2045(11)70385-0.
- Cappuzzo F, Ciuleanu T, Stelmakh L, Cicenas S, Szczesna A, Juhasz E, Esteban E, Molinier O, Brugger W, Melezinek I, et al. 2010. Erlotinib as maintenance treatment in advanced non-small-cell lung cancer: a multicentre, randomised, placebo-controlled phase 3 study. Lancet Oncol. 11(6):521–529. doi:10.1016/S1470-2045(10)70112-1.
- Karam I, Melosky B. 2012. Response to second-line erlotinib in an EGFR mutation-negative patient with non-small-cell lung cancer: make no assumptions. Curr Oncol. 19(1):42–46. doi:10.3747/co.19.949.
- Mok TS, Wu YL, Thongprasert S, Yang CH, Chu DT, Saijo N, Sunpaweravong P, Han B, Margono B, Ichinose Y, et al. 2009. Gefitinib or carboplatin-paclitaxel in pulmonary adenocarcinoma. N Engl J Med. 361(10):947–957. doi:10.1056/NEJMoa0810699.
- Lee JK, Shin JY, Kim S, Lee S, Park C, Kim JY, Koh Y, Keam B, Min HS, Kim TM, et al. 2013. Primary resistance to epidermal growth factor receptor (EGFR) tyrosine kinase inhibitors (TKIs) in patients with non-small-cell lung cancer harboring TKI-sensitive EGFR mutations: an exploratory study. Ann Oncol. 24(8):2080–2087. doi:10.1093/annonc/mdt127.
- Remon J, Moran T, Majem M, Reguart N, Dalmau E, Marquez-Medina D, Lianes P. 2014. Acquired resistance to epidermal growth factor receptor tyrosine kinase inhibitors in EGFR-mutant non-small cell lung cancer: a new era begins. Cancer Treat Rev. 40(1):93–101. doi:10.1016/j.ctrv.2013.06.002.
- Filosto S, Baston DS, Chung S, Becker CR, Goldkorn T. 2013. Src mediates cigarette smoke-induced resistance to tyrosine kinase inhibitors in NSCLC cells. Mol Cancer Ther. 12(8):1579–1590. doi:10.1158/1535-7163.MCT-12-1029.
- Salem A, Asselin MC, Reymen B, Jackson A, Lambin P, West CML, O’Connor JPB, Faivre-Finn C. 2018. Targeting hypoxia to improve non-small cell lung cancer outcome. J Natl Cancer Inst. 2018;110(1):14–30.
- Murakami A, Takahashi F, Nurwidya F, Kobayashi I, Minakata K, Hashimoto M, Nara T, Kato M, Tajima K, Shimada N, et al. 2014. Hypoxia increases gefitinib-resistant lung cancer stem cells through the activation of insulin-like growth factor 1 receptor. PLoS One. 9(1):e86459. doi:10.1371/journal.pone.0086459.
- Klopp AH, Spaeth EL, Dembinski JL, Woodward WA, Munshi A, Meyn RE, Cox JD, Andreeff M, Marini FC. 2007. Tumor irradiation increases the recruitment of circulating mesenchymal stem cells into the tumor microenvironment. Cancer Res. 67(24):11687–11695. doi:10.1158/0008-5472.CAN-07-1406.
- Hsu SH, Chen CT, Wei YH. 2013. Inhibitory effects of hypoxia on metabolic switch and osteogenic differentiation of human mesenchymal stem cells. Stem Cells. 31(12):2779–2788. doi:10.1002/stem.1441.
- Jaramillo ML, Banville M, Collins C, Paul-Roc B, Bourget L, O’Connor-McCourt M. 2008. Differential sensitivity of A549 non-small lung carcinoma cell responses to epidermal growth factor receptor pathway inhibitors. Cancer Biol Ther. 7(4):557–568. doi:10.4161/cbt.7.4.5533.
- Chow DC, Wenning LA, Miller WM, Papoutsakis ET. 2001. Modeling pO(2) distributions in the bone marrow hematopoietic compartment. II. Modified Kroghian models. Biophys J. 81(2):685–696. doi:10.1016/S0006-3495(01)75733-5.
- Hockel M, Vaupel P. 2001. Tumor hypoxia: definitions and current clinical, biologic, and molecular aspects. J Natl Cancer Inst. 93(4):266–276. doi:10.1093/jnci/93.4.266.
- Jiang C, Sun J, Dai Y, Cao P, Zhang L, Peng S, Zhou Y, Li G, Tang J, Xiang J. 2015. HIF-1A and C/EBPs transcriptionally regulate adipogenic differentiation of bone marrow-derived MSCs in hypoxia. Stem Cell Res Ther. 6:21.
- Kwak EL, Sordella R, Bell DW, Godin-Heymann N, Okimoto RA, Brannigan BW, Harris PL, Driscoll DR, Fidias P, Lynch TJ, et al. 2005. Irreversible inhibitors of the EGF receptor may circumvent acquired resistance to gefitinib. Proc Natl Acad Sci U S A. 102(21):7665–7670. doi:10.1073/pnas.0502860102.
- Niederst MJ, Engelman JA. 2013. Bypass mechanisms of resistance to receptor tyrosine kinase inhibition in lung cancer. Sci Signal. 6(294):re6. doi:10.1126/scisignal.2004652.
- Tanaka K, Nosaki K, Otsubo K, Azuma K, Sakata S, Ouchi H, Morinaga R, Wataya H, Fujii A, Nakagaki N, et al. 2017. Acquisition of the T790M resistance mutation during afatinib treatment in EGFR tyrosine kinase inhibitor-naive patients with non-small cell lung cancer harboring EGFR mutations. Oncotarget. 8(40):68123–68130. doi:10.18632/oncotarget.19243.
- Alexander PB, Wang XF. 2015. Resistance to receptor tyrosine kinase inhibition in cancer: molecular mechanisms and therapeutic strategies. Front Med. 9(2):134–138. doi:10.1007/s11684-015-0396-9.
- Turke AB, Zejnullahu K, Wu YL, Song Y, Dias-Santagata D, Lifshits E, Toschi L, Rogers A, Mok T, Sequist L, et al. 2010. Preexistence and clonal selection of MET amplification in EGFR mutant NSCLC. Cancer Cell. 17(1):77–88. doi:10.1016/j.ccr.2009.11.022.
- Calvayrac O, Mazieres J, Figarol S, Marty-Detraves C, Raymond-Letron I, Bousquet E, Farella M, Clermont-Taranchon E, Milia J, Rouquette I, et al. 2017. The RAS-related GTPase RHOB confers resistance to EGFR-tyrosine kinase inhibitors in non-small-cell lung cancer via an AKT-dependent mechanism. EMBO Mol Med. 9(2):238–250. doi:10.15252/emmm.201606646.
- Guix M, Faber AC, Wang SE, Olivares MG, Song Y, Qu S, Rinehart C, Seidel B, Yee D, Arteaga CL, et al. 2008. Acquired resistance to EGFR tyrosine kinase inhibitors in cancer cells is mediated by loss of IGF-binding proteins. J Clin Invest. 118(7):2609–2619. doi:10.1172/JCI34588.
- Basen-Engquist K, Chang M. 2011. Obesity and cancer risk: recent review and evidence. Curr Oncol Rep. 13(1):71–76. doi:10.1007/s11912-010-0139-7.
- Lashinger LM, Rossi EL, Hursting SD. 2014. Obesity and resistance to cancer chemotherapy: interacting roles of inflammation and metabolic dysregulation. Clin Pharmacol Ther. 96(4):458–463. doi:10.1038/clpt.2014.136.
- Roberts DL, Dive C, Renehan AG. 2010. Biological mechanisms linking obesity and cancer risk: new perspectives. Annu Rev Med. 61::301–316. doi:10.1146/annurev.med.080708.082713.
- Laursen T, Flyvbjerg A, Jorgensen JO, Baxter RC, Christiansen JS. 2000. Stimulation of the 150-kilodalton insulin-like growth factor-binding protein-3 ternary complex by continuous and pulsatile patterns of growth hormone (GH) administration in GH-deficient patients. J Clin Endocrinol Metab. 85(11):4310–4314. doi:10.1210/jcem.85.11.6957.
- Ferry RJ Jr., Cerri RW, Cohen P. 1999. Insulin-like growth factor binding proteins: new proteins, new functions. Horm Res. 51(2):53–67. doi:10.1159/000023315.
- Shen X, Xi G, Maile LA, Wai C, Rosen CJ, Clemmons DR. 2012. Insulin-like growth factor (IGF) binding protein 2 functions coordinately with receptor protein tyrosine phosphatase beta and the IGF-I receptor to regulate IGF-I-stimulated signaling. Mol Cell Biol. 32(20):4116–4130. doi:10.1128/MCB.01011-12.
- Kiepe D, Ulinski T, Powell DR, Durham SK, Mehls O, Tonshoff B. 2002. Differential effects of insulin-like growth factor binding proteins-1, −2, −3, and −6 on cultured growth plate chondrocytes. Kidney Int. 62(5):1591–1600. doi:10.1046/j.1523-1755.2002.00603.x.
- Frommer KW, Reichenmiller K, Schutt BS, Hoeflich A, Ranke MB, Dodt G, Elmlinger MW. 2006. IGF-independent effects of IGFBP-2 on the human breast cancer cell line Hs578T. J Mol Endocrinol. 37(1):13–23. doi:10.1677/jme.1.01955.
- McCaffery I, Tudor Y, Deng H, Tang R, Suzuki S, Badola S, Kindler HL, Fuchs CS, Loh E, Patterson SD, et al. 2013. Putative predictive biomarkers of survival in patients with metastatic pancreatic adenocarcinoma treated with gemcitabine and ganitumab, an IGF1R inhibitor. Clin Cancer Res. 19(15):4282–4289. doi:10.1158/1078-0432.CCR-12-1840.