
ABSTRACT
The objective of this study was to examine the clinical significance of EZH2 expression and the therapeutic efficacy of its silencing in endometrial cancer. EZH2 expression in clinical samples was evaluated using a tissue microarray and correlated with clinical outcomes. The biological roles of EZH2 were assayed in vitro and in vivo. Gene expression was examined to reveal the molecular mechanism underlying the roles of EZH2 in endometrial cancer. We found that EZH2 overexpression was significantly correlated with disease-free and overall survival of patients with endometrial cancer. EZH2 silencing resulted in decreased cell viability and invasiveness, and increased apoptosis. In addition, EZH2 silencing enhanced the cytotoxicity of taxanes and cisplatin in Hec-1A and Ishikawa endometrial cancer cells. EZH2 silencing using small-interfering RNA (siRNA) incorporated into chitosan nanoparticles (siRNA/CN) induced a significant anti-tumor effect compared with that observed in controls (66.6% reduction in Hec-1A cells and 63.2% reduction in Ishikawa cells, p < .05 for both). Moreover, EZH2 siRNA/CN in combination with taxanes produced more robust anti-tumor effects versus those induced by monotherapies (77.0% for Hec-1A cells and 57.7% for Ishikawa cells, p < .05 for both). These results were associated with decreased angiogenesis and cell proliferation, and enhanced apoptosis. Genomic analyses revealed that EZH2 silencing decreased the expression levels of many genes associated with tumor growth, including PRDX6. Collectively, these results support EZH2 as an attractive target for the therapeutic management of endometrial cancer.
Introduction
Endometrial cancer is the most frequent gynecologic cancer in North America.Citation1 The overall prognosis for women with endometrial cancer is excellent; however, most patients are diagnosed at an early stage, and those with recurrent or advanced-stage disease have a much poorer clinical outcome.Citation2 Salvage treatments such as hormonal agents or cytotoxic chemotherapy, which provide short-term remission, represent the typical treatment strategy for endometrial cancer.Citation3 Thus, the development of newer and more effective therapies remains necessary.
Enhancer of zeste homolog 2 (EZH2), an important constituent of polycomb repressive complex 2 histone methyltransferase complex, regulates transcription via chromatin remodeling, nucleotide modification, and reciprocal action with other transcription factors. Dysregulated EZH2 expression may cause dysfunction of critical genes related to the G2/M transition.Citation4 Given that EZH2 expression is increased in tumors and associated endothelial cells, this protein is considered an important candidate for targeted therapy in several malignancies, including breast,Citation5 bladder,Citation6 prostate,Citation7 and gastricCitation8 cancers. However, the role of EZH2 in endometrial cancer remains unclear. Therefore, the objective of this study was to examine the clinical and biological significance of EZH2 in endometrial cancer. In addition, we aimed to determine the therapeutic efficacy of EZH2 silencing, as well as the mechanism mediating the effect of EZH2 knockdown on tumor growth.
Results
Clinical significance of EZH2 expression in human endometrial cancer
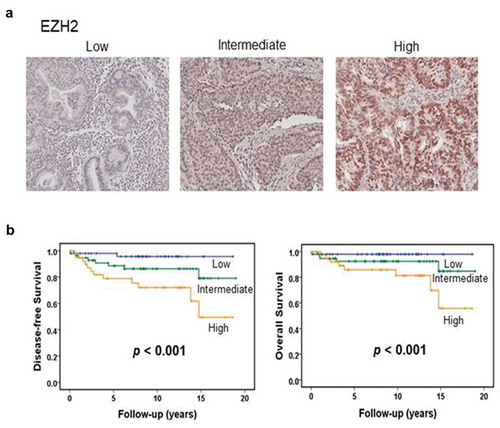
A total of 150 samples of endometrial cancer tissue were included in the present analysis. Non-endometrioid histologic types including clear cell carcinoma, serous carcinoma, and carcinosarcoma were excluded because only a limited number of samples were available. The age of patients ranged from 30 to 75 years, with a mean age of 52.4 years. Of 150 endometrioid carcinomas, 90 were FIGO grade 1, 34 were grade 2, and 26 were grade 3. EZH2 expression was associated with FIGO grade, recurrence, and death due to disease (Supplementary Table 1). Survival analysis revealed that the EZH2 expression level was related to disease-free and overall survival ().
Figure 1. EZH2 expression in human endometrial cancers. (a) Representative image of human endometrial cancer with low, intermediate, or high EZH2 expression based on immunohistochemical staining. (b) Kaplan-Meier survival curve for endometrial carcinomas patients with low, intermediate, or high level of EZH2. Log-rank test was used to compare differences among the three groups. Increased EZH2 expression was significantly associated with decreased overall survival and disease-free survival (p < .001 for both).
In vitro effects of EZH2 knockdown
EZH2 expression was examined in various endometrial cancer cell lines (Supplementary Figure S1A). Among these, Ishikawa and Hec-1A cells had higher levels of EZH2 expression. EZH2 expression was relatively low in KLE cells. Decreased EZH2 protein expression was observed for up to 5 days after siRNA treatment (representative figure shown in Supplementary Figure S1B).
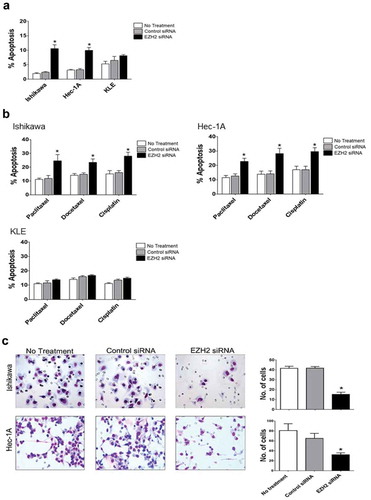
Next, we evaluated the effect of EZH2 knockdown on cell viability, with or without chemotherapeutic drugs commonly used to treat uterine cancer. EZH2 silencing significantly (p < .05) increased the cytotoxicity of paclitaxel, docetaxel, and cisplatin in Ishikawa and Hec-1A cells compared with that in untreated or control siRNA-treated cells, but not in KLE cells with low endogenous EZH2 expression ()). A clonogenic assay confirmed the longer-term impact on cell survival and the synergistic effect (combination index [CI] < 1) of chemotherapeutic drugs and EZH2 silencing as well as their individual effects on Ishikawa and Hec-1A but not KLE cells ()). A significant (p < .05) increase in apoptosis occurred in Hec-1A and Ishikawa cells transfected with EZH2 siRNA alone ()) or in combination with chemotherapy, but not in KLE cells ()). These results were consistent with the results of the cell-viability assay. A significant (p < .05) decrease in invasion ability was observed in Ishikawa and Hec-1A cells after EZH2 knockdown, compared with that of parental cells or control siRNA-transfected cells ()).
Figure 2. In vitro effect of EZH2 silencing combined with chemotherapy on cell viability. (a), MTT cell viability assay of Ishikawa, Hec-1A, and KLE cells. Cell viability was assessed at 72 hours after chemotherapy (b), Clonogenic assay of Ishikawa, Hec-1A, and KLE cells. After the siRNA transfection, cells were treated with chemotherapy for 48 yours. Number of colonies were evaluated 7–14 days later. Δ indicates a synergistic effect of chemotherapy and EZH2 silencing (CI < 1). Error bars represented SEM; *, p < .05.
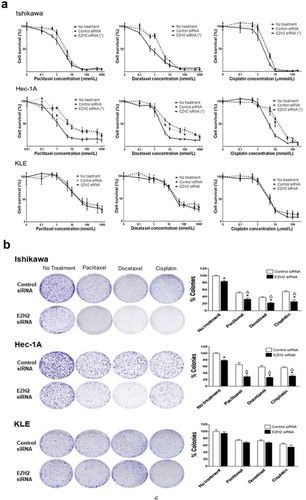
Figure 3. Effects of EZH2 silencing on tumor cell apoptosis and cell invasion in vitro. The apoptotic rate after EZH2 siRNA treatment alone (a) or in combination with cytotoxic chemotherapy (b) on Ishikawa, Hec-1A, and KLE cells. Apoptosis was measured by determining the percentage of PE Annexin V/7-AAD positive cell at 72 hours after treatment. (c) The number of cells invaded after EZH2 silencing on Ishikawa and Hec-1A cells. Error bars represented SEM; *, p < .05.
In vivo therapeutic and biological effects of EZH2 knockdown on endometrial cancer
Next, we assessed the in vivo therapeutic effects of EZH2 knockdown using orthotopic mouse models. As shown in ), in the Hec-1A model, treatment with EZH2 Hs siRNA/CN or EZH2 Mm siRNA/CN, alone or in combination, significantly decreased the tumor burden compared with that following treatment with control siRNA/CN (34.4% tumor weight reduction in EZH2 Hs siRNA/CN-treated mice, 34.4% reduction in EZH2 Mm siRNA/CN-treated mice, and 66.6% reduction in mice treated with both EZH2 Hs and Mm siRNA/CN; p < .05 for all). Similar anti-tumor effects were observed in the Ishikawa model (p < .05 for all). With both models, the combination of EZH2 Hs and Mm siRNA/CN resulted in a significantly enhanced anti-tumor effect than that observed with EZH2 Hs siRNA/CN or EZH2 Mm siRNA/CN monotherapy (49.1% reduction with the Hec-1A model and 45.8–46.0% reduction with the Ishikawa model; p < .05 for all).
Figure 4. In vivo therapeutic and biological effects of EZH2 silencing on endometrial cancer. Mice inoculated with Hec-1A, or Ishikawa cells received siRNA/CN (control, human, mouse, or mixed EZH2) alone (a) or in combination with chemotherapy (b) at two weeks after cell line injection. Animals from all groups were euthanized when control animals became moribund. All tumors were harvested. Columns are mean tumor weights for each group. In vivo effect of EZH2 silencing on tumor cell proliferation (Ki67), angiogenesis (CD31), and apoptosis (TUNEL) by EZH2 siRNA/CN treatment alone (c) or in combination with chemotherapy (d). Immunohistochemical staining was performed for Hec-1A cell bearing mice. Error bars represent SEM. *, p < .05 compared to control siRNA/CN. **, p < .05 between connected bars.
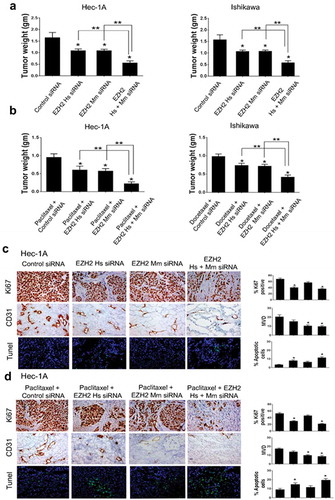
Given these in vitro findings related to the role of EZH2 silencing in chemosensitization, we further evaluated the effects of EZH2 siRNA in combination with chemotherapy ()). As expected, the therapeutic effects increased when chemotherapy was combined with EZH2 siRNA/CN treatment (p < .05 for all). Beneficial effects of combination treatment with EZH2 Hs and Mm siRNA/CN were also observed in chemotherapy groups, compared with that observed following a single use of EZH2 Hs or Mm siRNA/CN (p < .05 for all).
Tumor-related microvessel density (MVD; CD31 staining), tumor cell apoptosis (terminal deoxynucleotidyl transferase-mediated deoxyuridine triphosphate nick-end labeling [TUNEL] staining), and tumor cell proliferation (Ki67 staining) were evaluated to elucidate the potential mechanisms underlying the anti-tumor efficacy of EZH2 knockdown. In the Hec-1A model, Ki67 expression decreased following EZH2 Hs siRNA/CN treatment, alone or in combination with EZH2 Mm siRNA/CN, compared with that in the control group (p < .05 for both), but not after treatment with EZH2 Mm siRNA/CN alone ()). These effects were also observed to a greater extent in the Hec-1A chemosensitization model with paclitaxel treatment compared with those in the paclitaxel-plus-control siRNA/CN group (p < .05; )). Similar effects were observed in the Ishikawa model. In contrast, MVD significantly decreased in groups treated with EZH2 Mm siRNA/CN, alone or in combination with paclitaxel (p < .05 for all), but not in groups treated with EZH2 Hs siRNA/CN monotherapy. Similar findings were noted with the Ishikawa model (Supplementary Figure S2). In cells analyzed by TUNEL staining, a significant increase in apoptosis was observed for groups treated with EZH2 Hs siRNA/CN, alone or in combination with chemotherapy (2.42- and 3.44-fold increase, respectively, p < .05 for both; ,)). Similar results were also obtained using the Ishikawa model (Supplementary Figure S2).
Downstream pathways affected by EZH2 silencing
To identify potential genes directly involved in the anti-tumor effects elicited by EZH2 silencing, hierarchical clustering analysis was performed to analyze the expression levels of related genes affected by EZH2 silencing ()). Common changes in both endometrial (Hec-1A) and ovarian (SKOV3-ip1) cell lines were examined. By applying a strict threshold cutoff of p < .001 with a two-fold expression difference, 32 common differentially expressed genes (DEGs) were identified (,)). To elucidate biological characteristics, gene-network analysis was performed with Ingenuity Pathways Analysis (IPA) software (Ingenuity Systems, http://www.ingenuity.com). As expected, genes showing differential expression due to EZH2 silencing were highly associated with cell cycle progression, developmental disorders, cellular growth, and proliferation ()). Among these 32 DEGs, we focused on peroxiredoxin 6 (PRDX6) as a novel candidate gene linked to EZH2 expression, as the former exhibited a large change in expression. In addition, it has been reported that PRDX6 is important for platinum resistance and metastasis.Citation9,Citation10 To validate array findings, we assessed changes in PRDX6 protein expression in response to EZH2 silencing ()). After silencing EZH2 expression for three days, decreased PRDX6 expression was observed for up to 6 days in Hec-1A cells, confirming the array results. In addition, we examined signaling downstream of PRDX6 suppression, based on a previous report showing that PRDX6 exhibits both antioxidant peroxidase activity and anti-apoptotic activity related to the caspase pathway.Citation9 First, we examined changes in the caspase pathway following EZH2 silencing. The levels of caspase-3, −8, and −10, but not those of caspase-9, were found to increase after EZH2 silencing. Next, we examined reactive oxygen species (ROS) levels after EZH2 silencing ()). ROS levels did not differ between parental cells and EZH2 siRNA-treated cells.
Figure 5. Differentially expressed genes between control siRNA and EZH2 siRNA treated SKOV3-ip1 and Hec-1A cells. (a) Hierarchical clustering of gene expression data from of SKOV3 and HEC-1A cells treated with siRNA. Genes with at least 1.5-fold difference in expression level relative to the median value were selected for hierarchical clustering analysis (647 genes for SKOV3 and 1452 genes for HEC-1A). Data are presented in a matrix format, with rows representing individual gene and columns representing each sample. Each cell in the matrix represents the expression level of a gene feature in an individual sample. Red and green colors in cells reflect the relative high and low expression levels, respectively, as indicated in the scale bar (log 2 transformed scale). (b) Cross comparison of gene lists from two independent statistical tests. Venn diagrams of genes selected by univariate test with multivariate permutation test (10,000 random permutations). Red circle represents genes differentially expressed in ovarian cancer cell experiment. Blue circle represents genes differentially expressed in endometrial cancer cell experiment. We applied a cutoff p-value of less than 0.001 to retain genes whose expression in significantly different between the two groups of cells examined. (c) Expression pattern of selected 32 genes in the Venn diagram. (d) Gene network analysis of the 32 genes. Up- and down- regulated genes in EZH2 silenced cells are indicated by red and green color, respectively. Dotted lines and arrows represent the direction of transcriptional regulation. Solid lines represent known physical interactions between genes connected.
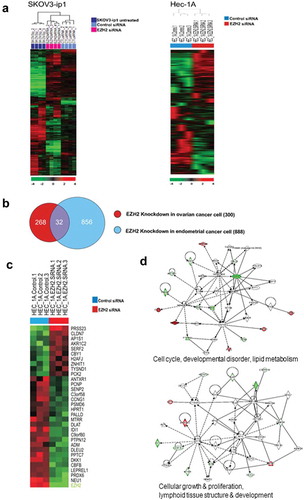
Figure 6. (a) Effect of EZH2 silencing on Hec-1A cells. After silencing of EZH2, Hec-1A cell lysate was analyzed by western blot for PRDX6 and caspases 3, 8, 9, and 10 activities. (b) Effect of EZH2 silencing on ROS levels in Hec-1A and Ishikawa cells. After EZH2 silencing alone or in combination with CDDP treatment, intracellular hydrogen peroxide and superoxide levels were measured by staining with DCF-DA and DHE, respectively. Mean DCF and DHE fluorescence were graphed and compared with controls to estimate changes of ROS levels caused by EZH2 silencing. Error bars represent SEM.
Discussion
The key findings of this study were that increased EZH2 expression significantly correlated with poor prognosis of endometrial cancer, and that EZH2 silencing effectively reduced endometrial cancer growth in several ways, including by sensitizing cancer cells to commonly used chemotherapy drugs.
The prognostic significance of EZH2 expression in endometrial cancer has been previously reported.Citation11 The in vivo effects of EZH2 knockdown were more pronounced than the in vitro effects found in this study. This is not unexpected, given that EZH2 silencing has indirect effects (mediated by reducing angiogenesis) and direct effects on cancer cells. Our previous findings demonstrated that endothelial EZH2 expression increased as a direct result of elevation in VEGF levels, indicating that the paracrine circuit stimulated angiogenesis by methylating and silencing vasohibin 1 (VASH1). EZH2 knockdown decreased angiogenesis mediated by VASH1, resulting in decreased tumor growth.Citation11 The present in vivo findings were consistent with those demonstrating the role of EZH2 in regulating tumor angiogenesis.Citation12 EZH2 silencing not only produced indirect effects (i.e., angiogenesis), but also exerted direct effects on tumor cells such as decreased proliferation and increased apoptosis. These effects led to tumor growth suppression in Hec-1A and Ishikawa cells. Interestingly, genomic analyses revealed that these results may be mediated, at least in part, by increased caspase activity via PRDX6 suppression.
Although TRAIL-mediated cell death has been shown to effectively kill malignant cancer cells, many cancer cells in humans are TRAIL-resistant.Citation13,Citation14 TRAIL resistance may partly be due to the interaction between PRDX6 and caspases-8 and −10 in the death-inducing signaling complex. According to recent studies, PRDX6 is involved in carcinogenesis and chemoresistance of various solid tumors. PRDX6 is a member of the thiol-dependent antioxidant peroxidase protein family, PRDX, whose enzymes play a major role in eliminating peroxinitrate, hydrogen peroxide, and organic hydrogen peroxides.Citation9,Citation10,Citation15 There are two subgroups of the PRDX family, 1-cys and 2-cys PRDX, that differ in the number of conserved catalytic cysteines. Interestingly, PRDX6 is the only protein of its subgroup (1-cys PRDX) that does not utilize thioredoxin as a reductant.Citation16 Furthermore, PRDX6 is also distinct from other PRDXs by virtue of its independent antioxidant and anti-apoptotic functions.Citation9,Citation17
Consistent with previous reports, our findings indicate that increased tumor cell death after EZH2 silencing is mediated by PRDX6 suppression and subsequent activation of the extrinsic caspase pathway.
Previous data show that caspase-8-dependent apoptosis is related to chemosensitivity to paclitaxel and cisplatin.Citation18,Citation19 Here, we found that EZH2 silencing had chemosensitizing effects toward taxane and cisplatin treatment in EZH2-overexpressing endometrial cancer cells. The mechanism underlying the therapeutic effects of EZH2 silencing might involve subsequent PRDX6 downregulation, at least in part, which eventually causes the activation of the extrinsic caspase pathway in tumor cells. Additional work is needed to elucidate the detailed molecular mechanism underlying the interaction between EZH2 and PRDX6 in endometrial cancer.
In summary, in the present work, we used orthotopic mouse models to demonstrate that EZH2 silencing is a potentially valuable approach for the therapeutic management of endometrial cancer. EZH2 silencing inhibited cell survival, tumor growth, and angiogenesis. Such effects were further enhanced when EZH2 silencing was used in combination with chemotherapy. These effects may be induced by stimulating caspase activity via PRDX6 suppression. Taken together, these results support EZH2 targeting as a valuable strategy to treat endometrial cancer.
Materials and methods
Tissue sample and tissue microarray
This study was approved by the Institutional Review Board (IRB) of Keimyung University Dongsan Hospital (IRB approval number 2018-01-011). Prior to tissue microarray (TMA) construction, all samples were stained with hematoxylin and eosin, and the slides were reviewed by a pathologist specializing in gynecology. After reviewing these slides, a representative block of each case was selected by the pathologist. TMAs were constructed as described previously.Citation20 All tissue samples were supplied by the Department of Pathology, Keimyung University, South Korea.
Cell lines and cultures
Endometrial cancer cells (Ishikawa, Hec-1A, and KLE cells) and SKOV3-ip1 ovarian cancer cells were maintained as described previously.Citation21,Citation22 The Ishikawa cell line was supplied by the European Collection of Authenticated Cell Cultures . The KLE cell line was purchased from the American Type Culture Collection. All in vitro studies were performed using 70% to 80% confluent cultures. For preclinical experiments, the cells were treated with trypsin, centrifuged at 1,200 rpm for 4 min at 4ºC, washed with Dulbecco’s phosphate-buffered saline (PBS), and reconstituted in Hank’s balanced salt solution (HBSS; Life Technologies). Each cell line was tested for mycoplasma infection and found to be negative before inoculation into mice.
siRNA constructs and in vitro delivery
Non-silencing control siRNA (5′-UUCUCCGAACGUGUCACGU-3′), human EZH2 siRNA (5′-CCAUGUUUACAACUAUCAA-3′), and mouse EZH2 siRNA (5′-GCUCUUACUGCUGAGCGUA-3′) were obtained from Sigma-Aldrich. As a control-target siRNA, we used a commercially available siRNA that did not share significant sequence homology with any human mRNAs. For in vitro experiments, siRNA was transfected using the N-TERTM Nanoparticle siRNA Transfection System (Sigma-Aldrich) in accordance with the manufacturer’s recommendations.
Western blot analysis
Lysates of cells and tissues were prepared as described previously.Citation21 Protein concentrations were calculated using the BCA Protein Assay Reagent Kit (Pierce Biotech). Proteins (30 μg) were loaded in a polyacrylamide gel for sodium dodecyl sulfate gel electrophoresis (some of the proteins we rerun on separate gels). Transferring and immunoblotting were done as described previously.Citation23 Antibodies against the following proteins were used: EZH2 (#4905, Cell Signaling Technology), PRDX6 (Abcam), caspase-3 (#9668, Cell Signaling Technology), caspase-8 (#9746, Cell Signaling Technology), and caspase-10 (MBL International). Differences in expression levels found by western blotting were analyzed by densitometry using ImageJ software (NIH).
Cell-viability assay
Cells were incubated overnight at 37ºC in 6-well plates. Cells were immersed in serum-containing medium before transfection with control or EZH2 siRNA. After an 8-h incubation with siRNAs, cells were incubated overnight in serum-containing medium. Then, cells were detached, re-plated in 96-well plates (7,000 cells/well), and incubated overnight. After incubation, cells were transfected with control or EZH2 siRNA once again following the procedure described above. On the next day, the cells were placed in medium with or without cytotoxic chemotherapy (paclitaxel, docetaxel, or cisplatin). After 72 h, cell viability was examined using a 3-(4,5-dimethylthiazol-2-yl)-2,5-diphenyltetrazolium bromide assay.Citation24
Clonogenic assay
A clonogenic assay was performed as described previously.Citation25 Twenty-four hours after siRNA transfection, cells were treated with chemotherapeutic agents (paclitaxel, docetaxel, and cisplatin) for 48 h. Then, cells were seeded in triplicate in 6-well culture plates (2,000 cells/well). After 7–14 days, colonies were fixed in 100% methanol and stained with 0.5% crystal violet. Survival colonies were defined as colonies containing over 50 cells. Colonies were quantified using ImageJ software. The interaction between each drug and EZH2 silencing was evaluated by the CI using the Bliss model.Citation26 CI was calculated as follows: CI = (F1 + F2 – F1 × F2)/F12. F1, F2, and F12 represent the inhibitory effect of the chemotherapeutic drug, EZH2 knockdown, and the combination of the two, respectively. Synergism was defined as CI < 1.
Apoptosis assay
Cells were stained with phycoerythrin-labeled anti-Annexin V antibody and 7-AAD (BD Biosciences) to evaluate the relative percentages of apoptotic cells, as previously described.Citation24 Briefly, cell pellets were washed and re-suspended in a binding buffer (5 μL per 105 cells). Analysis of apoptosis by flow cytometry was performed after incubation for 15 min in the dark.
Transwell migration assay
After incubating with either control or EZH2 siRNA for 48 h, cells were immersed in serum-free medium (1 × 10⁶ cells/mL). Transwell migration assays were performed using published procedures.Citation27 Briefly, 100-μL pellets were transferred to inserts coated with a defined matrix; then, the inserts were moved to wells filled with serum-containing media. Cell migration was permitted to proceed for 24 h at 37ºC. Cells that moved to the bottom wells were counted by light microscopy after staining. The average number of invading cells was estimated by counting the numbers of cells in 10 random fields (×200 magnification).
siRNA/CN preparation
To evaluate the in vivo effect of EZH2 knockdown, we used EZH2 siRNA directed to either human tumor cells (EZH2 Hs siRNA/CN) or mouse endothelial cells (EZH2 Mm siRNA/CN) sequences incorporated into chitosan nanoparticles. The siRNA/CN complexes were produced by ionic gelation of siRNA and anionic tripolyphosphate, as described previously.Citation28
Development of orthotopic animal models
Female athymic nude mice were purchased from the National Cancer Institute-Frederick Cancer Research and Development Center. Animal care guidelines of the Association for Assessment and Accreditation of Laboratory Animal Care International and the U.S. PHS Policy on Humane Care and Use of Laboratory Animals were followed throughout the study. The MD Anderson Cancer Center Institutional Animal Care and Use Committee approved and supervised all animal experiments. To develop orthotopic models, Ishikawa and Hec-1A cells (4.0 × 10⁶ cells in 100 μL HBSS) were inoculated into the uterine horn of mice.Citation24 The procedure followed was described previously.Citation21 Treatment began at two weeks post-injection. For EZH2-silencing experiments, mice were first randomly assigned to four groups (n = 10 mice per group): (a) control siRNA/CN, (b) EZH2 Hs siRNA/CN, (c) EZH2 Mm siRNA/CN, and (d) combined EZH2 Hs and Mm siRNA/CN. Next, to assess the effect of EZH2 knockdown in combination with chemotherapy, mice were divided into four groups (n = 10 mice per group): (a) control siRNA/CN + chemotherapy (paclitaxel or docetaxel), (b) EZH2 Hs siRNA/CN + chemotherapy, (c) EZH2 Mm siRNA/CN + chemotherapy, and (d) combined EZH2 Hs and Mm siRNA/CN + chemotherapy. Each siRNA/CN was administered by intravenous injection twice a week at a dose of 150 µg/kg body weight. For chemotherapy, paclitaxel or docetaxel was administered by direct injection into the peritoneal cavity once per week at a dose of 100 μg/mouse (paclitaxel) or 30 μg/mouse (docetaxel). Euthanasia was performed when the mice appeared moribund. The total body weights and tumor weights were recorded for each mouse. For protein analysis, the tumor tissues were snap-frozen; for frozen slide preparation, the tissues were soaked in optimum cutting temperature medium. For paraffin blocks, the tissues were fixed in formalin.
Immunohistochemical staining
Paraffin-embedded TMAs were used for EZH2 staining (1: 400 dilution; Zymed). Assessment of immunohistochemical staining was performed by a pathologist who was independent of and blinded to clinicopathologic information. A combined score was used to evaluate the immunohistochemical staining according to the proportion of positively stained nuclei and the staining intensity. The intensity score (IS) was determined according to the following criteria: 0, no staining; 1, weak staining; 2, moderate staining; and 3, strong staining. The proportion score (PS) was described as follows: 0, no positive tumor cells; 1, 1–25% positive cells; 2, 26–50% positive cells; 3, 51–75% positive cells; and 4, >75% positive cells. The combined scores were multiplied (PS × IS) to obtain an overall score ranging from 0 to 12. The expression levels of EZH2 were categorized as follows: overall score of 0–4, low expression; overall score of 5–8, intermediate expression; and overall score of 9–12, high expression. Analysis of CD31 and Ki67 expression was determined as previously described.Citation29 TUNEL staining was done using a Promega kit (Promega). Positive cells in five random fields were counted (×200 magnification).Citation29
Microarray data analysis
The Illumina platform was used for cDNA microarray analysis, as previously described.Citation12 Briefly, EZH2 mRNA was silenced using siRNA, and knockdown was confirmed by western blotting. A mirVana RNA Isolation Labeling Kit (Ambion, Inc.) was used to extract total RNA from cells transfected with control siRNA or EZH2 siRNA. Labeling and hybridization was performed using 500 ng of total RNA. After scanning bead chips (Sentrix Human v.3 HT-12) with an Illumina BeadArray Reader (Illumina Inc.), normalization of the microarray data was performed. Before performing further analysis, gene-expression levels were transformed to log2 base. A random-variance t test was used to differentiate gene-expression levels between the two groups. Statistical significance was accepted if the p value was less than 0.001. A strict cutoff was used to minimize the possibility of false-positive results. A global test was performed to determine differences in expression profiles between the two groups by permuting labels of arrays. The p values for each permutation were re-computed, and the number of genes with significant differences in expression was determined. Cluster and TreeView were used for clustering analysis.Citation30 IPA was used for gene-network analysis, based on a global molecular network produced from data in the Ingenuity Knowledge Base.
Measurement of ROS levels
Following EZH2 knockdown by siRNA, with or without cisplatin treatment, Ishikawa and Hec-1A cells were stained with 2′,7′-dichlorodihydrofluorescin diacetate (DCF-DA) to estimate the intracellular level of hydrogen peroxide. Dihydroethidium (DHE) was used to measure intracellular superoxide levels. DCF-DA staining was performed using the OxiSelect™ Intracellular ROS Assay Kit (Cell Biolabs, Inc.) to determine intracellular hydrogen peroxide levels. Intracellular superoxide levels were estimated using the ROS Detection Cell-Based Assay Kit (DHE) (Cayman). The fluorescence intensity values were determined using a microplate reader (DHE: excitation and emission at 485 and 530 nm, respectively; DCF-DA: excitation and emission at 485 and 590 nm, respectively). The data were collected using Magellan software (SPECTRAFluor Plus; TECAN).
Statistical analyses
For assessing the normal distribution of continuous variables, a Kolmogorov–Smirnov analysis was performed, and the data were expressed as the median with range or as the mean with the standard error of the mean. One-way analysis of variance with post-hoc analysis or Kruskal–Wallis test with multiple comparisons (Wilcoxon rank-sum test with Bonferroni correction) was carried out to appropriately evaluate the statistical significance. Fisher’s exact test was used for categorical variables. Data from triplicates were used to monitor the performance in each in vitro experiment. Kaplan–Meier survival analysis was performed, and comparisons between survival curves were produced by log-rank statistics. P < .05 was considered to represent statistical significance. All statistical analysis was performed using IBM SPSS Statistics software, version 21.0 (IBM SPSS, Inc).
Author contributions
JR, JL, SYK, CHC, JK, RLC, GL, and AKS initiated the research, developed the concept of the paper, designed the study, and analyzed and interpreted the data; JR, JEC, HDH, WH, KM, MN, and JK performed the experiments; JR, SYK, and AKS wrote the manuscript.
Disclosure of interest
AKS: Consulting (Merck, Kiyatec); shareholder (BioPath); research funding (M-Trap).
Supplemental Material
Download MS Word (707.9 KB)Supplemental Material
Download MS Word (16.8 KB)Acknowledgments
The authors thank Grace Lee, class of 2020 from Dartmouth College, for her contribution to the proofreading of this article.
Supplemental data
Supplemental data for this article can be accessed at publisher’s website.
Additional information
Funding
References
- Siegel RL, Miller KD, Jemal A. Cancer statistics, 2017. CA Cancer J Clin. 2017;67(1):7–30. doi:10.3322/caac.21387.
- Obel JC, Friberg G, Fleming GF. Chemotherapy in endometrial cancer. Clin Adv Hematol Oncol. 2006;4(6):459–468.
- Humber CE, Tierney JF, Symonds RP, Collingwood M, Kirwan J, Williams C, Green JA. Chemotherapy for advanced, recurrent or metastatic endometrial cancer: a systematic review of Cochrane collaboration. Ann Oncol. 2007;18(3):409–420. doi:10.1093/annonc/mdl417.
- Simon JA, Tamkun JW. Programming off and on states in chromatin: mechanisms of Polycomb and trithorax group complexes. Curr Opin Genet Dev. 2002;12(2):210–218. doi:10.1016/S0959-437X(02)00288-5.
- Collett K, Eide GE, Arnes J, Stefansson IM, Eide J, Braaten A, Aas T, Otte AP, Akslen LA. Expression of enhancer of zeste homologue 2 is significantly associated with increased tumor cell proliferation and is a marker of aggressive breast cancer. Clin Cancer Res. 2006;12(4):1168–1174. doi:10.1158/1078-0432.CCR-05-1533.
- Weikert S, Christoph F, Kollermann J, Muller M, Schrader M, Miller K, Krause H. Expression levels of the EZH2 polycomb transcriptional repressor correlate with aggressiveness and invasive potential of bladder carcinomas. Int J Mol Med. 2005;16(2):349–353. doi:10.3892/ijmm.16.2.349.
- Varambally S, Dhanasekaran SM, Zhou M, Barrette TR, Kumar-Sinha C, Sanda MG, Ghosh D, Pienta KJ, Sewalt RG, Otte AP, et al. The polycomb group protein EZH2 is involved in progression of prostate cancer. Nature. 2002;419(6907):624–629. doi:10.1038/nature01075.
- Matsukawa Y, Semba S, Kato H, Ito A, Yanagihara K, Yokozaki H. Expression of the enhancer of zeste homolog 2 is correlated with poor prognosis in human gastric cancer. Cancer Sci. 2006;97(6):484–491. doi:10.1111/j.1349-7006.2006.00203.x.
- Choi H, Chang JW, Jung YK. Peroxiredoxin 6 interferes with TRAIL-induced death-inducing signaling complex formation by binding to death effector domain caspase. Cell Death Differ. 2010;18(3):405–414. doi:10.1038/cdd.2010.113.
- Pak JH, Choi WH, Lee HM, Joo WD, Kim JH, Kim YT, Kim YM, Nam JH. Peroxiredoxin 6 overexpression attenuates cisplatin-induced apoptosis in human ovarian cancer cells. Cancer Invest. 2011;29(1):21–28. doi:10.3109/07357907.2010.535056.
- Zhou J, Roh JW, Bandyopadhyay S, Chen Z, Munkarah AR, Hussein Y, Alosh B, Jazaerly T, Hayek K, Semaan A, et al. Overexpression of enhancer of zeste homolog 2 (EZH2) and focal adhesion kinase (FAK) in high grade endometrial carcinoma. Gynecol Oncol. 2013;128(2):344–348. doi:10.1016/j.ygyno.2012.07.128
- Lu C, Han HD, Mangala LS, Ali-Fehmi R, Newton CS, Ozbun L, Armaiz-Pena GN, Hu W, Stone RL, Munkarah A, et al. Regulation of tumor angiogenesis by EZH2. Cancer Cell. 2010;18(2):185–197. doi:10.1016/j.ccr.2010.06.016
- Manevich Y, Sweitzer T, Pak JH, Feinstein SI, Muzykantov V, Fisher AB. 1-Cys peroxiredoxin overexpression protects cells against phospholipid peroxidation-mediated membrane damage. Proc Natl Acad Sci USA. 2002;99(18):11599–11604. doi:10.1073/pnas.182384499.
- Wang X, Phelan SA, Forsman-Semb K, Taylor EF, Petros C, Brown A, Lerner CP, Paigen B. Mice with targeted mutation of peroxiredoxin 6 develop normally but are susceptible to oxidative stress. J Biol Chem. 2003;278(27):25179–25190. doi:10.1074/jbc.M302706200.
- Rhee SG, Chae HZ, Kim K. Peroxiredoxins: a historical overview and speculative preview of novel mechanisms and emerging concepts in cell signaling. Free Radic Biol Med. 2005;38(12):1543–1552. doi:10.1016/j.freeradbiomed.2005.02.026.
- Chen JW, Dodia C, Feinstein SI, Jain MK, Fisher AB. 1-Cys peroxiredoxin, a bifunctional enzyme with glutathione peroxidase and phospholipase A2 activities. J Biol Chem. 2000;275(37):28421–28427. doi:10.1074/jbc.M005073200.
- Li DQ, Wang L, Fei F, Hou YF, Luo JM, Zeng R, Wu J, Lu JS, Di GH, Ou ZL, et al. Identification of breast cancer metastasis-associated proteins in an isogenic tumor metastasis model using two-dimensional gel electrophoresis and liquid chromatography-ion trap-mass spectrometry. Proteomics. 2006;6(11):3352–3368. doi:10.1002/pmic.200500617
- Mielgo A, Torres VA, Clair K, Barbero S, Stupack DG. Paclitaxel promotes a caspase 8-mediated apoptosis through death effector domain association with microtubules. Oncogene. 2009;28(40):3551–3562. doi:10.1038/onc.2009.210.
- Duiker EW, Meijer A, van der Bilt AR, Meersma GJ, Kooi N, van der Zee AG, de Vries EG, de Jong S. Drug-induced caspase 8 upregulation sensitises cisplatin-resistant ovarian carcinoma cells to rhTRAIL-induced apoptosis. Br J Cancer. 2011;104(8):1278–1287. doi:10.1038/bjc.2011.84.
- Kang SH, Cho J, Jeong H, Kwon SY. High RNA-binding motif protein 3 expression is associated with improved clinical outcomes in invasive breast cancer. J Breast Cancer. 2018;21(3):288–296. doi:10.4048/jbc.2018.21.e34.
- Roh JW, Huang J, Hu W, Yang X, Jennings NB, Sehgal V, Sohn BH, Han HD, Lee SJ, Thanapprapasr D, et al. Biologic effects of platelet-derived growth factor receptor alpha blockade in uterine cancer. Clin Cancer Res. 2014;20(10):2740–2750. doi:10.1158/1078-0432.CCR-13-2507
- Landen CN Jr., Chavez-Reyes A, Bucana C, Schmandt R, Deavers MT, Lopez-Berestein G, Sood AK. Therapeutic EphA2 gene targeting in vivo using neutral liposomal small interfering RNA delivery. Cancer Res. 2005;65(15):6910–6918. doi:10.1158/0008-5472.CAN-05-0530.
- Mangala LS, Zuzel V, Schmandt R, Leshane ES, Halder JB, Armaiz-Pena GN, Spannuth WA, Tanaka T, Shahzad MM, Lin YG, et al. Therapeutic targeting of ATP7B in ovarian carcinoma. Clin Cancer Res. 2009;15(11):3770–3780. doi:10.1158/1078-0432.CCR-08-2306
- Lee JW, Han HD, Shahzad MM, Kim SW, Mangala LS, Nick AM, Lu C, Langley RR, Schmandt R, Kim HS, et al. EphA2 immunoconjugate as molecularly targeted chemotherapy for ovarian carcinoma. J Natl Cancer Inst. 2009;101(17):1193–1205. doi:10.1093/jnci/djp231
- LC C, ME C, NJ W. Measuring survival of adherent cells with the colony-forming assay. Cold Spring Harb Protoc. 2016;2016(8). doi:10.1101/pdb.prot087171.
- Peng H, Wen J, Li H, Chang J, Zhou X. Drug inhibition profile prediction for NFkappaB pathway in multiple myeloma. PLoS One. 2011;6(3):e14750. doi:10.1371/journal.pone.0014750.
- Spannuth WA, Nick AM, Jennings NB, Armaiz-Pena GN, Mangala LS, Danes CG, Lin YG, Merritt WM, Thaker PH, Kamat AA, et al. Functional significance of VEGFR-2 on ovarian cancer cells. Int J Cancer. 2009;124(5):1045–1053. doi:10.1002/ijc.24028.
- Han HD, Mangala LS, Lee JW, Shahzad MMK, Kim HS, Shen D, Nam EJ, Mora EM, Stone RL, Lu C, et al. Targeted gene silencing using RGD-labeled chitosan nanoparticles. Clin Cancer Res. 2010;16(15):3910–3922. doi:10.1158/1078-0432.CCR-10-0005.
- Shahzad MM, Lu C, Lee JW, Stone RL, Mitra R, Mangala LS, Lu Y, Baggerly KA, Danes CG, Nick AM, et al. Dual targeting of EphA2 and FAK in ovarian carcinoma. Cancer Biol Ther. 2009;8(11):1027–1034. doi:10.4161/cbt.8.11.8523
- Eisen MB, Spellman PT, Brown PO, Botstein D. Cluster analysis and display of genome-wide expression patterns. Proc Natl Acad Sci USA. 1998;95(25):14863–14868. doi:10.1073/pnas.95.25.14863.