
ABSTRACT
The six-transmembrane epithelial antigen of prostate 2 (STEAP2) protein was identified in advanced prostate cancer, and is highly over-expressed in various types of cancer. This study aimed to investigate the prognostic value and the function of STEAP2 in breast cancer. STEAP2 mRNA and protein expressions in breast normal and cancer tissues, breast cancer cell lines (MCF-7, BT-549, BT-474, MDA-MB-361, HCC1937, and MDA-MB-468) and normal mammary epithelial cell lines (HBL-100 and MCF-10A) were evaluated by immunohistochemistry, real time RT-qPCR and western blotting. The expression of STEAP2 in breast cancer tissues and its value of evaluating the prognosis of breast cancer patients was validated in the Public Databases (Oncomine and Kaplan-Meier plotter database). Lentiviral vectors with STEAP2 cDNA and shRNA were constructed and used to infect breast cancer cell lines and normal mammary epithelial cell line to investigate the effects of STEAP2 up- and down- regulation on the biological behavior of breast cells. The low expression of STEAP2 was detected in breast cancer tissues, which was associated with malignant phenotype and poor prognosis of breast cancer. The public databases analyses were consistent with our findings. STEAP2 up-regulation hindered cellular proliferation, invasion and metastasis abilities by inhibiting EMT process and suppressing PI3K/AKT/mTOR signaling pathway. On the other hand, STEAP2 down-regulation could promote cell proliferation and invasion by inducing EMT and activating the PI3K/AKT/mTOR signaling pathway. Collectively, STEAP2 acted as an anti-oncogene in breast cancer development, which suggested a new research objective for the future studies.
Introduction
Breast cancer is the most common female carcinoma and a prevailing cause of cancer-related death in women, accounting for 30% of all new cancers (estimated 252,710 cases) and 14% of all cancer deaths (approximately 40,610 breast cancer deaths) in women in the USA, according to cancer statistics from 2017.1 Therapeutic strategies for breast cancer consist of local resection, with or without systemic treatments such as radiotherapy, chemotherapy, and endocrine therapy, or a combination of the above. New therapeutic models such as gene therapy and biological targeted therapy have attracted increasing attention; however, effective and specific markers for breast cancer treatment have not yet been established. Although the cancer death rate has declined by approximately 1.5 % per year during the last decade,Citation1 5–10% of breast cancer patients are still diagnosed with stage IV breast cancer, which remains virtually incurable, at their initial visit.Citation2 Current treatments for advanced breast cancer (ABC) can only improve quality of life and prolong survival time. Recurrence and metastasis are the main causes of death in patients with ABC, yet little is known about the molecular mechanisms of invasion and metastasis in ABC. Therefore, studies on the biological behavior, development, invasion, and metastasis mechanisms of breast cancer are urgently required to discover new therapeutic strategies that improve patient prognosis.
The human six-transmembrane epithelial antigen of the prostate (STEAP) protein family consists of four integral membrane proteins (STEAP1-4), that share high sequence similarity in their six-helical transmembrane domains and N-terminal cytoplasmic oxidoreductase domains .Citation3 STEAP proteins are very similar in structure and domain organization; however, they are expressed in different patterns and have been implicated in metabolic and inflammatory diseases and cancer.Citation4–Citation7 The STEAP2 gene, also known as six-transmembrane protein of the prostate 1 (STAMP1), is located on chromosome 7q21.13 close to STEAP1 and STEAP4. It consists of 6 exons and 5 introns and encodes a protein of 490 amino acids .Citation8,Citation9 STEAP2 was first cloned and characterized by Korkmaz et al. and Porkka et al. using cDNA subtraction and array hybridization, showing its expression to be remarkably higher in prostate carcinomas than in benign prostate hyperplasias and normal gland tissues.Citation8,Citation9 Like STEAP2, STEAP1 and STEAP4 are also over-expressed in prostate cancer and play an important role in tumor malignancy.Citation10–Citation14 STEAP3 is the only member of the STEAP family whose gene is not located on chromosome 7, but on chromosome 2q14.2. STEAP3, also known as tumor suppressor activated pathway 6 (Tsap6), was first identified and cloned by Passer et al.Citation15 Unlike STEAP1, STEAP2, and STEAP4 which exhibit proliferative effects, STEAP3 stimulates p53 expression, induces apoptosis, and inhibits prostate cancer cell proliferation.Citation16,Citation17 The STEAP family is thought to play an important role in tumor development due to their cell membrane localization and differential expression between normal samples and cancer samples.Citation4–Citation7 Current research on STEAP family members is in its initial stages and little is known about the role of STEAP2 in breast cancer. This study investigated the prognostic value of STEAP2 in breast cancer and its functions in cancer cell proliferation, invasion, and metastasis in vitro and in vivo.
Materials and methods
Cell lines
Human breast cancer (MCF-7, BT-549, BT-474, MDA-MB-361, HCC1937, and MDA-MB-468), and normal mammary epithelial (HBL-100 and MCF-10A) cell lines were purchased from the Cell Resource Center of Shanghai Institutes for Biological Sciences, Chinese Academy of Sciences. All cells were cultured in complete DMEM/F-12 (Gibco) supplemented with 10% fetal bovine serum (FBS, Gibco) and 1% antibiotics (Penicillin-Streptomycin Solution, Gibco), at 37°C in a 5 % CO2 incubator.
Tumor tissues samples
After obtaining written informed consent, a total of 350 breast tissue samples were collected from patients at the Shandong Provincial Hospital and Qilu Hospital affiliated to Shandong University between 2008 and 2017, consisting of 45 normal breast tissues, 60 breast fibroadenoma and 245 breast cancer samples. Breast cancer patients were diagnosed according to the TNM international staging system and had received no preoperative radiation or chemotherapy. This study was approved by the Institutional Medical Ethics Committee of Shandong University and all methods were performed in accordance with the relevant guidelines and regulations.
Immunohistochemistry (IHC) and immunocytochemistry (ICC)
For IHC, paraffin embedded tissue sections were dewaxed using a xylene gradient and treated with ethanol. Antigen retrieval was then performed at high pressure for 2 min in antigenic repair solution prepared with the citrate buffer. For ICC, cells in logarithmic growth were harvested and digested using trypsin. After centrifugation, cell suspensions were prepared, inoculated into a 24-well plate covered with a glass cover slip, and cultured at 37°C with 5% CO2 for 24 h to allow cell adhesion. The cell cover slips were then removed and fixed with 95% ethanol for 30 min. The next steps for IHC and ICC were identical, and followed a standard streptomyces biotin protein-peroxidase (SP) staining procedure. Firstly, all tissue sections and cell slides were incubated with 3% hydrogen peroxide (H2O2) for 10 min to inactivate endogenous peroxidase, normal goat serum for 20 min to block nonspecific binding sites, rabbit anti-STEAP2 antibodies (1:100 dilution, ab174978, Abcam) overnight at 4°C, and then biotin-conjugated anti-rabbit secondary antibodies for 30 min. Finally the enzyme substrate 3′, 3-diaminobenzidine tetrahydrochloride (DAB; Sigma-Aldrich, St. Louis, MO, USA) was developed for 5–10 min, and the degree of staining was assessed using a microscope (cells with brown cytoplasm were identified as positive cells).
IHC and ICC analysis
To analyze the IHC and ICC results and evaluate STEAP2 expression, the semi-quantitative scoring system devised by Soumaoro et al.Citation18 was used. The staining results were scored and graded according to staining intensity and the proportion of positive cells in the tissue section or cell slides. Staining intensity was scored as follows: 0, no staining; 1, weak staining; 2, medium staining; and 3, strong staining. The proportion of positive cells was scored as follows: 0, 0 % cells stained; 1, 1–25% cells stained; 2, 26–50% cells stained; 3, 51–75% cells stained; and 4, 76–100% cells stained. The total score were the sum of the staining intensity and the positive cell proportion scores (0 to 7). To facilitate statistical analysis, total scores ≦ 3 was considered low expression and those ≧ 4 was considered high expression. All tissue sections and cell slides were evaluated blind by two investigators; in the event of a difference in scores, agreement was reached through discussion.
Analysis of the oncomine and kaplan-meier plotter public databases
Array datasets from Oncomine (www.oncomine.org), an online cancer microarray database and web-based data-mining platform, were used to carry out the multiple comparisons of DNA and RNA gene expression levels from genome-wide expression analyses. The pattern of STEAP2 expression in clinical breast cancer specimens compared to normal controls was analyzed using Oncomine array datasets. Detailed information on the standardized techniques and statistical calculations is provided on the Oncomine platform. The Kaplan Meier plotter (KM Plotter, http://kmplot.com/analysis/) can assess the effect of 54,675 genes on survival using 5,143 breast cancer samples. The database is handled by a PostgreSQL server which simultaneously integrates gene expression and clinical data. To assess the prognostic value of a particular gene, patient samples were split into two groups according to their expression quantile for the proposed biomarker and compared using a Kaplan-Meier survival plot. Hazard ratios with 95% confidence intervals and logrank P values were calculated. We used this tool to assess the effect of STEAP2 on breast cancer prognosis.
Total RNA extraction and real-time quantitative polymerase chain reaction (RT-qPCR)
Sample were fully digested in RNAiso Plus (TaKaRa) and chloroform was added. After centrifugation, the solution formed an upper layer, an intermediate layer, and an organic layer, with RNA distributed in the upper supernatant layer. Total RNA was obtained from the upper layer after isopropanol precipitation. To produce complementary DNA (cDNA), reverse transcription was carried out using a PrimeScriptTM RT reagent kit with gDNA Eraser (TaKaRa). RT-PCR was carried out using TB Green™ Premix Ex Taq™ II (Tli RNaseH Plus) on a LightCycler 480 System (Roche Diagnostics) with a 20 µL reaction system consisting of 10 µL TB Green Premix Ex Taq II (2× Tli RNaseH Plus), 0.8 µL forward primer (10 µM), 0.8 µL reverse primer (10 µM), 2 µL DNA template (< 100 ng), and 6.4 µL sterilized water. The following standard two-step PCR reaction program was used: 1) one cycle of pre-denaturation at 95°C for 30 s; and 2) 40 cycles of 95°C for 5 s and 60°C for 20 s, followed by melting curve analysis and cool down. RT-PCR amplification and fusion curves were confirmed and a standard curve was produced for quantification. Specific primers were designed and synthesized by Takara Biotechnology Co., Ltd, the sequences of which were listed in . Relative quantitative gene expression levels were analyzed using the 2﹣ΔΔCt method.Citation19
Table 1. The sequence of primer in real time RT-qPCR.
Western blot
Cells in logarithmic growth were harvested and lysed using radioimmunoprecipitation assay (RIPA) lysis buffer and phenylmethylsulfonyl fluoride (PMSF) solution (volume ratio, 100:1) and a BCA Protein Assay kit (Solarbio) was used to determine the concentration of lytic proteins. Metallic-bath denatured proteins were stored in a refrigerator for short-term use. Sample volume was calculated for a sample quantity of 40 µg using the protein concentration. To separate proteins of different molecular weights, 10% sodium dodecyl sulfate polyacrylamide gel (SDS-PAGE) electrophoresis was performed. The electrophoretically isolated proteins were transferred to polyvinylidene difluoride (PVDF) membranes in pre-prepared electrotransposing fluid at a steady voltage of 100 V for approximately 40 min in an ice box (transfer time based on the molecular weight of the target protein). The PVDF membranes were blocked with 5% skim milk to avoid nonspecific binding or background clutter and incubated with specific primary antibodies (diluted with antibody diluent at a 1:1000 ratio) shaken at 4°C overnight. The following day, the membranes were washed three times with tris-buffered saline containing Tween 20 (TBST) and incubated with corresponding secondary antibodies at 25°C for 1 h. Blots positive for the target proteins were developed using a Bio-Rad enhanced chemiluminescence (ECL) kit (Solarbio) and imaged using a ChemiDocTM XRS+ Imaging System with Image Lab™ Software.
Lentiviral transfection for STEAP2 over-expression and knockdown
The lentiviral construction and packaging of both the STEAP2 up- and down-regulation vectors were completed by Shanghai Genechem Co., Ltd. The STEAP2 up-regulation lentiviral vector, hereafter referred to as STEAP2 cDNA, was obtained by recombining the pGC-LV-GV287-GFP vector with the STEAP2 (NM_001040665) gene. The STEAP2 down-regulation lentiviral vector, hereafter referred to as STEAP2 shRNA, was obtained by cloning small hairpin RNAs (shRNAs) using a self-inactivating lentiviral vector containing a CMV-driven GFP reporter and an U6 promoter (GeneChem, Shanghai, China). MCF-7 and BT-474 breast cancer cells were transfected with STEAP2 cDNA to up-regulate STEAP2 expression, whilst normal mammary epithelial cells (HBL-100) were transfected with STEAP2 shRNA to down-regulate STEAP2 expression. Concurrent negative control groups were set up for routine culture. According to the manufacturer’s instructions, cells in logarithmic growth were harvested, seeded in 24-well plates, and incubated in a 5% CO2 incubator at 37°C for 24 h. To achieve high viral infection efficiency and reduce cytotoxicity, the multiplicity of infection (MOI, ratio of viral quantity to cell number at infection) was set at 100 for STEAP2 cDNA transfection, and 50 for STEAP2 shRNA transfection. The corresponding amount of lentivirus was mixed with enhanced infection solution (ENi.S, a viral infection enhancer developed independently by Shanghai Genechem Co., LTD which promotes efficient viral infection by increasing cell surface activity and the contact area between the virus and cell) and polybrene and then added to the cell culture medium. After 12 h of conventional culture, the viral mixture was replaced with complete culture medium. Transfection efficiency was observed under a fluorescence microscope after 72 h. Differences in mRNA and protein expression between the over-expression or knockdown and negative control groups were detected by RT-qPCR and western blotting to verify effective transfection.
Cell proliferation assays
Cell proliferation capacity was tested using growth curve and plate clone formation assays. For the growth curve assay, cells in logarithmic growth phase were digested with trypsin and suspended in complete medium. Cell suspensions were inoculated into 24-well plates (1 × 10⁴ cells/well) and routinely cultured at 37°C with 5% CO2. From the following day, the number of cells was recorded continuously for 7 days and the values for three wells averaged each day. The data were analyzed and growth curves drawn (x = cell culture time, y = number of cells per day). Experiments were repeated three times.
The plate clone formation assay detects two important characteristics, cell population dependence and proliferation. The ability of cells to form clones is indicated by the number of adherent cells that survive and form clones after inoculation. Cell suspensions were prepared and inoculated into 6-well plates (500 cells/well), gently shaken to spread the cells evenly, and cultured at 37°C in a 5% CO2 incubator for approximately 2–3 weeks. Cell culture was terminated when visible clones were observed. Cells were then fixed with 4% paraformaldehyde for 15 min and stained with GIMSA for 10–30 min. Clones were counted directly using the naked eye. Experiments were repeated three times.
Transwell invasion and migration assays
Transwell chambers, also known as Boyden or modified Boyden chambers, consist of two compartments separated by a microporous membrane with an 8.0 µm pore size and are useful and common tools for studying cell migration and invasion. In general, cells in the upper compartment can move through the pores of the membrane into the lower compartment using chemotactic agents. The migration and invasion abilities of different cells can be determined by comparing the number of cells passing through the pores.
For the Transwell migration assay, 2 × 10⁵ cells were placed in the upper compartment with 200 µL complete medium, whilst the serum-free conditioned medium of NIH3T3 cells was added to the lower compartment. After incubation for 12 h at 37°C with 5% CO2, the membrane between the two compartments was fixed with 95% ethanol for 30 min, stained with crystal violet for 10 min, and the number of cells that had migrated to the lower side of the membrane were counted under an inverted microscope (OLYMPUS, BX63F, Japan).
For the Transwell invasion assay, the microporous membrane was coated with Matrigel to form a biologically-active three-dimensional matrix mimicking the structure, composition, physical properties, and functions of the cell basement membrane in vivo. Matrigel, which solidifies rapidly at room temperature and adopts a liquid state at 4°C, was preserved at −20°C and thawed at 4°C. The Matrigel was diluted with cool, serum-free medium at a 1:5 ratio and placed in an ice box where 50 µL was spread on the upper chamber membrane carefully without bubbles and then incubated at 37°C for 1 h to solidify and polymerize. For the Transwell invasion assay, 2 × 10⁵ cells were added to the upper chamber with 200 µL complete medium and 600 µL of the serum-free conditioned medium of NIH3T3 cells was added to the lower chamber. After 24 h of conventional culture, the microporous membrane was fixed, stained, and the number of cells that had passed through the Matrigel to the lower side of the membrane was counted under an inverted microscope.
Establishment of xenograft tumor model in nude mice
Female nude mice (age, 4 weeks; weight, 18–19 g) were randomly divided into an over-expression group and negative control group (n = 5 per group). The neck and back of each mouse was subcutaneously inoculated with cells (1 × 10⁷) suspended in 0.5 mL stroke-physiological saline solution (which has no adverse effects on animal health) and the mice were raised in a specific pathogen-free (SPF) animal facility (temperature, 20–26°C; humidity, 40–60%; 12/12-h light/dark cycle; free access to food and water) for 2 months. During this time, their tumor growth status and general condition were observed regularly by a specially-assigned individual. Nude mice with tumor ulcers were raised alone and sterilized daily with 75% alcohol until scabs had formed. At the end of this period, all nude mice were sacrificed by CO2 euthanasia: the mice were placed in a sealed container into which CO2 flowed steadily at 20% per minute. After 5 min, the mice were removed from the CO2 container for 5 min to confirm their death. Tumor size was measured using Vernier calipers and tumor volume was calculated using the following formula: V (mm3) = length (mm) × wide2 (mm2) × 0.5, expressed as x̄ ± S. In this study, each mouse had a single subcutaneous tumor, with the over-expression and negative control groups exhibiting maximum tumor diameters of 27.64 and 11.67 mm, respectively. All animal experiments (ID Number: 20180304) were approved by the Institutional Animal Care and Use Committee of Shandong University and carried out in compliance with all regulatory guidelines.
Statistical analysis
Chi-square tests were used to analyze the IHC data. Differences between two pre-selected groups were analyzed by independent sample t-tests and differences between more than two pre-selected groups were analyzed by one-way ANOVA using SPSS statistical software (IBM SPSS statistic 24.0). P values of < 0.05 were considered statistically significant.
Results
STEAP2 expression in human breast tissues
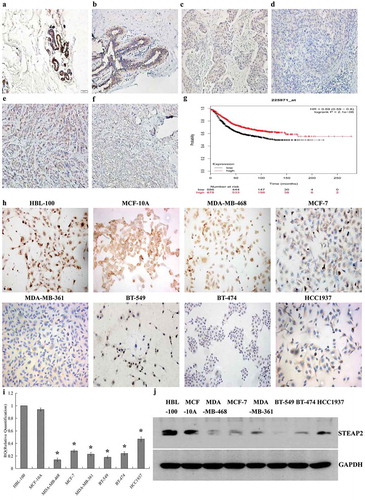
The results of IHC experiment revealed that STEAP2 expression was significantly higher in normal breast tissue () and breast fibroadenoma () than that in breast cancer (-), with staining mainly concentrated around the cell membrane and cytoplasm, but not in the nucleus. The percentage of STEAP2 over-expression was also significantly higher in normal breast tissue and breast fibroadenoma than in breast cancer tissue (). Compared with poorly differentiated invasive ductal carcinoma and lobular carcinoma (, ), STEAP2 was highly expressed in well differentiated invasive ductal carcinoma and lobular carcinoma (, ).
Table 2. The expressions of STEAP2 in breast tissue.
Figure 1. Expressions of STEAP2 in breast tissues and cell lines and its Kaplan-Meier plotter analysis. STEAP2 expressions of (a) normal human breast tissue, (b) fibroadenoma tissue, (c) well differentiated invasive ductal carcinoma, (d) poorly differentiated invasive ductal carcinoma, (e) well differentiated invasive lobular carcinoma and (f) poorly differentiated invasive lobular carcinoma were measured by IHC. (Magnification×200). (g) Analysis of the public Kaplan-Meier plotter database of breast cancer, patients with high STEAP2 expression (red line) had a much better prognosis than those with low STEAP2 expression (black line). STEAP2 expressions of breast epithelial cell line HBL-100 and MCF-10A, and 6 kinds of cancer cell lines (MDA-MB-361, HCC1937, MDA-MB-468, MCF-7, BT-549 and BT-474) were measured by (h) ICC staining, (i) real time RT-qPCR and (j) western blotting (cropped blot). MDA-MB-468, MCF-7 and MDA-MB-361 are breast adenocarcinoma cell lines, meanwhile, BT-549, BT-474 and HCC1937 are breast ductal cancer cell line, both of which had lower expressions of STEAP2, compared to normal breast epithelial cell lines HBL-100 and MCF-10A. (Magnification×200). *P < .05.
Relationship between STEAP2 expression and clinicopathological features of breast cancer patients
STEAP2 expression levels were not related to pathological type or molecular subtype, but were related to lymph node metastasis, TNM clinical stage, and breast cancer histological grade (). High STEAP2 expression was negatively correlated with late clinical stage and high histological grade of breast cancer. This indicated that the expression of STEAP2 decreased with the increase of clinical stage and histological grade of breast cancer. The expression of STEAP2 in patients with negative lymph node metastasis was higher than that in patients with positive lymph node metastasis.
Table 3. The relationship between STEAP2 expressions and clinicopathological characteristics of breast cancer.
Analysis of the public databases
Based on the analysis of Oncomine datasets (https://www.oncomine.org), we found that in Richardson Breast 2 Dataset, STEAP2 mRNA expression in Normal Breast (7) was 5.471 times higher than that in Ductal Breast Carcinoma (40), in Curtis Breast Dataset, STEAP2 mRNA expression in Normal Breast (144) was 2.756 times higher than that in Medullary Breast Carcinoma (32), and in TCGA Breast Dataset, STEAP2 mRNA expression in normal breast (61) was 2.132 times higher than that in Invasive Ductal Breast Carcinoma (389) (P < .05). Similar results were also obtained from Gluck Breast and Sorlie Breast Oncomine datasets, which revealed that the mRNA expression of STEAP2 was significantly reduced in breast carcinomas (). The relationship between STEAP2 expression and the prognosis of breast cancer patients was analyzed using the publicly-available survival analysis Kaplan-Meier plotter (http://kmplot.com). The high STEAP2 expression group exhibited a significantly longer survival time than the low expression group (). In conclusion, low STEAP2 expression positively correlated with the poor clinicopathological stage and prognosis of breast cancer.
Table 4. The differential analysis of STEAP2 mRNA expression in normal breast and breast carcinoma tissue in public Oncomine datasets.
STEAP2 expression in normal mammary epithelial cells and six breast cancer cell lines
By ICC (), RT-qPCR () and western blotting (), STEAP2 mRNA and protein expression were significantly lower in the six breast cancer cell lines (MDA-MB-361, HCC1937, BT-549, BT-474, MDA-MB-468m, and MCF-7) than in the normal mammary epithelial cell lines (HBL-100 and MCF-10A). The MDA-MB-468, MCF-7, and MDA-MB-361 breast adenocarcinoma cell lines and BT-549, BT-474, and HCC1937 breast ductal cancer cell lines all exhibited lower STEAP2 expression than the normal mammary epithelial cell lines HBL-100 and MCF-10A. STEAP2 expression followed the same pattern in breast cancer tissues and cells, emphasizing that down-regulated STEAP2 expression was closely associated with the malignant phenotype of breast cancer.
Efficiency of STEAP2 up- and down-regulation
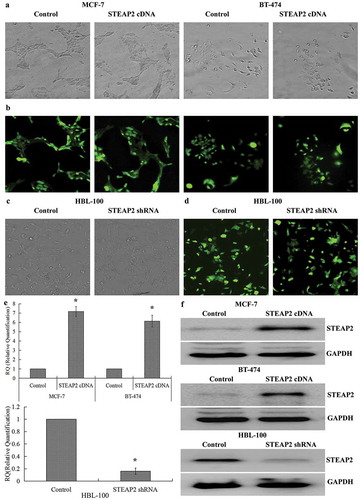
Since breast cancer cells displayed lower STEAP2 expression than normal mammary epithelial cells, we examined the role of STEAP2 in the proliferation and invasion of breast cancer cells using lentiviral transfection: STEAP2 expression was up-regulated in breast cancer cell lines and down-regulated in the normal mammary epithelial cell line. After 72 h of transfection, > 80% of the cells were GFP positive by fluorescence microscopy, indicating high transfection efficiency (-). RT-qPCR () and western blotting () revealed that STEAP2 cDNA-transfected MCF-7 and BT-474 cells had markedly higher STEAP2 expression than the control cells, whereas STEAP2 shRNA-infected HBL-100 cells had lower STEAP2 expression. These results demonstrated that the over-expression and knockdown transfections were successful and effective.
Figure 2. Determination of the efficiencies of STEAP2 up-regulation and down-regulation. (a) Phase contrast images and (b) GFP fluorescence images showed effective transfection efficiencies in breast cancer cell MCF-7 and BT-474 infected with STEAP2 or negative control cDNA. (c) Phase contrast images and (d) GFP fluorescence images showed effective transfection efficiencies in normal mammary epithelial cell line HBL-100 infected with STEAP2 or negative control shRNA. STEAP2 expressions of control or STEAP2 cDNA infected MCF-7 and BT-474 cells, and in control or STEAP2 shRNA infected HBL-100 cells were measured by (e) real time RT-qPCR and (f) western blotting (cropped blot). The results of the above studies demonstrated the success and effectiveness of over-expression and knockdown transfection. (Magnification ×200). *P < .05.
Effects of STEAP2 up- or down-regulation on breast cancer cell migration and invasion
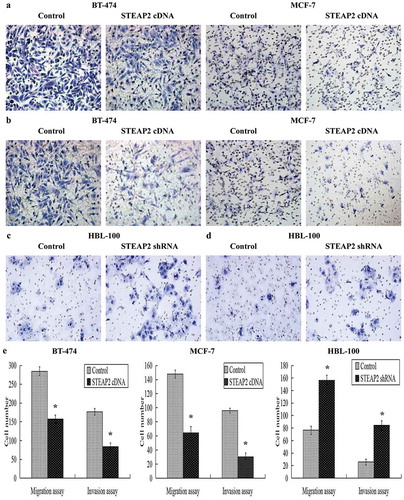
We assessed the effects of STEAP2 on breast cancer cell migration and invasion using Transwell chambers, since cell migration and invasion can be determined by comparing the number of cells passing through its microporous membrane. The results showed that fewer cells migrated through the PVPF membrane () or invaded through the Matrigel () in the STEAP2 cDNA-transfected groups than in the control groups. The average number of STEAP2 cDNA-transfected cells that invaded or migrated were significantly less than that of the negative control cells (). So, STEAP2 up-regulation inhibited the invasion and migration abilities of the breast cancer cells. On the contrary, more cells migrated through the PVPF membrane () or invaded through the Matrigel () in the STEAP2 shRNA-infected groups than in the control groups. The average number of STEAP2 shRNA-infected cells that invaded or migrated were considerably higher than that of the negative control cells (). Thus, STEAP2 down-regulation promoted the invasion and migration abilities of normal breast cells.
Figure 3. Effects of STEAP2 up-regulation and down-regulation on breast cancer cell migrating and invasive activities. (a) Images of cell migration assay performed in control or STEAP2 cDNA infected MCF-7 and BT-474 cells by Boyden chambers without Matrigel. (b) Images of cell invasion assay performed in control or STEAP2 cDNA infected MCF-7 and BT-474 cells by Boyden chambers coated with Matrigel. (c) Images of cell migration assay performed in control or STEAP2 shRNA infected HBL-100 cells by Boyden chambers without Matrigel. (d) Images of cell invasion assay performed in control or STEAP2 shRNA infected HBL-100 cells by Boyden chambers coated with Matrigel. (Magnification×200). (e) The average counts of STEAP2 cDNA transfected MCF-7 and BT-474 cells that invaded or migrated were significantly less than that of control cells, meanwhile, the average counts of STEAP2 shRNA transfected HBL-100 cells that invaded or migrated were remarkably more than that of control cells. In summary, STEAP2 up-regulation inhibited invasion and migration abilities of breast cancer MCF-7 and BT-474 cells, otherwise, STEAP2 down-regulation promoted invasion and migration abilities of normal breast HBL-100 cells. *P < .05.
Effects of STEAP2 up- or down-regulation on breast cancer cell proliferation and clonogenicity
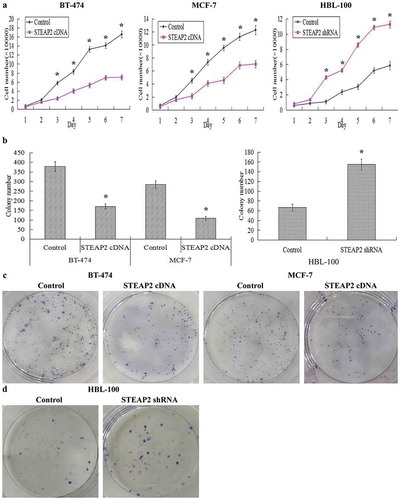
Growth curves reflecting the growth and proliferation of breast cancer cells showed that STEAP2 cDNA-transfected cells grew slower and had a weaker proliferative ability than the negative control cells, whereas STEAP2 down-regulation distinctly accelerated cell growth and proliferation (). The clone forming ability of breast cancer cells was assessed using a clone formation assay. The average colony number formed by STEAP2 cDNA-transfected cells was significantly lower than that formed by negative control cells, whereas the average colony number formed by STEAP2 shRNA-infected cells was considerably higher than that formed by negative control cells (). STEAP2 cDNA-transfected cells formed fewer and smaller clones than the negative control cells (), whereas STEAP2 down-regulation markedly increased the number and size of clones formed (). In summary, STEAP2 over-expression clearly inhibited breast cancer cell proliferation and clonogenicity, whilst its knockdown promoted these properties.
Figure 4. Effects of STEAP2 up-regulation and down-regulation on breast cancer cell proliferative and clonogenic capacities. Cell proliferation ability was evaluated by growth curve. (a) STEAP2 up-regulation significantly inhibited cell proliferative abilities of both breast cancer cell lines MCF-7 and BT-474, otherwise, STEAP2 down-regulation distinctly promoted cell proliferative abilities of normal mammary epithelial cell line HBL-100. (b) Compared to controls, the colony numbers were markedly down-regulated in STEAP2 cDNA transfected MCF-7 and BT-474 cells, on the other hand, the colony numbers formed by STEAP2 shRNA infected HBL-100 cells were much more than that formed by control cells. (c) The colony images of control or STEAP2 cDNA infected MCF-7 and BT-474 cells were examined by the plate clone formation assay. (d) The colony images of control or STEAP2 shRNA infected HBL-100 cells were examined by the plate clone formation assay. In conclusion, over-expression of STEAP2 distinctly inhibited breast cancer cell proliferation and clonogenicity, meanwhile, knockdown of STEAP2 evidently promoted normal breast cell proliferation and clonogenicity. (Magnification×200). *P < .05.
Effects of STEAP2 on tumor growth in the nude mice
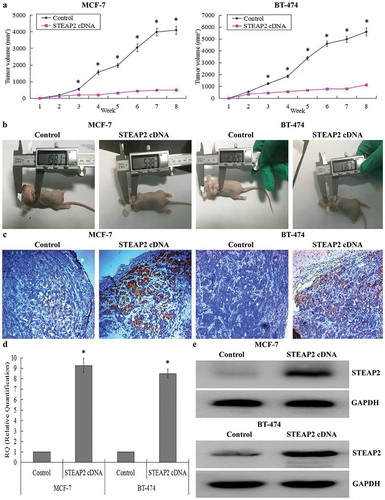
The xenograft tumor model was established in the nude mice to further evaluate whether STEAP2 regulated tumor growth in vivo. Each mouse was subcutaneously inoculated with STEAP2 cDNA-transfected cells or negative control cells (n = 5 per group). After 2 months, the STEAP2 cDNA group showed a clear delay in both tumor size and growth rate. The tumor growth follow-up after 8 weeks was shown in . Subcutaneous tumors were smaller in the STEAP2 cDNA group than in the negative control group (). Using IHC (), RT-qPCR (), and western blotting (), we confirmed that the subcutaneous tumors formed by STEAP2 cDNA-transfected cells had higher STEAP2 expression than those formed by the control cells. Collectively, STEAP2 up-regulation inhibited tumor growth in the nude mice in vivo.
Figure 5. Effects of STEAP2 up-regulation on the growth of xenotransplantation tumor in vivo. (a) The growth tumors profile of control or STEAP2 cDNA infected MCF-7 and BT-474 cells were observed continuously for 8 weeks. STEAP2 cDNA group revealed evident delay in tumor size and growth. (b) Images of xenotransplantation tumor after subcutaneous inoculation of control and STEAP2 cDNA infected cells. The tumor size of STEAP2 cDNA group was much smaller than that of control group. By IHC (c), real time RT-qPCR (d) and western blotting (cropped blot) (e), the xenotransplantation tumor formed by STEAP2 cDNA transfected MCF-7 and BT-474 cells consisted of more positive STEAP2 expressions, compared to that formed by control cells. Collectively, STEAP2 up-regulation inhibited tumor growth in the nude mice. *P < .05.
Effects of STEAP2 up- or down-regulation on epithelial to mesenchymal transition (EMT)-related genes
EMT is a phenomenon observed in embryonic development that also occurs after adult epidermal cells are damaged; however, EMT enables polarized epithelial cancer cells to lose their epithelial characteristics and obtain mesenchymal properties with stronger invasion and detachment abilities during tumor cell development.Citation20 The Transwell assays revealed that STEAP2 affected the migratory and invasive capabilities of breast cancer cells; therefore, we suspected that up- or down-regulating STEAP2 would affect key EMT genes in breast cancer cells. The results of western blotting revealed that at protein level, in STEAP2 cDNA-transfected MCF-7 and BT-474 cells, STEAP2 up-regulation significantly increased the expression of the epithelial hallmark, E-cadherin, which mediates cell-cell interactions, and decreased the expression of the mesenchymal hallmarks N-cadherin and Vimentin and transcription factors Snail, Slug, and Twist, which repress E-cadherin transcription and regulate EMT. Conversely, in STEAP2 shRNA-infected HBL-100 cells, STEAP2 down-regulation remarkably decreased the expression of the epithelial hallmark E-cadherin and increased the expression of the mesenchymal hallmarks N-cadherin and Vimentin and transcription factors Snail, Slug, and Twist (). At the mRNA level, we came to a consistent conclusion by RT-qPCR (). In summary, the gain or loss of STEAP2 function could affect several key EMT-related genes; STEAP2 over-expression could inhibit EMT, whereas STEAP2 knockdown could promote EMT.
Figure 6. Effects of STEAP2 up-regulation on the key EMT hallmarks and the PI3K/AKT pathway. (a) By western blotting (cropped blot), EMT hallmarks, including E-cadherin, N-cadherin, vimentin, Snail, Slug and Twist, were measured in control or STEAP2 cDNA infected MCF-7 and BT-474 cells. (b) STEAP2 up-regulation decreased the phosphorylation levels of PI3K, AKT and mTOR in STEAP2 cDNA infected BT-474 and MCF-7 cells, and had no effect on the phosphorylation levels of ERK. (c) By real-time RT-qPCR, STEAP2 up-regulation enhanced the expression of E-cadherin, and repressed the expression of N-cadherin, Vimentin, Snail, Slug and Twist, at mRNA levels. (d) AKT and EMT activator IGF-1 could markedly restore cell invasive and migratory capabilities of STEAP2 cDNA infected MCF-7 and BT-474 cells, which was inhibited by STEAP2 up-regulation. (e) AKT and EMT activator IGF-1 could significantly reinforce the proliferation abilities of STEAP2 cDNA infected MCF-7 and BT-474 cells, which was repressed by STEAP2 up-regulation. *P < .05.
Effects of STEAP2 up- or down-regulation on the PI3K/AKT and ERK pathways
To investigate the mechanism of STEAP2 up- or down-regulation in breast cancer cells, we investigated the PI3K/AKT/mTOR and ERK signaling pathways, which had been reported to play a central role in activating EMT.Citation21,Citation22 As shown in , STEAP2 up-regulation after lentiviral transfection significantly decreased PI3K, AKT, and mTOR phosphorylation levels in STEAP2 cDNA-transfected MCF-7 and BT-474 cells. Conversely, STEAP2 down-regulation remarkably increased PI3K, AKT, and mTOR phosphorylation levels in STEAP2 shRNA-infected HBL-100 cells. However, no changes were observed in ERK phosphorylation levels regardless of whether STEAP2 was up- or down-regulated. These data indicated that STEAP2 up-regulation inactivated the PI3K/AKT/mTOR signaling pathway, whereas STEAP2 down-regulation activated it. In addition, we used IGF-1 (insulin-like growth factor-1), a PI3K/AKT pathway activator and EMT inducer,Citation23 to evaluate the role of the PI3K/AKT signaling pathway in STEAP2 up-regulation-mediated malignant phenotypic cellular changes. IGF-1 could markedly restore the proliferative (), invasive and migratory capabilities () of STEAP2 cDNA-transfected cells which were inhibited by STEAP2 over-expression. In conclusion, STEAP2 up-regulation could inhibit the proliferation and invasion of breast cancer cells and inactivate the PI3K/AKT signaling pathway.
Discussion
In this study, we found that STEAP2 expression was down-regulated in breast cancer tissues and cell lines and was related to advanced tumor clinical stage, high histological grade, positive lymph node metastases, and poor prognosis in breast cancer. Using lentiviral infection and in vitro and in vivo assays to assess cell function, we showed that STEAP2 acted as an anti-oncogene in breast cancer development by suppressing EMT and blocking PI3K/AKT signaling.
Our experimental data suggested that STEAP2 expression was down-regulated in breast cancer tissue and cells compared to normal breast tissue and epithelial cells. Public database analysis (Oncomine and Kaplan-Meier plotter) verified that low STEAP2 expression was associated with the malignant phenotype and poor prognosis of breast cancer. Conversely, STEAP2 up-regulation significantly increased the proliferative abilities of human prostate cancer cells in vitro and in vivo, with STEAP2 knockdown in prostate cancer cells suppressing cell growth, partially inducing cell cycle arrest, and causing significant apoptosis.Citation24 Further mechanistic studies demonstrated that STEAP2 over-expression in normal prostate epithelial PNT2 cells increased their migration and invasion abilities,Citation25 whereas STEAP2 knockdown reduced the migratory and invasive potential of prostate cancer PC3 and LNCaP cells.Citation26 STEAP2 has also been found to be over-expressed in other human cancers, such as bladder, colon, pancreatic, ovarian, testicular, and cervical cancer and Ewing sarcoma.Citation4,Citation5 So far, little research has been carried out on the relationship between STEAP2 and other tumors; however, STEAP2 and STEAP1 appear to be significantly co-expressed in cancerCitation4 and STEAP1 has been shown to play a role in carcinogenesis and tumor suppression.Citation27–Citation30 Comprehensive analyses of the role and clinical importance of STEAP2 in cancer are crucial, with further studies on the role of STEAP2 in cancer pathophysiology promising to improve the diagnosis and treatment of cancer.
The epithelial-to-mesenchymal transition (EMT) plays an important role in tumorigenesis and development. During EMT, epithelial cells are forced to obtain mesenchymal phenotypic features, including stemness, invasiveness, drug-resistance, and the ability to metastasize to distant organs.Citation31 In our study, we found that up-regulated STEAP2 expression could suppress the migratory and invasive capabilities of breast cancer cells in vitro and in vivo. Further experiments revealed that STEAP2 could affect EMT; STEAP2 up-regulation inhibited EMT, up-regulated E-cadherin expression (an epithelial hallmark of EMT), and decreased N-cadherin and vimentin expression (mesenchymal markers). These changes lead to closer intercellular connections between adjacent endothelial cells that prevent cancer cells from passing through.Citation32 Snail, Slug, and Twist belong to a family of transcription factors that bind to E-box motifs and hamper E-cadherin transcription to regulate EMT. When STEAP2 was over-expressed, the levels of all three decreased and E-cadherin expression increased, suggesting that STEAP2 can suppress the invasion and metastasis of breast cancer cells by influencing transcription factors and inhibiting EMT. A relationship between STEAP2 and EMT has not yet been reported in other cancers; however, it has been confirmed that STEAP proteins are localized at cell-cell junctions and their secondary structure has been elucidated.Citation3 Therefore, the STEAP family is believed to be ion channels or transporter proteins involved in iron or protein transmission and inter-cellular communication, ultimately affecting the proliferation, apoptosis, and invasion of cancer cells.Citation4,Citation5 The mechanisms by which STEAP proteins are involved in cell proliferation and carcinogenesis remain elusive and further investigation is needed. More data will allow better strategies to be developed for the prevention and treatment of breast cancer.
The PI3K/AKT/mTOR pathway is one of the most common abnormally regulated pathways in breast cancer. Its dysfunctional activation is closely related to increased cell proliferation and poor clinical prognosis; thus, it is an important potential target for treating breast cancer.Citation33–Citation35 In this study, STEAP2 over-expression down-regulated phospho-PI3K, -AKT, and -mTOR activity in BT-474 and MCF-7 breast cancer cells. Moreover, the AKT and EMT activator IGF-1, which was able to significantly restore the proliferation, invasion, and migration abilities of STEAP2 cDNA-infected cells, was inhibited by STEAP2 up-regulation. These data indicate that STEAP2 over-expression inactivated the PI3K/AKT/mTOR signaling pathway. In LNCaP prostate cancer cells, RNA interference-mediated STEAP2 knockdown inhibited cell growth in vitro and in vivo and induced partial cell cycle arrest and significant cell apoptosis.Citation24 Further signal transduction studies have revealed that ERK activation induced by EGF treatment was almost completely lost in STEAP2 shRNA-infected LNCaP cells, whereas robust ERK activation was observed in the control cells. These data showed that STEAP2 is necessary for optimal ERK activity in prostate cancer cells;Citation24 however, STEAP2 up-regulation had no effect on the ERK signaling pathway in breast cancer cells in our study. These functional differences may be due to the effects of different tumor microenvironments on tumor-associated genes during the progression of different cancers.Citation36 To date, some molecular details of STEAP protein functions have been uncovered; however, additional information must be acquired through biochemical, molecular, and cellular research. An important aspect of future STEAP protein research is identifying common or private binding partners and the upstream and downstream pathways involved in STEAP protein-mediated signaling.
In conclusion, down-regulated STEAP2 expression was detected in breast cancer tissues and was associated with the malignant phenotype and poor prognosis of breast cancer, consistent with public database analyses. Moreover, STEAP2 was able to suppress the proliferation, invasion, and metastasis of breast cancer cells in vitro and in vivo by inhibiting EMT and inactivating the PI3K/AKT signaling pathway. We propose that STEAP2 could be a potential target for breast cancer therapy to inhibit its invasion and metastasis and improve patient prognosis.
Compliance with ethical standards
This study was approved by the Institutional Medical Ethics Committee of Shandong University. All methods were performed in accordance with the relevant guidelines and regulations.
Conflict of interest
The authors declare they have no conflict of interest.
Authors’ contributions
All authors had read and approved the manuscript. Conceived and designed the experiments: QY JL. Performed the experiments: QY GJ JL. Analyzed the data: GJ. Wrote the paper: QY.
Additional information
Funding
References
- Siegel RL, Miller KD, Jemal A. Cancer Statistics, 2017. CA Cancer J Clin. 2017;67(1):7–30.
- Reinert T, Barrios CH. Optimal management of hormone receptor positive metastatic breast cancer in 2016. Ther Adv Med Oncol. 2015;7(6):304–320.
- Hubert RS, Vivanco I, Chen E,Rastegar S, Leong K, Mitchell SC, Madraswala R, Zhou Y, Kuo J, Raitano AB, et al. STEAP: a prostate-specific cell-surface antigen highly expressed in human prostate tumors. Proc Natl Acad Sci U S A. 1999;96:14523–14528.
- Grunewald TG, Bach H, Cossarizza A, Matsumoto I. The STEAP protein family: versatile oxidoreductases and targets for cancer immunotherapy with overlapping and distinct cellular functions. Biol Cell. 2012;104(11):641–657.
- Gomes IM, Maia CJ, Santos CR. STEAP proteins: from structure to applications in cancer therapy. Mol Cancer Res. 2012;10(5):573–587.
- Sikkeland J, Sheng X, Jin Y, Saatcioglu F. STAMPing at the crossroads of normal physiology and disease states. Mol Cell Endocrinol. 2016;425:26–36.
- Lindstad T, Jin Y, Wang L, Qu S, Saatcioglu F. STAMPs at the crossroads of cancer and nutrition. Nutr Cancer. 2010;62(7):891–895.
- Porkka KP, Helenius MA, Visakorpi T. Cloning and characterization of a novel six-transmembrane protein STEAP2, expressed in normal and malignant prostate. Lab Invest. 2002;82(11):1573–1582.
- Korkmaz KS, Elbi C, Korkmaz CG, Loda M, Hager GL, Saatcioglu F. Molecular cloning and characterization of STAMP1, a highly prostate-specific six transmembrane protein that is overexpressed in prostate cancer. J Biol Chem. 2002;277(39):36689–36696.
- Gomes IM, Arinto P, Lopes C, Santos CR, Maia CJ. STEAP1 is overexpressed in prostate cancer and prostatic intraepithelial neoplasia lesions, and it is positively associated with Gleason score. Urol Oncol. 2014;32(1):53.e23–9.
- Ihlaseh-Catalano SM, Drigo SA, de Jesus CM, Domingues MA, Trindade Filho JC, de Camargo JL, Rogatto SR. STEAP1 protein overexpression is an independent marker for biochemical recurrence in prostate carcinoma. Histopathology. 2013;63(5):678–685.
- Yamamoto T, Tamura Y, Kobayashi J, Kamiguchi K, Hirohashi Y, Miyazaki A, Torigoe T, Asanuma H, Hiratsuka H, Sato N. Six-transmembrane epithelial antigen of the prostate-1 plays a role for in vivo tumor growth via intercellular communication. Exp Cell Res. 2013;319(17):2617–2626.
- Korkmaz CG, Korkmaz KS, Kurys P, Elbi C, Wang L, Klokk TI, Hammarstrom C, Troen G, Svindland A, Hager GL, et al. Molecular cloning and characterization of STAMP2, an androgen-regulated six transmembrane protein that is overexpressed in prostate cancer. Oncogene. 2005;24(31):4934–4945.
- Tamura T, Chiba J. STEAP4 regulates focal adhesion kinase activation and CpG motifs within STEAP4 promoter region are frequently methylated in DU145, human androgen-independent prostate cancer cells. Int J Mol Med. 2009;24(5):599–604.
- Passer BJ, Nancy-Portebois V, Amzallag N, Prieur S, Cans C, Roborel de Climens A, Fiucci G, Bouvard V, Tuynder M, Susini L, et al. The p53-inducible TSAP6 gene product regulates apoptosis and the cell cycle and interacts with Nix and the Myt1 kinase. Proc Natl Acad Sci USA. 2003;100(5):2284–2289.
- Steiner MS, Zhang X, Wang Y, Lu Y. Growth inhibition of prostate cancer by an adenovirus expressing a novel tumor suppressor gene, pHyde. Cancer Res. 2000;60(16):4419–4425.
- Zhang X, Steiner MS, Rinaldy A, Lu Y. Apoptosis induction in prostate cancer cells by a novel gene product, pHyde, involves caspase-3. Oncogene. 2001;20(42):5982–5990.
- Soumaoro LT, Uetake H, Higuchi T, Takagi Y, Enomoto M, Sugihara K. Cyclooxygenase-2 expression: a significant prognostic indicator for patients with colorectal cancer. Clin Cancer Res. 2004;10(24):8465–8471.
- Livak KJ, Schmittgen TD. Analysis of relative gene expression data using real-time quantitative PCR and the 2(-Delta Delta C(T)) Method. Methods. 2001;25(4):402–408.
- Sun L, Fang J. Epigenetic regulation of epithelial-mesenchymal transition. Cell Mol Life Sci. 2016;73(23):4493–4515.
- Voon DC, Huang RY, Jackson RA, Thiery JP. The EMT spectrum and therapeutic opportunities. Mol Oncol. 2017;11(7):878–891.
- Singh M, Yelle N, Venugopal C, Singh SK. EMT: mechanisms and therapeutic implications. Pharmacol Ther. 2018;182:80–94.
- Cevenini A, Orrù S, Mancini A, Alfieri A, Buono P, Imperlini E. Molecular signatures of the insulin-like growth factor 1-mediated epithelial-mesenchymal transition in breast, lung and gastric cancers. Int J Mol Sci. 2018;19:8.
- Wang L, Jin Y, Arnoldussen YJ, Jonson I, Qu S, Maelandsmo GM, Kristian A, Risberg B, Waehre H, Danielsen HE, et al. STAMP1 is both a proliferative and an antiapoptotic factor in prostate cancer. Cancer Res. 2010;70(14):5818–5828.
- Whiteland H, Spencer-Harty S, Morgan C, Kynaston H, Thomas DH, Bose P, Fenn N, Lewis P, Jenkins S, Doak SH. A role for STEAP2 in prostate cancer progression. Clin Exp Metastasis. 2014;31(8):909–920.
- Burnell SEA, Spencer-Harty S, Howarth S, Bodger O, Kynaston H, Morgan C, Doak SH. STEAP2 knockdown reduces the invasive potential of prostate cancer cells. Sci Rep. 2018;8(1):6252.
- Xie J, Yang Y, Sun J, Jiao Z, Zhang H, Chen J. STEAP1 inhibits breast cancer metastasis and is associated with epithelial-mesenchymal transition procession. Clin Breast Cancer. 2019;19(1):e195–e207.
- Nakamura H, Takada K, Arihara Y, Hayasaka N, Murase K, Iyama S, Kobune M, Miyanishi K, Kato J. Six-transmembrane epithelial antigen of the prostate 1 protects against increased oxidative stress via a nuclear erythroid 2-related factor pathway in colorectal cancer. Cancer Gene Ther. 2019;26(910):313–322.
- Wu YY, Jiang JN, Fang XD, Ji FJ. STEAP1 regulates tumorigenesis and chemoresistance during peritoneal metastasis of gastric cancer. Front Physiol. 2018;9:1132.
- Barroca-Ferreira J, Pais JP, Santos MM, Goncalves AM, Gomes IM, Sousa I, Rocha SM, Passarinha LA, Maia CJ. Targeting STEAP1 protein in human cancer: current trends and future challenges. Curr Cancer Drug Targets. 2018;18(3):222–230.
- Zhang Y, Weinberg RA. Epithelial-to-mesenchymal transition in cancer: complexity and opportunities. Front Med. 2018;12(4):361–373.
- Ramis-Conde I, Chaplain MA, Anderson AR, Drasdo D. Multi-scale modelling of cancer cell intravasation: the role of cadherins in metastasis. Phys Biol. 2009;6(1):016008.
- Bahrami A, Khazaei M, Shahidsales S, Hassanian SM, Hasanzadeh M, Maftouh M, Ferns GA, Avan A. The therapeutic potential of PI3K/Akt/mTOR inhibitors in breast cancer: rational and progress. J Cell Biochem. 2018;119(1):213–222.
- Guerrero-Zotano A, Mayer IA, Arteaga CL. PI3K/AKT/mTOR: role in breast cancer progression, drug resistance, and treatment. Cancer Metastasis Rev. 2016;35(4):515–524.
- Sharma VR, Gupta GK, Sharma AK, Batra N, Sharma DK, Joshi A, Sharma AK. PI3K/Akt/mTOR intracellular pathway and breast cancer: factors, mechanism and regulation. Curr Pharm Des. 2017;23(11):1633–1638.
- Quail DF, Joyce JA. Microenvironmental regulation of tumor progression and metastasis. Nat Med. 2013;19(11):1423–1437.