
ABSTRACT
Patients with high-risk neuroblastoma (HR-NB) often initially respond to therapy, but afterward they become resistant and disease recurred. Unfortunately, it does not exist one or more specific chromosome defects associated with relapse or refractory NB. Recently, genomic evidence from primary tumors indicated that the distal region of chromosome 6q is loss in HR-NB patients with fatal outcome. We identified a minimal common region of loss of chromosome 6q27 spanning an area of 2.09 Mb by high-resolution DNA copy number data of a small cohort of HR-NB samples carrying 6q loss. This region of loss harbored five genes T, SFT2D1, RPS6KA2, FGFR1OP, and UNC93A. We found that low SFT2D1, RPS6KA2, and FGFR1OP gene expression predicted poor outcome in HR-NB patients using public R2 Platform. Further functional studies will be essential to confirm the presumed tumor suppressor gene(s) located within 6q27 region. These results suggest that SFT2D1, RPS6KA2, and FGFR1OP genes may be responsible for poor prognosis of HR-NB tumors with 6q27 loss, and their haploinsufficiency may be crucial in accelerating tumor progression.
Introduction
Neuroblastoma (NB), arising from neural crest progenitor cells, is the most common tumor in very young children.Citation1 Although unbelievable improvements have been made for children with low-risk disease, patients with high-risk neuroblastoma continue to have an incurable disease with survival rates <40% in spite of cytotoxic chemo-radiotherapy.Citation2,Citation3 Patients with high-risk neuroblastoma (HR-NB) initially respond to therapy, but afterward up to 60% of these become resistant and disease recurred.Citation4-Citation7 NB is one example of how specific chromosome rearrangements can influence the trend of the disease. Currently, whole-genome analysis revealed large genomic DNA copy number alterations (losses of chromosome 1p, 3p, 4p, 11q and gains of 1q, 2p, 17q) that are of prognostic significance for newly diagnosed NB patients.Citation8-Citation15 It has been proposed that multiple genes located on recurrent chromosome segmental aberrations may have dosage effects that influence tumor formation.Citation14,Citation15 Although mutational events are rare and often non-recurrent, combining these findings with chromosome copy number aberrations and pathway analysis it has been demonstrated the recurrent involvement of genes implicated in neuritogenesis and chromatin remodeling.Citation16-Citation19 Unfortunately, it does not exist one or more specific chromosome defects associated with relapse or refractory NB. Previous studies have delineated a 7 Mb region at distal 6q27 loss in HR-NB patients with extremely poor survival outcome.Citation20 A complete genomic analysis of the distal 6q region would help to identify the putative NB tumor suppressor gene(s).
Here, we report the cytogenetic characterization of 15 primary HR-NB samples with 6q loss. We determined the size and genetic content of these losses by high-resolution array-Comparative Genome Hybridization (a-CGH), and decoded a common region of overlap spanning 2.09 Mb. We hypothesize that the genes contained in the commonly loss region are dosage-sensitive, and that the haploinsufficiency of one or more of these genes was associated with extremely poor survival outcome of HR-NB.
Results
Analysis of 6q loss in HR-NB patients
Array-CGH disclosed multiple segmental chromosome gains or losses in the genomic profile of 15 NB samples analyzed. Partial chromosome losses were most often detected for chromosome arms 1p, 3p, 4p, 11q, and partial chromosome gain for 1q, 2p, 7q, 17q abnormalities associated with grim survival outcome of NB patients.Citation8-Citation15 All NB samples harbored 6q loss: seven cases showed distal loss, six had interstitial loss, and two carried both distal and interstitial 6q losses. gives an overview of all rearrangements in chromosome arm 6q. We remarked that only three samples with 6q loss also showed MYCN amplification ().
Table 1. Genome copy number analysis of 15 NB samples that define a minimal common region of loss on chromosome arm 6q.
Figure 1. Schematic representation of chromosome arm 6q rearrangement. Distribution of breakpoints of chromosome 6q in 15 HR-NB samples. Green lines on the right side of the ideogram represent losses; the red line represents gain. The indicated five genes in the 6q27 region meet the following criteria: statistically significantly lower expression of the gene in NB cell lines with vs without 6q loss, at least one mutation in the gene as described in primary NB, and statistically significantly worse survival outcome when gene expression is low in HR-NB. SRO = smallest region of overlap.
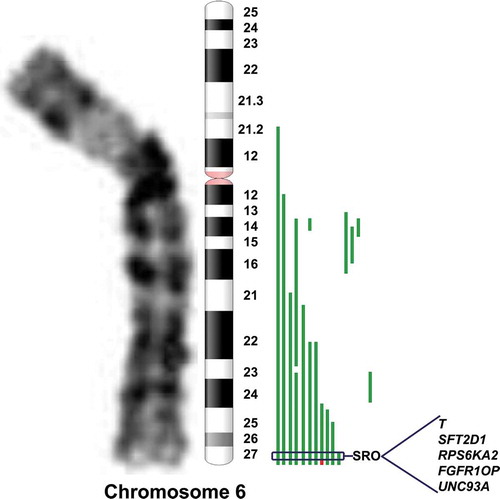
Of interest, we defined a minimal common region of genomic loss in distal 6q by a sample that showed a small loss spanning an area of 4.68 Mb. The 6q27 region was deleted from oligomer A_14_P103168 (166.203.071 bp) (first deleted) to oligomer A_14_P120743 (170.890.108 bp) (last deleted), containing 38 genes (C6orf176, LOC441177, T, PRR18, SFT2D1, BRP44L, RPS6KA2, MIR1913, RNASET2, FGFR1OP, CCR6, GPR31, TCP10L2, UNC93A, TTLL2, TCP10, C6orf123, C6orf124, MLLT4, HGC6.3, KIF25, FRMD1, DACT2, SMOC2, THBS2, WDR27, C6orf120, PHF10, TCTE3, C6orf70, C6orf122, C6orf208, LOC154449, DLL1, FAM120B, PSMB1, TBP, and PDCD2). Among the cases presenting distal 6q loss one sample showed a gain adjacent to the 6q loss. In particular, this sample carried in 6q27 region a focal gain from oligomer A_14_P200779 (168303033 bp) (first gained) to oligomer A_14_P120743 (170890108 bp) (last gained), containing 20 genes (MLLT4, HGC6.3, KIF25, FRMD1, DACT2, SMOC2, THBS2, WDR27, C6orf120, PHF10, TCTE3, C6orf70, C6orf122, C6orf208, LOC154449, DLL1, FAM120B, PSMB1, TBP, and PDCD2). So by subtraction we can define a critical Smallest Region of Overlap (SRO) of 2.09 Mb containing five genes T, SFT2D1, RPS6KA2, FGFR1OP, and UNC93A that met at least one of following standards: (i) decrease of expression in NB cell lines carrying 6q loss,Citation20 (ii) loss of function mutations reported in primary HR-NB tumors,Citation16 and (iii) low expression associated with worse overall HR-NB patient survival.Citation20
Neuroblastoma patient outcomes based on the expression of the genes contained in the critical SRO in distal 6q27 loss
Next, we evaluated the association of the expression of the genes contained in the critical SRO in distal 6q loss (T, SFT2D1, RP56KA2, FGFR1OP, and UNC93A genes) with HR-NB patient outcomes. We obtained online microarray analysis results of two independent RNA-sequencing datasets (SEQC n = 498 tumors; TARGET-Asgharzadeh n = 249 tumors) with available survival endpoints. T gene probe-sets (SEQC probe-set NM_003181; TARGET-Asgharzadeh probe-set 2984500), SFT2D1 gene probe-sets (SEQC probe-set NM_145169; TARGET-Asgharzadeh probe-set 2984573), RPS6KA2 gene probe-sets (SEQC probe-set NM_021135; TARGET-Asgharzadeh probe-set 2984655), FGFR1OP gene probe-sets (SEQC probe-set NM_007045; TARGET-Asgharzadeh probe-set 2936564), and UNC93A gene probe-sets (SEQC probe-set NM_018974; TARGET-Asgharzadeh probe-set 2936731) were chosen for the highest average signals for analysis. The most appropriate cutoff for survival analyses was established in the expression value where the separation of survival curves reached the maximum (log-rank test).
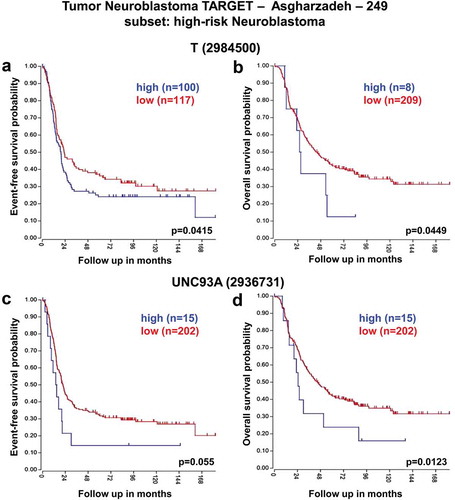
These analyses revealed that low expression of SFT2D1, RPS6KA2, and FGFR1OP genes was associated with worse event-free and overall survival of HR-NB patients consistently across the two datasets ( and ). In contrast, high expression of T and UNC93A genes was significantly associated with reduced event-free and overall survival especially in HR-NB patients ( and ).
Figure 2. Neuroblastoma high-risk patient outcomes based on SFT2D1, RPS6KA2, and FGFR1OP gene expression using the neuroblastoma SEQC-498 patient datasets. Kaplan–Meier analyses and comparison of SFT2D1, RPS6KA2, and FGFR1OP expression with outcome. HR-NB patients were divided into high (blue) and low (red) gene expression groups, with patient numbers in parentheses. (a) Event-free survival (Expression cutoff: 7.931, min.grp = 8), and (b) overall survival (Expression cutoff: 7.840, min.grp = 8) curves for SFT2D1 gene expression are shown. (c) Event-free survival (Expression cutoff: 25.386, min.grp = 8), and (d) overall survival (Expression cutoff: 25.386, min.grp = 8) curves for RPS6KA2 gene expression are shown. (e) Event-free survival (Expression cutoff: 17.599, min.grp = 8), and (f) overall survival (Expression cutoff: 17.484, min.grp = 8) curves for FGFR1OP gene expression are shown.
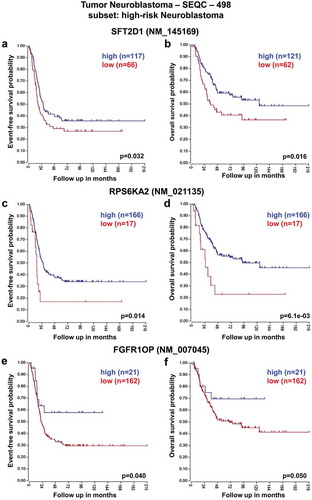
Figure 3. Neuroblastoma high-risk patient outcomes based on SFT2D1, RPS6KA2, and FGFR1OP gene expression using the neuroblastoma TARGET-Asgharzadeh-249 patient datasets. Kaplan–Meier analyses and comparison of SFT2D1, RPS6KA2, and FGFR1OP expression with outcome. HR-NB patients were divided into high (blue) and low (red) gene expression groups, with patient numbers in parentheses. (a) Event-free survival (Expression cutoff: 153.312, min.grp = 8), and (b) overall survival (Expression cutoff: 137.354, min.grp = 8) curves for SFT2D1 gene expression are shown. (c) Event-free survival (Expression cutoff: 342.241, min.grp = 8), and (d) overall survival (Expression cutoff: 221.887, min.grp = 8) curves for RPS6KA2 gene expression are shown. (e) Event-free survival (Expression cutoff: 204.725, min.grp = 8), and (f) overall survival (Expression cutoff: 219.321, min.grp = 8) curves for FGFR1OP gene expression are shown.
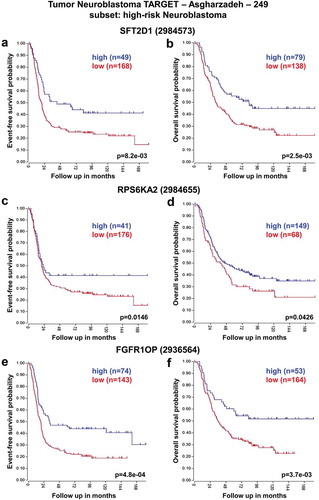
Figure 4. Neuroblastoma high-risk patient outcomes based on T, and UNC93A gene expression using the neuroblastoma SEQC-498 patient datasets. Kaplan–Meier analyses and comparison of T, and UNC93A expression with outcome. HR-NB patients were divided into high (blue) and low (red) gene expression groups, with patient numbers in parentheses. (a) Event-free survival (Expression cutoff: 1.010, min.grp = 8), and (b) overall survival (Expression cutoff: 1.089, min.grp = 8) curves for T gene expression are shown. (c) Event-free survival (Expression cutoff: 1.086, min.grp = 8), and (d) overall survival (Expression cutoff: 1.010, min.grp = 8) curves for UNC93A gene expression are shown.
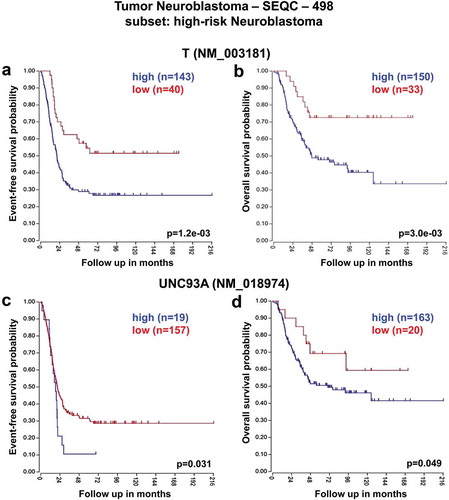
Figure 5. Neuroblastoma high-risk patient outcomes based on T, and UNC93A gene expression using the neuroblastoma TARGET-Asgharzadeh-249 patient datasets. Kaplan–Meier analyses and comparison of T, and UNC93A expression with outcome. HR-NB patients were divided into high (blue) and low (red) gene expression groups, with patient numbers in parentheses. (a) Event-free survival (Expression cutoff: 87.284, min.grp = 8), and (b) overall survival (Expression cutoff: 108.851, min.grp = 8) curves for T gene expression are shown. (c) Event-free survival (Expression cutoff: 50.677, min.grp = 8), and (d) overall survival (Expression cutoff: 50.677, min.grp = 8) curves for UNC93A gene expression are shown.
Clinical data of HR-NB patients carrying 6q loss
Clinical and demographic data for all 15 HR-NB patients carrying 6q loss are presented in . Amplification of MYCN is highly recurrent and associated with poor prognosis of NB patients, and is used to categorize the patients as high-risk, but in our dataset only 3 patients out of 15 harbored MYCN amplification. The patients of our dataset have had indeed a very poor outcome; all died of the disease.
Discussion
Outcome for children affected by HR-NB remains poor despite decades of research; then additional understanding of the pathway involved in NB pathogenesis may lead to new therapies. Chromosome signature patterns set important prognostic information for NB patients and can identify candidate tumor-related genes.Citation21 Recently, it has been demonstrated that the distal 6q27 loss, containing 14 genes and spanning 7 Mb, distinguishes a group of HR-NB patients with poor survival outcomes.Citation20 In this paper we identified, using array comparative genomic hybridization, a minimal common region of loss on distal long arm of chromosome 6q27 spanning an area of 2.09 Mb. This region of loss overlaps the one found in HR-NB patients,Citation20 and harbored five genes: T, SFT2D1, RPS6KA2, FGFR1OP, and UNC93A. We found that low SFT2D1, RPS6KA2, FGFR1OP gene expression, and high T and UNC93A gene expression are associated with worse overall survival of HR-NB patients consistently across two independent NB RNA-sequencing datasets SEQC and TARGET-Asgharzadeh (http://r2.amc.nl). Low expression levels of SFT2D1, RPS6KA2, and FGFR1OP genes are associated with grim survival outcomes of HR-NB patients, suggesting that 6q27 loss may influence the prognosis through the deregulation of multiple independent pathways. These results suggested that SFT2D1, RPS6KA2, and FGFR1OP genes may act as tumor suppressor genes in human NB; however, further functional studies are required. These three genes have important functions in controlling cell growth and differentiation, and are expressed in various tissues and organs including adrenal glands. SFT2D1 gene is implicated in the fusion of transport vesicles originated from the endocytic compartment with the Golgi complex.Citation22 RPS6KA2 gene is a putative tumor suppressor gene in epithelial ovarian cancer:Citation23 It is characterized by monoallelic expression in the normal ovarian epithelium, predisposing the cancer cells to complete loss of function in the context of a mutation of the single expressed allele.Citation24 FGFR1OP gene encodes a centrosomal protein that is required for anchoring microtubules to sub-cellular structures.Citation25 SFT2D1, RPS6KA2, and FGFR1OP gene expression is decreased in NB cell lines carrying 6q loss,Citation20 loss of function mutations have been described in primary HR-NB tumors,Citation16 and low expression is associated with grim overall survival of HR-NB patients.Citation20 Moreover, FGFR1OP gene is involved in proliferation and differentiation of the erythroid lineage.Citation26 Interestingly, a recent study observed an abnormal erythrocyte maturation in children with NB.Citation27 It is possible that haploinsufficiency of FGFR1OP could be contributing to an abnormal erythropoiesis and a decreased number of circulating red blood cells as observed in NB patients.
In conclusion, we have identified a critical SRO in distal 6q27 loss that pinpointed three genes SFT2D1, RPS6KA2, and FGFR1OP that might be tightly correlated with aggressive NB. Further functional studies will be essential to confirm the presumed tumor suppressor gene(s) located within distal 6q27 region. Our findings may be translated to clinical assistance in the future, including prognosis prediction and disease prevention for HR-NB patients.
Patients and methods
Patients and tumor samples
We recovered 15 primary untreated HR-NB patients diagnosed by the Italian Association of Italian Pediatric Hematology and Oncology (AIEOP). These patients harbored tumors with chromosome 6q loss determined by array-CGH. The 15 HR-NB patients, as established by the International Neuroblastoma Risk Group (INRG) classification,Citation28 were enrolled in the HR-NBL-1 protocol (SIOPEN).Citation29 The clinical characteristics of NB patients were derived from the Italian Neuroblastoma Registry (INBR) of AIEOP, and stored in a secure system at IRCCS Giannina Gaslini, Genova, Italy. This study was approved by the Institutional Ethics Committee of Regione Liguria (Prot. n° IGG-NCA-AP-2016). Tissue samples were collected upon acceptance of written informed consent.
Genomic profile determination
We analyzed the genome-wide copy number variations for 15 frozen NB samples by array-CGH using Human Genome CGH Microarray 4x180K Kit (Agilent Technologies, Santa Clara, California, CA, USA), as previously described.Citation30
Statistical analysis
The statistical analysis was conducted with the R programming language. Differences between NB groups were showed in the figures. Experimental sample numbers (n) are pointed out in the figures, figure legends, and Results section. P values < .05 were considered statistically significant. We inquired for any association between T, SFT2D1, RP56KA2, FGFR1OP, and UNC93A gene expression and NB patient survival using two large NB tumor datasets with available survival endpoints via the R2 Genomic Analysis and Visualization Platform (http://r2.amc.nl; SEQC n = 498 and TARGET-Asgharzadeh n = 249; –).
Disclosure of potential conflicts of interest
The authors declare that they have no conflict of interest.
Acknowledgments
This work is supported by Cinque per mille dell’IRPEF Finanziamento della Ricerca Sanitaria, Finanziamento Ricerca Corrente Ministero della Salute, Compagnia di San Paolo, and Fondazione Italiana Neuroblastoma. The authors thank the AIEOP for tumor sample collection, and the Italian Neuroblastoma Registry (INBR). MM is a fellow of Fondazione Italiana Neuroblastoma.
References
- Irwin MS, Park JR. Neuroblastoma: paradigm for precision medicine. Pediatr Clin North Am. 2015;62:225–256. PMID:25435121. doi:10.1016/j.pcl.2014.09.015.
- Cheung NK, Dyer MA. Neuroblastoma: developmental biology, cancer genomics and immunotherapy. Nat Rev Cancer. 2013;13:397–11. PMID:23702928. doi:10.1038/nrc3526.
- Hero B, Simon T, Spitz R, Ernestus K, Gnekow AK, Scheel-Walter HG, Schwabe D, Schilling FH, Benz-Bohm G, Berthold F. Localized infant neuroblastomas often show spontaneous regression: results of the prospective trials NB95-S and NB97. J Clin Oncol. 2008;26:1504–1510. PMID:18349403. doi:10.1200/JCO.2007.12.3349.
- Morgenstern DA, Bagatell R, Cohn SL, Hogarty MD, Maris JM, Moreno L, Park JR, Pearson AD, Schleiermacher G, Valteau-Couanet D, et al. The challenge of defining “ultra-high-risk” neuroblastoma. Pediatr Blood Cancer. 2019;16:e27556. PMID:30479064. doi:10.1002/pbc.27556.
- Simon T, Berthold F, Borkhardt A, Kremens B, De Carolis B, Hero B. Treatment and outcomes of patients with relapsed, high-risk neuroblastoma: results of German trials. Pediatr Blood Cancer. 2011;56:578–583. PMID:21298742. doi:10.1002/pbc.22693.
- Cohn SL, Pearson AD, London WB, Monclair T, Ambros PF, Brodeur GM, Faldum A, Hero B, Iehara T, Machin D, et al. The International Neuroblastoma Risk Group (INRG) classification system: an INRG task force report. J Clin Oncol. 2009;27:289–297. PMID:19047291. doi:10.1200/JCO.2008.16.6785.
- Maris JM. Recent advances in neuroblastoma. N Engl J Med. 2010;362:2202–2211. PMID:20558371. doi:10.1056/NEJMra0804577.
- Bown N, Cotterill S, Lastowska M, O’Neill S, Pearson AD, Plantaz D, Meddeb M, Danglot G, Brinkschmidt C, Christiansen H, et al. Gain of chromosome arm 17q and adverse outcome in patients with neuroblastoma. N Engl J Med. 1999;340:1954–1961. PMID:10379019. doi:10.1056/NEJM199906243402504.
- Attiyeh EF, London WB, Mossé YP, Wang Q, Winter C, Khazi D, McGrady PW, Seeger RC, Look AT, Shimada H, et al. Chromosome 1p and 11q deletions and outcome in neuroblastoma. N Engl J Med. 2005;353:2243–2253. PMID:16306521. doi:10.1056/NEJMoa052399.
- Caron H, van Sluis P, de Kraker J, Bökkerink J, Egeler M, Laureys G, Slater R, Westerveld A, Voûte PA, Versteeg R, et al. Allelic loss of chromosome 1p as a predictor of unfavorable outcome in patients with neuroblastoma. N Engl J Med. 1996;334:225–230. PMID:8531999. doi:10.1056/NEJM199601253340404.
- Cheung NK, Zhang J, Lu C, Parker M, Bahrami A, Tickoo SK, Heguy A, Pappo AS, Federico S, Dalton J, et L. Association of age at diagnosis and genetic mutations in patients with neuroblastoma. J Am Med Assoc. 2012;307:1062–1071. PMID:22416102. doi:10.1001/jama.2012.228.
- Janoueix-Lerosey I, Schleiermacher G, Michels E, Mosseri V, Ribeiro A, Lequin D, Vermeulen J, Couturier J, Peuchmaur M, Valent A, et al. Overall genomic pattern is a predictor of outcome in neuroblastoma. J Clin Oncol. 2009;27:1026–1033. PMID:19171713. doi:10.1200/JCO.2008.16.0630.
- Tolbert VP, Matthay KK. Neuroblastoma: clinical and biological approach to risk stratification and treatment. Cell Tissue Res. 2018;372:195–209. PMID:29572647. doi:10.1007/s00441-018-2821-2.
- Louis CU, Shohet JM. Neuroblastoma: molecular pathogenesis and therapy. Annu Rev Med. 2015;66:49–63. PMID:25386934. doi:10.1146/annurev-med-011514-023121.
- Mosse YP, Diskin SJ, Wasserman N, Rinaldi K, Attiyeh EF, Cole K, Jagannathan J, Bhambhani K, Winter C, Maris JM, et al. Neuroblastomas have distinct genomic DNA profiles that predict clinical phenotype and regional gene expression. Genes Chromosomes Cancer. 2007;46:936–949. PMID:17647283. doi:10.1002/gcc.20477.
- Pugh TJ, Morozova O, Attiyeh EF, Asgharzadeh S, Wei JS, Auclair D, Carter SL, Cibulskis K, Hanna M, Kiezun A, et al. The genetic landscape of high-risk neuroblastoma. Nat Genet. 2013;45:279–284. PMID:23334666. doi:10.1038/ng.2529.
- Molenaar JJ, Koster J, Zwijnenburg DA, van Sluis P, Valentijn LJ, van der Ploeg I, Hamdi M, van Nes J, Westerman BA, van Arkel J, et al. Sequencing of neuroblastoma identifies chromothripsis and defects in neuritogenesis genes. Nature. 2012;483:589–593. PMID:22367537. doi:10.1038/nature10910.
- Sausen M, Leary RJ, Jones S, Wu J, Reynolds CP, Liu X, Blackford A, Parmigiani G, Diaz LA, Papadopoulos N, et al. Integrated genomic analyses identify ARID1A and ARID1B alterations in the childhood cancer neuroblastoma. Nat Genet. 2013;45:12–17. PMID:23202128. doi:10.1038/ng.2493.
- Ognibene M, Pagnan G, Marimpietri D, Cangelosi D, Cilli M, Benedetti MC, Boldrini R, Garaventa A, Frassoni F, Eva A, et al. CHL1 gene acts as a tumor suppressor in human neuroblastoma. Oncotarget. 2018;9:25903–25921. PMID:29899830. doi:10.18632/oncotarget.25403.
- Depuydt P, Boeva V, Hocking TD, Cannoodt R, Ambros IM, Ambros PF, Asgharzadeh S, Attiyeh EF, Combaret V, Defferrari R, et al. Genomic amplifications and distal 6q loss: novel markers for poor survival in high-risk neuroblastoma patients. J Natl Cancer Inst. 2018;110:1084–1093. PMID:29514301. doi:10.1093/jnci/djy022.
- Vandesompele J, Baudis M, De Preter K, Van Roy N, Ambros P, Bown N, Brinkschmidt C, Christiansen H, Combaret V, Łastowska M, et al. Unequivocal delineation of clinicogenetic subgroups and development of a new model for improved outcome prediction in neuroblastoma. J Clin Oncol. 2005;23:2280–2299. PMID:15800319. doi:10.1200/JCO.2005.06.104.
- Mungall AJ, Palmer SA, Sims SK, Edwards CA, Ashurst JL, Wilming L, Jones MC, Horton R, Hunt SE, Scott CE, et al. The DNA sequence and analysis of human chromosome 6. Nature. 2003;425:805–811. PMID:14574404. doi:10.1038/nature02055.
- Trubia M, Sessa L, Taramelli R. Mammalian Rh/T2/Sglycoprotein ribonuclease family genes: cloning of a human member located in a region of chromosome 6 (6q27) frequently deleted in human malignancies. Genomics. 1997;42:342–344. PMID:9192857. doi:10.1006/geno.1997.4679.
- Bignone PA, Lee KY, Liu Y, Emilion G, Finch J, Soosay AER, Charnock FML, Beck S, Dunham I, Mungall AJ, et al. RPS6KA2, a putative tumour suppressor gene at 6q27 in sporadic epithelial ovarian cancer. Oncogene. 2007;26:683–700. PMID:16878154. doi:10.1038/sj.onc.1209827.
- Mikolajka A, Yan X, Popowicz GM, Smialowski P, Nigg EA, Holak TA. Structure of the N-terminal domain of the FOP (FGFR1OP) protein and implications for its dimerization and centrosomal localization. Mol Biol. 2006;359:863–875. PMID:16690081. doi:10.1016/j.jmb.2006.03.070.
- Guasch G, Delaval B, Arnoulet C, Xie MJ, Xerri L, Sainty D, Birnbaum D, Pébusque MJ. FOP-FGFR1 tyrosine kinase, the product of a t(6;8) translocation, induces a fatal myeloproliferative disease in mice. Blood. 2004;103:309–312. PMID:12969958. doi:10.1182/blood-2003-05-1690.
- Morandi F, Barco S, Stigliani S, Croce M, Persico L, Lagazio C, Scuderi F, Belli ML, Montera M, Cangemi G, et al. Altered erythropoiesis and decreased number of erythrocytes in children with neuroblastoma. Oncotarget. 2017;8:53194–53209. PMID:28881804. doi:10.18632/oncotarget.18285.
- Park JR, Bagatell R, Cohn SL, Pearson AD, Villablanca JG, Berthold F, Burchill S, Boubaker A, McHugh K, Nuchtern JG, et al. Revisions to the International neuroblastoma response criteria: A consensus statement from the National Cancer Institute clinical trials planning meeting. J Clin Oncol. 2017;35:2580–2587. PMID:28471719. doi:10.1200/JCO.2016.72.0177.
- Ladenstein R, Valteau-Couanet D, Brock P, Yaniv I, Castel V, Laureys G, Malis J, Papadakis V, Lacerda A, Ruud E, et al. Randomized Trial of prophylactic granulocyte colony-stimulating factor during rapid COJEC induction in pediatric patients with high-risk neuroblastoma: the European HR-NBL1/SIOPEN study. J Clin Oncol. 2010;28:3516–3524. PMID:20567002. doi:10.1200/JCO.2009.27.3524.
- Parodi S, Pistorio A, Erminio G, Ognibene M, Morini M, Garaventa A, Gigliotti AR, Haupt R, Frassoni F, Pezzolo A. Loss of whole chromosome X predicts prognosis of neuroblastoma patients with numerical genomic profile. Pediatr Blood Cancer. 2019;66:e27635. PMID:30688024. doi:10.1002/pbc.27635.