
ABSTRACT
Patients with colorectal liver metastases (CLM) commonly receive neoadjuvant chemotherapy (NACT) prior to surgical resection. NACT may induce immunogenic cell death with subsequent recruitment of T-cells to the tumor microenvironment, which could be exploited by immune checkpoint inhibition (ICI). In theory, this could expand the use of ICI to obtain responses also in microsatellite stable colorectal cancer, but evidence to suggest optimal treatment schedules are lacking. In this study, densities of total-, cytotoxic-, helper- and regulatory T-cells were quantified by immunohistochemistry in resected CLM from 92 patients included in the OSLO-COMET trial (NCT01516710). All but one patient had microsatellite stable tumors (91/92). Associations between T-cell densities and clinicopathological parameters were analyzed. Fluoropyrimidine-based NACT (in most cases with addition of oxaliplatin or irinotecan) was administered to 45 patients completed median 8 weeks prior to surgical resection. No overall association was found between NACT administration and intratumoral T-cell densities. However, within the NACT group, a short time interval (<9.5 weeks) between NACT completion and CLM resection was strongly associated with high intratumoral T-cell densities compared to the long-interval and no NACT groups (medians 491, 236, and 292 cells/mm2, respectively; P < .0001). The results from this study suggest that the observed increase in intratumoral T-cells after NACT administration may be transient. The significance of this finding should be further explored to ensure that optimal treatment schedules are chosen for studies combining cytotoxic chemotherapy and ICI.
Introduction
Metastatic progression is the main cause of mortality in colorectal cancer (CRC), with 50% of patients presenting with colorectal liver metastases (CLM).Citation1 Surgical resection is feasible in up to 20% of patients and remains the gold standard curative treatment option, but cancer recurrence occurs in up to 70% of cases.Citation2–Citation4 Following the European Organization for Research and Treatment of Cancer Intergroup trial 40983 (NCT00006479), where perioperative chemotherapy was shown to improve progression-free survival (PFS) in patients with resectable CLM, perioperative chemotherapy has been implemented as standard-of-care in high-risk patients.Citation5 Since the majority of metastatic CRC cases are classified as microsatellite stable (MSS) and have a low tumor mutational burden, only a small proportion of CLM patients are candidates for immune checkpoint inhibition (ICI).Citation6,Citation7 In addition to microsatellite instability (MSI) and high tumor mutational burden, a high number of tumor-infiltrating T-cells are considered a predictive biomarker for response to ICI therapy.Citation8 Drugs that evoke immune activation by induction of immunogenic cell death (ICD)Citation9 could cause release of tumor-associated antigens and damage-associated molecular patterns, leading to activation of antigen-presenting cells and subsequent recruitment of effector T-cells to the tumor. In theory, this process could be exploited for combined treatment with ICI, but the evidence supporting the occurrence of chemotherapy-induced ICD has essentially been gained from preclinical studies, and evidence to suggest optimal treatment schedules are lacking.Citation10–Citation12
In a cohort of CLM resected after neoadjuvant chemotherapy (NACT) we recently identified transcriptional changes that are part of canonical pathways related to immune activation, such as natural killer cell signaling, dendritic cell maturation, leukocyte migration, and danger signaling through pattern recognition receptors.Citation13 Furthermore, in a study of locally advanced rectal cancer, we observed that increased serum levels of inducer of dendritic cell maturation, fms-like tyrosine kinase 3 ligand (Flt3L), were detected after administration of NACT.Citation14,Citation15 These observations could indicate the occurrence of ICD upon NACT exposure. In this study, we hypothesized that these previously reported putative ICD effects would result in increased density of T-cells in resected CLM after NACT exposure. The density of total (CD3+, Ttot), cytotoxic (CD8+, CTL), helper (CD4+, TH) and regulatory (FOXP3+, Treg) T-cells was investigated using immunohistochemistry in 92 patients undergoing CLM resection included in a randomized controlled trial.
Results
Clinicopathological parameters and associations with T-cell densities
Of the 92 study patients bearing a total of 144 CLM, 55 were male (60%), median age was 68 years (61–73 years), and most patients were Eastern Cooperative Oncology Group (ECOG) score 0 (n = 66; 72%) and had low clinical risk score (CRS) of 0–2 (n = 68; 74%). Median carcinoembryonic antigen (CEA) prior to CLM resection was 5 µg/L (IQR 3–9). The primary colorectal cancers (pCRC) included 68 (74%) located in the left colon and rectum, mostly T3 and T4 tumors (n = 86; 93%), with more than half of the cases exhibiting lymph node metastases (n = 52; 56%) (). In univariable analysis, a CEA value above the median was associated with lower Ttot values in the IT and IM regions (Supplementary Table 1).
Table 1. Clinicopathological variables.
T-cell densities in CLM
This study aimed to quantify T-cells (Ttot) and T-cell subtypes (CTL, TH, and Treg) in the following regions: Invasive margin (IM), intratumor (IT) and adjacent liver tissue (NLi) in surgical CLM specimens. The IM region contained the greatest median density of T-cells of all subtypes (). The density of Ttot in the IM region, 2360 cells/mm2 (1822–3323) was 7 times greater than in the IT region with 319 cells/mm2 (180–546) and 13 times greater than in the NLi region with 183 cells/mm2 (108–265). This study examined T-cell densities in hotspots on serial slides, and CTL and TH corresponded well to Ttot (R2 = 0.99) in IM, IT and NLi combined (). When exploring the relative T-cell densities by calculating ratios between Ttot and subtypes in each region, TH were found to constitute almost 2/3 of Ttot in the IM and IT regions, in contrast to only 1/3 in NLi (Supplementary Table 2). The density of Treg was generally very low, with 188 cells/mm2 (94–340) in the IM region, 50 cells/mm2 (26–88) in IT, and almost none found in NLi ().
Table 2. T-cell densities (cells/mm2), median (interquartile range).
Figure 1. Scatter plot showing the correlation between the total number of T-cells (Ttot) and the sum of cytotoxic and helper T-cell subtypes (CTL and TH) in all tumor regions and adjacent liver tissue. The diagonal line indicates linear regression analysis (R2 = 0.99), suggesting that CTL and TH corresponded well to Ttot.
Variation in T-cell densities in cases with multiple metastases
For the 31 patients with multiple metastases, the median IM intra-hepatic variation was 686 cells/mm2 which was substantially lower than the inter-patient range of 4035 cells/mm2 in patients with only one metastasis (Supplementary table 3 and Supplementary Figure 1). In subsequent analyses of cases with multiple metastases, the mean T-cell densities for each case were used unless otherwise stated.
NACT administration and associations with T-cell densities
When analyzed as a dichotomous parameter (NACT versus no-NACT), NACT administration was not associated with changes in T-cell densities (Supplementary Table 1), but the variation of T-cell densities within the NACT group was substantial, and parameters related to NACT administration were therefore explored. The time interval between NACT completion and CLM resection (resection interval) within the NACT group varied considerably (3–38 weeks). In univariable analysis, a short resection interval (using the median of 8-week as a cutoff) was strongly associated with a high Ttot density in the IT with no difference found in the IM or NLi regions. The number of administered NACT cycles, the choice of NACT regimen, and radiologically assessed response to NACT were not associated with T-cell densities (Supplementary Table 1). In multivariable binary logistic regression analysis including resection interval, age, gender and CEA, only a short resection interval was associated with an increased likelihood of a T-cell density above the cohort median compared to a long resection interval (odds ratio 4.78 (95% CI 1.19–19.19), P = .001) and No-NACT (odds ratio 4.68 (95% CI 1.5–15.70), P = .05) (Supplementary table 4).
To further refine a cutoff for the resection interval, receiver operating characteristics (ROC) analysis was performed, which identified 9.5 weeks as the time interval that most significantly separated cases with high and low T-cell densities (area under the curve 0.78; 95% CI 0.68–0.88; P < .0001). Using the 9.5-week cutoff, 30 patients (bearing 54 tumors) had a short NACT-CLM resection interval (short-interval group) and 15 patients (bearing 33 tumors) had a long interval (long-interval group). Including all metastases in the analysis, the short-interval group had a Ttot density in the IT region twice that of the long-interval group (491 cells/mm2 (271–926) versus 236 cells/mm2 (102–323), respectively; P < .0001), and significantly greater than the no-NACT group (292 cells/mm2 (187–491)) () (Supplementary table 5). Differences of similar magnitude were observed for all T-cell subtypes (CTL, TH and Treg) in the IT region (, and Supplementary table 5).
Figure 2. Dot density plots of intratumoral T-cell densities (cells/mm2) in the NACT subgroups.
Light gray circles, No-NACT group (n = 57 tumors); dark gray triangles, short-interval group (n = 54 tumors); and open circles, long-interval group (n = 33 tumors). Group median is indicated by the horizontal lines. Subgroups are compared pairwise, and significant differences are indicated: *, P < .05; **, P < .01; ***, P < .001; ****, P < .0001. a) Ttot, total amount of T-cells, b) CTL, cytotoxic T-cells, c) TH, helper T-cells, d) Treg, regulatory T-cells
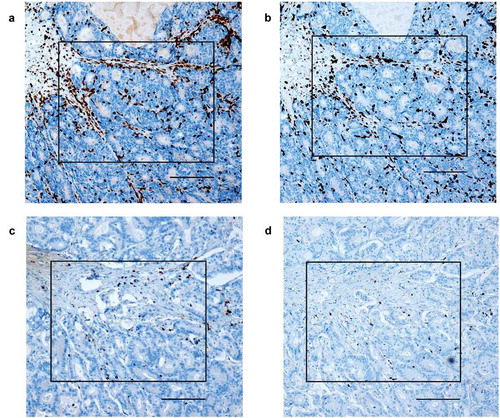
Figure 3. Representative immunohistochemistry images from the intratumoral region of two cases with colorectal liver metastasis. Sections were stained to detect the total amount of T-cells (CD3+) and cytotoxic T-cells (CD8+). On serial slides, corresponding hotspots were selected to quantify T-cells for each case, shown by the black rectangles. (Images were acquired at 4x magnification and the black line represents 0.2 mm).
Case 1 (short-interval NACT subgroup): (a) total number of T-cells. (b) cytotoxic T-cells. Case 2 (no NACT subgroup): (c) total number of T-cells. (d) cytotoxic T-cells
When exploring T-cell densities in the NLi region, no associations were observed between NACT administration subgroups and T-cell populations (Supplementary table 5). In IM, however, the densities of Ttot (Supplementary Figure 2a) and TH (Supplementary Figure 2c) were lower in the long-interval group compared to the no-NACT and short-interval groups, while the Treg density was similar to the short-interval group (Supplementary Figure 2d and Supplementary table 5). In contrast, in IT, for Treg:CTL the opposite was observed, where the long-interval group had a significantly higher Treg:CTL ratio compared to the short-interval group (0.60 (0.21–1.30) versus 0.29 (0.20–0.53) P = .04) (Supplementary Figure 3 and Supplementary table 6).
MSI analysis and expression of programmed death-ligand 1 (PD-L1)
Only one case was classified as MSI, the remaining being MSS. Interestingly, the only MSI patient was in the no-NACT group and displayed an IT Ttot density of 455 cells/mm2 which was higher than the cohort median of 319 cells/mm2, and CTL density was almost twice as high, 212 cells/mm2 compared to 118 cells/mm2 in cohort median. In IM, the MSI patient had a similar T-cell density to cohort median (). PD-L1 expression was <1% in the analyzed cases, with the exception of one case, where PD-L1 expression was between 1-5% (Supplementary figure 4).
Long-term outcome and associations with clinicopathological parameters and T-cell densities
The median follow-up time after CLM resection was 63 months (95% CI, 61–64), during which time 47 patients had died, and the 5-year overall survival (OS) was 51%. Estimated median OS for study patients was 61 months. The median PFS was 19 months (95% CI: 11–27) with a median follow-up time of 57 months (95% CI: 51–62). Sixty-nine of the 92 patients experienced the following PFS events (first registered event): recurrent liver metastases (n = 27); lung metastases (n = 7); other metastatic sites (n = 11); multiple metastatic sites (n = 15); other cancer (n = 6); and death without known cancer recurrence (n = 3). Three parameters were associated with inferior OS (Supplementary table 7); pCRC N2 stage (Hazard ratio (HR) 2.7 (1.4–5.22), P < .0001), age (HR 1.05 (1.01–1.08), P = .01) and poor performance status (ECOG 1–2; HR 2.12 (1.13–3.96), P = .02). ECOG 1–2 was also associated with worse PFS (HR 2.44 (1.32–4.50), P = .004), while N2 stage and age were not. Specifically, CRS, NACT administration, T-cell densities, and NACT subgroup did not exhibit association with long-term outcome (neither OS nor PFS) (Supplementary table 8).
Discussion
The main finding of this study was that the median density of T-cells in the IT region was substantially increased in the group resected within a short-interval (<9.5 weeks) following NACT completion, whereas the long-interval group displayed T-cell levels comparable to or lower than what was observed in no-NACT group. Our identification of a subgroup of cases that did not exhibit T-cell infiltration after NACT administration is somewhat in contrast to other reports in the field, as most studies examining T-cell densities in resectable CLM have reported increased T-cell densities.Citation16–Citation18 Additionally, although preoperative biopsies are not generally recommended in CLM, in one small study (n = 11) an increase in CTL after NACT was demonstrated when comparing resection specimens to preoperative biopsies.Citation17 This is in line with results from a range of primary cancer entities where pretreatment biopsies and surgical resection specimens were available (including rectal cancer,Citation19,Citation20 triple-negative breast cancer,Citation21 non-small cell lung cancerCitation22 and squamous cell carcinoma of the cervixCitation23). Other studies that have analyzed tumor T-cell infiltration after NACT administration have explored patient cohorts with NACT-surgery intervals ranging between 2 and 10 weeks,Citation16,Citation17,Citation22,Citation23 corresponding well with our short-interval group, and a time-dependent decline in T-cell infiltration after NACT might not have been detected. Interestingly, in a study examining T-cell infiltration in 47 cases with resectable CLM that had completed NACT more than 12 weeks prior to CLM resection, the actual T-cell densities were of a magnitude comparable to our findings; CTL and Treg densities were similar in the NACT and no-NACT groups.Citation24 Only one of 92 tumors expressed PD-L1 above 1%, which is in accordance with previous findings in CRCCitation25 and CLM.Citation26
In addition to changes in absolute T-cell densities, interesting differences in the relative composition of T-cell subgroups were identified, exemplified by the Treg:CTL ratio in the IT region. The lowest Treg:CTL ratio was detected in the short-interval group and the highest in the long-interval group (2 times higher than the short-interval group). This finding not only suggests an attenuation of the T-cell response, but also a time-dependent relative increase of Treg, which could be hypothesized to contribute to a more immunosuppressive tumor microenvironment in the aftermath of NACT administration. To the best of our knowledge, this has not been described previously in the context of NACT administration in CLM.
In the present work, we investigated the immune response to NACT in CLM, measured by analysis of T-cell densities in available samples from the first 100 cases included in the OSLO-COMET trial. The patients enrolled had resectable metastatic disease eligible for a parenchyma-sparing procedure and a large proportion of patients displayed favorable prognostic features (left-sided pCRC, low CRS, good performance status, few metastases and response to NACT). With the primary objective of the OSLO-COMET trial being short-term surgical outcome, no protocol provisions had been made regarding NACT regimen or schedule.Citation27 Specifically, an intended time interval between NACT completion and surgery was not indicated, resulting in substantial variation in this parameter (3–38 weeks), allowing analysis regarding how this time interval was associated with the immune response.
A challenge when interpreting the data is the large variability of methods used to quantify immune cells in tissues, making comparisons between studies difficult. A number of alternative strategies have been applied to select areas for analysis, including hotspots, tissue microarrays and whole slide analysis, with additional variation in the use of manual versus automated quantification strategies.Citation28–Citation31 In our study, representative hotspot selection was verified by a pathologist, and manual counting exhibited low inter-investigator variation, ensured identification of stained cells, and allowed separate analysis of tumor regions (IT, IM and NLi). However, the method is highly labor consuming and does not account for the total number of T-cells in the entire tumor section. The hotspot method was used by Galon et al. in the seminal work where a strong association between the immunoscore (IS) and clinical outcome of patients with pCRC was established, and the IS was later validated in analyses of whole-slide images by the same investigators, suggesting that both approaches may be applied.Citation30,Citation32,Citation33
The findings in the short-interval group are in agreement with previous reports suggesting that NACT administration causes increased T-cell infiltration in CLM, possibly by ICD-related mechanisms. Since the presence of intratumoral T-cells is a prerequisite and potentially a predictive biomarker for response to ICI treatment, the finding encourages studies to explore treatment regimens where cytotoxic chemotherapy and ICI are combined. We are currently investigating the efficacy of alternate administration of the Nordic FLOX regimenCitation34 with nivolumab in metastatic CRC through the randomized METIMMOX trial (Colorectal Cancer METastasis – Shaping Anti-tumor IMMunity by OXaliplatin; NCT03388190). Importantly, the apparent time-dependent changes in tumor immune cell densities suggest that there is a window of opportunity to exploit such treatment combinations, but whether the finding can be generalized to other clinical settings is not clear. The significance of this novel finding should be further explored to ensure that optimal treatment schedules are chosen for studies combining cytotoxic chemotherapy and ICI.
Materials and methods
Patients
Patients with resectable CLM were included in the Oslo Randomized Laparoscopic Versus Open Liver Resection for Colorectal Metastases Study (OSLO-COMET trial, NCT01516710) following informed consent.Citation4 The study was approved by the Regional Committee for Health and Research Ethics in Norway (2011/1285/REK Sør-Øst B). This OSLO-COMET substudy analyzed available samples from the first 100 cases included in the trial between February 2012 and September 2013. Of these, eight cases were excluded from analysis for the following reasons: benign histology in the surgical specimen (n = 4; 2 hemangiomas, 1 focal nodular hyperplasia, and 1 fat infiltrate); metastases not resectable (n = 2); no tissue available (n = 2). In two recurrent CLM cases, the lesions were missed at surgery, but tissue from the previous CLM resection (prior to inclusion in the OSLO-COMET trial) was available for analysis. The study cohort thus consisted of 92 cases, of which 33 had more than one metastatic tumor resected (range 2–6) resulting in a total of 144 CLM for analysis. Missing clinical data was retrieved from referring hospitals. The pCRC was staged according to the TNM classification (International Union Against Cancer TNM classification 7th edition).Citation35 Performance status was classified using ECOG score.Citation36 The CRS was calculated by giving 1 point for each of the following parameters: lymph node metastases in pCRC, <12 months from pCRC to diagnosis of CLM, multiple metastases, largest metastasis > 5 cm, CEA > 200 µg/L. A CLM with CRS ≤ 2 was considered to have a low risk of colorectal cancer recurrence.Citation37
Histological assessment
Surgical specimens were formalin fixed and paraffin embedded as part of routine pathology processing, and one representative tissue block was selected for analysis from each of the144 metastatic tumors. The IM, IT and NLi regions were identified in hematoxylin and eosin stained sections, and selections were confirmed by a pathologist (Supplementary figure 5).
T-cell densities assessed by immunohistochemistry
Four-µm sections were deparaffinized and pre-treated using PT-link, and subsequently stained using the Dako EnVisionTM FLEX+ detection system (Agilent, California, USA). Serial sections were stained with antibodies for Ttot (CD3 rabbit monoclonal antibody; clone SP7; dilution 1:500, Thermo Scientific, California, USA), CTL (CD8 NovocastraTM lyophilized mouse monoclonal antibody; clone 4B11; 1:200, Leica Biosystems, Germany); TH (CD4 mouse monoclonal; clone 4B12; ready-to-use; DAKO Denmark AS), and Treg (Anti-FOXP3 antibody; clone 236A/E7; dilution 1:400; Abcam, Cambridge, United Kingdom), all with positive controls. The slides were digitized and within scanned images multiple hotspots were selected; four from the IM region; three from the IT, and two representative areas of NLi tissue, where possible. The areas were marked on the hematoxylin and eosin slides, and the corresponding regions were located on serial sections stained for detection of Ttot, CTL, TH and Treg (). T-cells were manually counted by VJD and SEM who were blinded with respect to patient characteristics, including preoperative treatment, at the time of T-cell quantification. T-cell density (cells/mm2) was calculated within each region. T-cells were counted over a median area (interquartile range, IQR) of 1.20 mm2 (1.14–1.28 mm2) in IM; 1.14 mm2 (1.14–1.15 mm2) in IT; and 0.76 mm2 (0.76–0.77 mm2) in NLi. For method validation purposes 26 tumors randomly selected from 16 patients were counted by both investigators. Linear regression analysis comparing results obtained was calculated with an R2 > 0.95 with no significant difference comparing medians for each investigator.
PD-L1 expression assessed by immunohistochemistry
One representative slide was selected for each patient and stained with anti-PD-L1 (405.9A11) mouse monoclonal antibody (Cell Signaling Technology, Danvers, Massachusetts, USA) using the Flex+ detection system. The proportion of positive cells in the IT region was assessed by a pathologist familiar with the method (MLI).Citation38
Analysis of MSI
The IdyllaTM MSI Assay from Biocartis (Mechelen, Belgium) was used according to the manufacturer’s instructions to determine whether tumors were MSS or MSI. In 56 of the 92 cases, isolated DNA was available from CLM samples as previously described,Citation13 while in 36 cases, formalin-fixed tissue was used (31 from study CLM resections and 5 using tissue from the pCRC sample, where the CLM sample contained <10% tumor tissue).
Neoadjuvant chemotherapy
Forty-five of the 92 patients (49%) received NACT, which was completed median 8 weeks (range 3–38) prior to CLM resection, with a median of 4 cycles administered (range 2–12 cycles) (). Fourteen patients out of the 47 who did not receive NACT were treated with chemotherapy after resection of the primary tumor but prior to CLM diagnosis, completed median 70 weeks (range 18–191 weeks) before CLM resection. The timing of surgery after NACT, the type of NACT regimen and the number of NACT cycles were decided by the multidisciplinary team and these parameters were not predefined by the OSLO-COMET study protocol.Citation27 All except one patient (who had oxaliplatin monotherapy) received fluoropyrimidine-based treatment with addition of oxaliplatin (n = 31, 1 with addition of epidermal growth factor receptor antibody), irinotecan (n = 6; 3 in combination with bevacizumab, 2 with epidermal growth factor receptor antibody), or were converted from oxaliplatin to irinotecan (because of toxicity or poor response; n = 3) (). Response to NACT was retrospectively quantified by a radiologist by measuring the largest diameter at baseline and preoperatively on computer tomography or magnetic resonance images. Of the 45 patients (87 metastases), 9 metastases from 4 patients had preoperative radiological images of insufficient quality for assessment of response to NACT, leaving 44 patients (78 metastases) available for radiological response evaluation. Response to NACT was classified for individual metastases as partial response (PR; ≥30% reduction of largest diameter) or stable disease (SD; <30% reduction to <20% increase in size), and progressive disease (PD; ≥20% increase of the largest diameter), using the principles of Response Evaluation Criteria in Solid Tumor 1.1 (RECIST 1.1),Citation39 no complete responses were observed. For patients with multiple metastases, an overall response per patient was calculated using the mean percentage change per patient.
Variation in intra-hepatic and inter-patient T-cell densities
Of the 33 cases with multiple metastases, 2 cases had only one metastasis available for immunohistochemistry. For each of the 31 patients with >1 metastasis available, the variation in intra-hepatic T-cell density was compared to the variation observed between patients (inter-patient variation) in the remaining cohort (59 patients). This was calculated by comparing the range of T-cell densities for all subtypes and regions in the multiple metastases to the total cohort.
Statistical analysis
Most variables were not normally distributed and were described using percentages and median with interquartile range (IQR) unless otherwise stated. Categorical variables were created from the following clinicopathological parameters by using medians as cutoff: Age, CEA (µg/L) at CLM resection, time from NACT completion to CLM resection (resection interval, weeks), number of NACT cycles, and T-cell densities (cells/mm2) (). Independent variables were compared using Mann–Whitney U for two groups, and Kruskal Wallis for three groups. Frequencies were compared using contingency tables and Chi-square. Correlations between Ttot and CTL + TH in IM, IT and NLi were analyzed by linear regression. Results were reported with R2 value and P. Univariable analyses were performed to determine associations between clinicopathological parameters and T-cell densities. Multivariable binary logistic regression analysis was performed using IT Ttot density as a dependent variable, including parameters with P < .1 from univariable analysis in addition to age and gender. P ≤ 0.05 were considered statistically significant. A ROC analysis was performed by stratifying IT Ttot into high or low using cohort median Ttot density as a state variable and the time interval from NACT completion to study CLM resection as test variable. OS was calculated from CLM resection to date of death (obtained from the Norwegian National Registry) or censor date (31 December 2017). PFS was calculated from the time of CLM resection to the first event, last radiological follow-up, or death. Univariable analyses were performed by the Kaplan–Meier method to estimate OS and PFS. Reverse Kaplan–Meier method was used to estimate median follow-up and median time to event. HR was calculated using Cox proportional hazard analysis and was reported with 95% confidence interval (CI). Data was collated and analyzed using IBM SPSS statistics software (version 25, IBM Corp, Armonk, NY).
Disclosure of Potential Conflicts of Interest
No potential conflicts of interest were disclosed.
Supplemental Material
Download Zip (1.5 MB)Acknowledgments
We would like to acknowledge the contributions from the OSLO-COMET study group, Ellen Hellesylt, Department of Pathology, Oslo University Hospital, Oslo, Norway, and Christine Penz and Lars Gustav Lyckander, Department of Pathology, Akershus University Hospital, Lørenskog, Norway.
Supplementary material
Supplemental data for this article can be accessed on the publisher’s website.
Additional information
Funding
References
- Donadon M, Ribero D, Morris-Stiff G, Abdalla EK, Vauthey JN. New paradigm in the management of liver-only metastases from colorectal cancer. Gastrointestinal Cancer Res. 2007 Jan-Feb;1(1):20–27.
- Kanas GP, Taylor A, Primrose JN, Langeberg WJ, Kelsh MA, Mowat FS, Alexander DD, Choti MA, Poston G. Survival after liver resection in metastatic colorectal cancer: review and meta-analysis of prognostic factors. Clin Epidemiol. 2012;4:283–301. doi:10.2147/CLEP.S34285.
- van Amerongen MJ, Jenniskens SFM, van den Boezem PB, Futterer JJ, de Wilt JHW. Radiofrequency ablation compared to surgical resection for curative treatment of patients with colorectal liver metastases - a meta-analysis. HPB (Oxford). 2017 Sep;19(9):749–756. doi:10.1016/j.hpb.2017.05.011.
- Fretland AA, Dagenborg VJ, Bjornelv GMW, Kazaryan AM, Kristiansen R, Fagerland MW, Hausken J, Tønnessen TI, Abildgaard A, Barkhatov L, et al. Laparoscopic versus open resection for colorectal liver metastases: the OSLO-COMET randomized controlled trial. Ann Surg. 2018 Feb;267(2):199–207. doi:10.1097/SLA.0000000000002353.
- Nordlinger B, Sorbye H, Glimelius B, Poston GJ, Schlag PM, Rougier P, Bechstein WO, Primrose JN, Walpole ET, Finch-Jones M, et al. Perioperative FOLFOX4 chemotherapy and surgery versus surgery alone for resectable liver metastases from colorectal cancer (EORTC 40983): long-term results of a randomised, controlled, phase 3 trial. Lancet Oncol. 2013 Nov;14(12):1208–1215. DOI:10.1016/S1470-2045(13)70447-9.
- Kloor M, Michel S, von Knebel Doeberitz M. Immune evasion of microsatellite unstable colorectal cancers. Int J Cancer. 2010 Sep 01;127(5):1001–1010. doi:10.1002/ijc.v127:5.
- Le DT, Uram JN, Wang H, Bartlett BR, Kemberling H, Eyring AD, Skora AD, Luber BS, Azad NS, Laheru D, et al. PD-1 blockade in tumors with mismatch-repair deficiency. N Engl J Med. 2015 Jun 25;372(26):2509–2520. doi:10.1056/NEJMoa1500596.
- Ji RR, Chasalow SD, Wang L, Hamid O, Schmidt H, Cogswell J, Alaparthy S, Berman D, Jure-Kunkel M, Siemers NO, et al. An immune-active tumor microenvironment favors clinical response to ipilimumab. Cancer Immunol ImmunoTher. 2012 Jul 01;61(7):1019–1031. doi:10.1007/s00262-011-1172-6.
- Galluzzi L, Buqué A, Kepp O, Zitvogel L, Kroemer G. Immunogenic cell death in cancer and infectious disease. Nat Rev Immunol. 2016 Oct 17. online;17:97. DOI:10.1038/nri.2016.107.
- Pfirschke C, Engblom C, Rickelt S, Cortez-Retamozo V, Garris C, Pucci F, Yamazaki T, Poirier-Colame V, Newton A, Redouane Y, et al. Immunogenic chemotherapy sensitizes tumors to checkpoint blockade therapy. Immunity. 2016 Feb 16;44(2):343–354. doi:10.1016/j.immuni.2015.11.024.
- Dosset M, Vargas TR, Lagrange A, Boidot R, Vegran F, Roussey A, Chalmin F, Dondaine L, Paul C, Marie-Joseph EL, et al. PD-1/PD-L1 pathway: an adaptive immune resistance mechanism to immunogenic chemotherapy in colorectal cancer. (2162-4011 (Print)). doi:10.1080/2162402X.2018.1433981.
- Trujillo JA, Sweis RF, Bao R, Luke JJ. T cell–inflamed versus non-t cell–inflamed tumors: a conceptual framework for cancer immunotherapy drug development and combination therapy selection. Cancer Immuno Res. 2018;6(9):990. doi:10.1158/2326-6066.CIR-18-0277.
- Ostrup O, Dagenborg VJ, Rodland EA, Skarpeteig V, Silwal-Pandit L, Grzyb K, Berstad AE, Fretland ÅA, Mælandsmo GM, Børresen-Dale AL, et al. Molecular signatures reflecting microenvironmental metabolism and chemotherapy-induced immunogenic cell death in colorectal liver metastases. Oncotarget. 2017 Sep 29;8(44):76290–76304. doi:10.18632/oncotarget.v8i44.
- Kalanxhi E, Meltzer S, Schou JV, Larsen FO, Dueland S, Flatmark K, Jensen BV, Hole KH, Seierstad T, Redalen KR, et al. Systemic immune response induced by oxaliplatin-based neoadjuvant therapy favours survival without metastatic progression in high-risk rectal cancer. Br J Cancer. 2018 May 01;118(10):1322–1328. doi:10.1038/s41416-018-0085-y.
- Meltzer S, Kalanxhi E, Hektoen HH, Dueland S, Flatmark K, Redalen KR, Ree AH. Systemic release of osteoprotegerin during oxaliplatin-containing induction chemotherapy and favorable systemic outcome of sequential radiotherapy in rectal cancer. Oncotarget. 2016 Jun 7;7(23):34907–34917. doi:10.18632/oncotarget.v7i23.
- Tanis E, Julie C, Emile JF, Mauer M, Nordlinger B, Aust D, Roth A, Lutz MP, Gruenberger T, Wrba F, et al. Prognostic impact of immune response in resectable colorectal liver metastases treated by surgery alone or surgery with perioperative FOLFOX in the randomised EORTC study 40983. Eur J Cancer. 2015 Nov;51(17):2708–2717. DOI:10.1016/j.ejca.2015.08.014.
- Ledys F, Klopfenstein Q, Truntzer C, Arnould L, Vincent J, Bengrine L, Remark R, Boidot R, Ladoire S, Ghiringhelli F, et al. RAS status and neoadjuvant chemotherapy impact CD8+ cells and tumor HLA class I expression in liver metastatic colorectal cancer. J ImmunoTher Cancer. 2018;6(1):123. doi:10.1186/s40425-018-0438-3.
- Inoue Y, Hazama S, Suzuki N, Tokumitsu Y, Kanekiyo S, Tomochika S, Tsunedomi R, Tokuhisa Y, Iida M, Sakamoto K, et al. Cetuximab strongly enhances immune cell infiltration into liver metastatic sites in colorectal cancer. Cancer Sci. 2017;108(3):455–460. doi:10.1111/cas.13162.
- Ogura A, Akiyoshi T, Yamamoto N, Kawachi H, Ishikawa Y, Mori S, Oba K, Nagino M, Fukunaga Y, Ueno M. et al. Pattern of programmed cell death-ligand 1 expression and CD8-positive T-cell infiltration before and after chemoradiotherapy in rectal cancer. Eur J Cancer. 2018 Mar 01;91:11–20. DOI:10.1016/j.ejca.2017.12.005.
- Matsutani S, Shibutani M, Maeda K, Nagahara H, Fukuoka T, Nakao S, Hirakawa K, Ohira M. Significance of tumor-infiltrating lymphocytes before and after neoadjuvant therapy for rectal cancer. Cancer Sci. 2018;109(4):966–979. doi:10.1111/cas.2018.109.issue-4.
- Miyashita M, Sasano H, Tamaki K, Hirakawa H, Takahashi Y, Nakagawa S, Watanabe G, Tada H, Suzuki A, Ohuchi N, et al. Prognostic significance of tumor-infiltrating CD8+ and FOXP3+ lymphocytes in residual tumors and alterations in these parameters after neoadjuvant chemotherapy in triple-negative breast cancer: a retrospective multicenter study. Breast Cancer Res. 2015;17(1):124. doi:10.1186/s13058-015-0632-x.
- Parra ER, Villalobos P, Behrens C, Jiang M, Pataer A, Swisher SG, William WN, Zhang J, Lee J, Cascone T, et al. Effect of neoadjuvant chemotherapy on the immune microenvironment in non-small cell lung carcinomas as determined by multiplex immunofluorescence and image analysis approaches. J ImmunoTher Cancer. 2018;6(1):48. doi:10.1186/s40425-018-0368-0.
- Liang Y, Lü W, Zhang X, Lü B. Tumor-infiltrating CD8+ and FOXP3+ lymphocytes before and after neoadjuvant chemotherapy in cervical cancer. Diagn Pathol. 2018;13(1):93. doi:10.1186/s13000-018-0770-4.
- Sideras K, Galjart B, Vasaturo A, Pedroza-Gonzalez A, Biermann K, Mancham S, Nigg AL, Hansen BE, Stoop HA, Zhou G, et al. Prognostic value of intra-tumoral CD8(+)/FoxP3(+) lymphocyte ratio in patients with resected colorectal cancer liver metastasis. J Surg Oncol. 2018;118(1):68–76. doi:10.1002/jso.25091.
- Rosenbaum MW, Bledsoe JR, Morales-Oyarvide V, Huynh TG, Mino-Kenudson M. PD-L1 expression in colorectal cancer is associated with microsatellite instability, BRAF mutation, medullary morphology and cytotoxic tumor-infiltrating lymphocytes. Mod Pathol. 2016 Sep 01;29(9):1104–1112. doi:10.1038/modpathol.2016.95.
- D’Alterio C, Nasti G, Polimeno M, Ottaiano A, Conson M, Circelli L, Botti G, Scognamiglio G, Santagata S, De Divitiis C, et al. CXCR4-CXCL12-CXCR7, TLR2-TLR4, and PD-1/PD-L1 in colorectal cancer liver metastases from neoadjuvant-treated patients. Oncoimmunology. 2016;5(12):e1254313–e. doi:10.1080/2162402X.2016.1254313.
- Fretland AA, Kazaryan AM, Bjornbeth BA, Flatmark K, Andersen MH, Tonnessen TI, Bjørnelv GMW, Fagerland MW, Kristiansen R, Øyri K, et al. Open versus laparoscopic liver resection for colorectal liver metastases (the Oslo-CoMet Study): study protocol for a randomized controlled trial. Trials. 2015;16:73. doi:10.1186/s13063-015-0577-5.
- Halama N, Michel S, Kloor M, Zoernig I, Benner A, Spille A, Pommerencke T, von Knebel DM, Folprecht G, Luber B, et al. Localization and density of immune cells in the invasive margin of human colorectal cancer liver metastases are prognostic for response to chemotherapy. Cancer Res. 2011;71(17):5670. doi:10.1158/0008-5472.CAN-11-0268.
- Galon J, Costes A, Sanchez-Cabo F, Kirilovsky A, Mlecnik B, Lagorce-Pagès C, Tosolini M, Camus M, Berger A, Wind P, et al. Type, density, and location of immune cells within human colorectal tumors predict clinical outcome. Science. 2006;313(5795):1960. doi:10.1126/science.1129139.
- Mlecnik B, Van den Eynde M, Bindea G, Church SE, Vasaturo A, Fredriksen T, Lafontaine L, Haicheur N, Marliot F, Debetancourt D, et al. Comprehensive intrametastatic immune quantification and major impact of immunoscore on survival. JNCI. 2018;110(1):djx123–djx. doi:10.1093/jnci/djx123.
- Katz SC, Bamboat ZM, Maker AV, Shia J, Pillarisetty VG, Yopp AC, Hedvat CV, Gonen M, Jarnagin WR, Fong Y, et al. Regulatory T Cell Infiltration Predicts Outcome Following Resection of Colorectal Cancer Liver Metastases. Ann Surg Oncol. 2013 Sep 26;20(3):946–955. doi:10.1245/s10434-012-2668-9.
- Galon J, Pages F, Marincola FM, Angell HK, Thurin M, Lugli A, Zlobec I, Berger A, Bifulco C, Botti G, et al. Cancer classification using the Immunoscore: a worldwide task force. J Transl Med. 2012 Oct;3(10):205. DOI:10.1186/1479-5876-10-205.
- Galon J, Pagès F, Marincola FM, Thurin M, Trinchieri G, Fox BA, Gajewski TF, Ascierto PA. The immune score as a new possible approach for the classification of cancer. J Transl Med. 2012 Jan 03;10(1):1. doi:10.1186/1479-5876-10-1.
- Sorbye H, Glimelius B, Berglund A, Fokstuen T, Tveit KM, Braendengen M, Øgreid D, Dahl O. Multicenter phase II study of Nordic fluorouracil and folinic acid bolus schedule combined with oxaliplatin as first-line treatment of metastatic colorectal cancer. J Clin Oncol. 2004 Jan 1;22(1):31–38. doi:10.1200/JCO.2004.05.188.
- Sobin LHGM, Wittekind C, editors. TNM Classification of Malignant Tumours. 7th ed. International Union Against Cancer (UICC). Hoboken (NJ): Wiley-Blackwell; 2010.
- Oken MM, Creech RH, Tormey DC, Horton J, Davis TE, McFadden ET, Carbone PP. Toxicity and response criteria of the Eastern Cooperative Oncology Group. Am J Clin Oncol. 1982 Dec;5(6):649–655. doi:10.1097/00000421-198212000-00014.
- Fong Y, Fortner J, Sun RL, Brennan MF, Blumgart LH. Clinical score for predicting recurrence after hepatic resection for metastatic colorectal cancer: analysis of 1001 consecutive cases. Ann Surg. 1999 Sep;230(3):309–318. discussion 18–21. doi:10.1097/00000658-199909000-00004.
- Ojlert AK, Halvorsen AR, Nebdal D, Lund-Iversen M, Solberg S, Brustugun OT, Lingjaerde OC, Helland Å. The immune microenvironment in non-small cell lung cancer is predictive of prognosis after surgery. Mol Oncol. 2019 May;13(5):1166–1179. doi:10.1002/1878-0261.12475.
- Eisenhauer EA, Therasse P, Bogaerts J, Schwartz LH, Sargent D, Ford R, Dancey J, Arbuck S, Gwyther S, Mooney M, et al. New response evaluation criteria in solid tumours: revised RECIST guideline (version 1.1). Eur J Cancer. 2009 Jan;45(2):228–247. DOI:10.1016/j.ejca.2008.10.026.