
ABSTRACT
Within the microenvironment of solid tumors, stress associated with deficit of nutrients and oxygen as well as tumor-derived factors triggers the phosphorylation-dependent degradation of the IFNAR1 chain of type I interferon (IFN1) receptor and ensuing suppression of the IFN1 pathway. Here we sought to examine the importance of these events in malignant mammary cells. Expression of non-degradable IFNAR1S526A mutant in mouse mammary adenocarcinoma cells stimulated the IFN1 pathway yet did not affect growth of these cells in vitro or ability to form subcutaneous tumors in the syngeneic mice. Remarkably, these cells exhibited a notably accelerated growth when transplanted orthotopically into mammary glands. Importantly, in human patients with either ER+ or ER- breast cancers, high levels of IFNAR1 were associated with poor prognosis. We discuss the putative mechanisms underlying the pro-tumorigenic role of IFNAR1 in malignant breast cells.
Introduction
Type 1 interferons (IFN1) are important anti-tumorigenic cytokines that are known to inhibit tumor development, growth, and progression through multiple direct and indirect mechanisms (reviewed inCitation1-Citation4). All effects of IFN1 are mediated by IFN-stimulated genes (ISGs), which are induced through IFN1 receptor (composed by two chains, IFNAR1 and IFNAR2) followed by activation of the JAK-STAT and other signaling pathways. Cell surface levels of IFNAR1 determine the responsiveness of cells to IFN1 and the maintenance of IFNAR1 expression is essential for anti-tumor responses (reviewed inCitation2,Citation3,Citation5). Furthermore, this receptor is also required for supporting the efficacy of diverse types of anti-cancer therapies including chemotherapy, radiotherapy, molecularly targeted and immune therapies (reviewed inCitation1,Citation2).
The levels of IFNAR1 are negatively regulated by its phosphorylation-dependent ubiquitination and degradation;Citation6 this proteolytic loss of IFNAR1 prevents all cell types from responding to IFN1 (reviewed inCitation2,Citation5). Importantly, degradation and downregulation of IFNAR1 is accelerated by numerous factors that are present in the malignant cells and in tumor microenvironment. These factors include activation of danger- and pathogen-recognition receptors,Citation7 vascular endothelial growth factorCitation8 and inflammatory cytokines,Citation9 tumor-derived extracellular vesicles,Citation10 oncogenic signaling,Citation11 and a deficit of oxygen and nutrients.Citation12 All these and probably other factors suppress IFN1 pathway in malignant, immune, and stromal cells within a tumor.Citation13,Citation14 Accordingly, loss of IFNAR1 is associated with poor prognosis in patients with melanomas and colorectal cancers.Citation13,Citation14
The importance of inactivation of IFNAR1 in other types of cancers such as breast cancer is not well understood. Moreover, current state of the literature suggests a possibility for both pro- and anti-tumorigenic roles of IFN1 in breast cancers. On one hand, the activity of IRF7, a key factor in inducing production of IFN1 and driving the IFN1 pathway in mammary malignant cells was shown to be essential for suppressing disease progression and bone metastases.Citation15 Expression of IFNAR1 in the tumor microenvironment played a key role in the immune defenses against mammary adenocarcinoma in many experimental settings.Citation16 Finally, combination of IFN1 with immune therapies in the neoadjuvant setting demonstrated a clear benefitCitation17 further supporting additional evidence for the anti-tumorigenic role of the IFN1 pathway in breast cancers.Citation18,Citation19
On another hand, clinical trial data demonstrated a very limited efficacy of pharmacological IFN1-based drugs in patients with breast cancer (reviewed inCitation2,Citation20). Intriguingly, the IFN1-driven gene signature in patients with breast cancers was associated with resistance to chemo/radiotherapy and poor prognosis.Citation21,Citation22 In addition, breast cancer cells upregulating the IFN1 production upon absorbing exosomes from neighboring fibroblasts also demonstrated an increased resistance to chemotherapeutic agents.Citation23 These results are consistent with a putative pro-tumorigenic role of the IFN1 pathway in some contexts of breast cancer pathogenesis. Here we sought to determine the importance of IFNAR1 in breast tumors using immunocompetent mouse models and human patient samples.
Results
Previous studies aimed at understanding the role of the phosphorylation-dependent ubiquitination and degradation of IFNAR1 utilized the expression of the IFNAR1 mutant lacking key phosphorylation Ser sites and therefore resistant to phosphorylation-dependent ubiquitination and degradation (IFNAR1SA, henceforth, “SA”).Citation6 The effects of expression of this mutant in malignant cells varied: an inhibition of cell proliferation was observed in humanCitation24 and mouseCitation13 melanoma but not in colorectal adenocarcinoma cells.Citation14
Here we sought to determine the role of IFNAR1 and IFN1 signaling in mammary adenocarcinoma. We generated E0771-tdTomato and AT-3 mouse mammary adenocarcinoma cell lines stably expressing the SA mutant. Expression of this stabilized receptor let to a robust up-regulation of the cell surface IFNAR1 levels (,b). In addition, these cells exhibited an enhanced induction of IFN1 signaling () and expression of ISGs (). Intriguingly, SA-harboring cells did not differ from their control counterparts in the rates of proliferation in vitro (,f). Furthermore, expression of SA did not affect the rate of growth of the subcutaneous tumors in the syngeneic mice (). These results suggest the lack of the direct cell-autonomous effect of the IFN1 pathway in murine mammary adenocarcinomas.
Figure 1. Expression of SA-GFP in breast cancer cells does not affect proliferation in vitro. (a, b) Representative histograms of IFNAR1 cell surface levels measured by flow cytometry on GFP and SA-GFP E0771 (a) and AT-3 cells (b). (c) Immunoblot analysis of activated (pSTAT1, pSTAT3) and total Stat1 and Stat3 in E0771 cells line expressing GFP or SA-GFP. Levels of GAPDH were used as a loading control. (d) qPCR analysis of the ISGs mRNA levels in E0771 cells expressing GFP or SA-GFP. The data are shown as mean ± SEM (n = 3). (e, f) Cell proliferation assay of GFP and SA-GFP E0771 (e) and AT-3 (f) cells. Cells (mean±SEM, n = 3) were counted for 3 days after seeding.
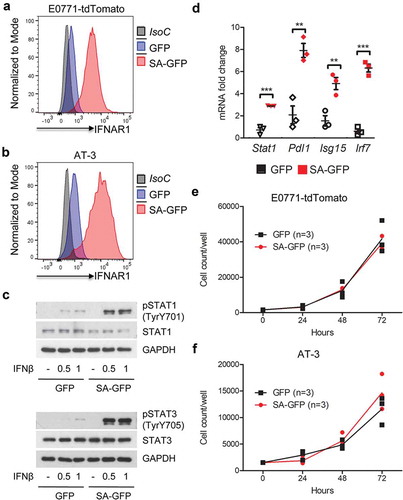
Figure 2. Breast cancer cells expressing SA-GFP grow faster orthotopically but not subcutaneously in syngeneic mouse model. (a, b) Subcutaneous (a) and orthotopic (b) E0771-tdTomato-GFP (GFP) and E0771-tdTomato-Ifnar1SA-GFP (SA-GFP) tumor growth in WT mice. (c) Orthotopic AT-3-GFP (GFP) and AT-3-Ifnar1SA-GFP (SA-GFP) tumor growth in WT mice. (d) qPCR analysis of the expression of ISGs from GFP and SA-GFP E0771 tumors from (B). The data are shown as average fold change relative to E0771-GFP control ± SEM (n = 9 per group).
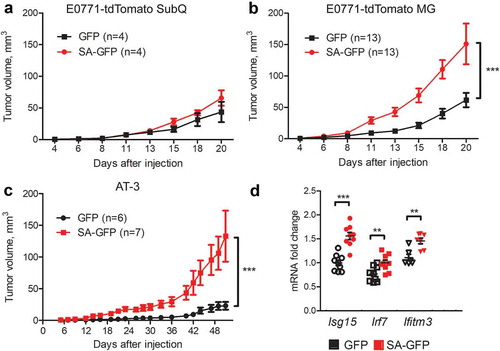
However, when transplanted orthotopically into mammary glands of syngeneic mice, expression of stabilized SA mutant in either E0771 or AT-3 cells significantly accelerated formation of tumors (,c). This phenotype was unlikely due to suppression of the IFN1 pathway in mammary tumor microenvironment because expression of ISGs in these SA tumors was not decreased ().
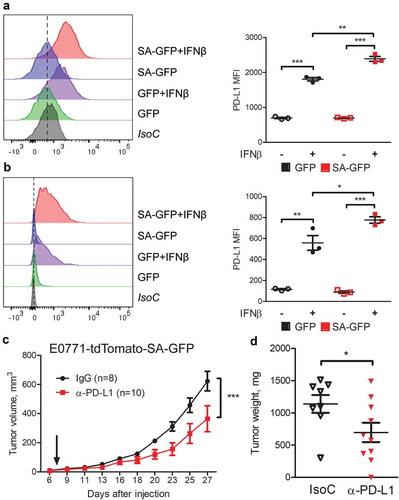
It was previously reported that immune checkpoint molecule PD-L1 can be induced by the IFN1 signaling via IFNAR1.Citation17,Citation25-Citation27 Indeed, tumor cells expressing SA also exhibited an increased expression of PD-L1 () and significantly higher levels of PD-L1 on cell surface after treatment with IFNβ (,b). We next determined whether an increased SA tumor growth was reinforced by an increased PD-L1. Indeed, treatment with anti-PD-L1 significantly decelerated growth of SA tumors (,d). These results suggest that pro-tumorigenic effects of IFNAR1 expressed in mammary adenocarcinoma cells can be partially supported through elevated expression of PD-L1.
Figure 3. Breast cancer cells with induced IFN1 signaling have higher PD-L1 levels and response to anti-PD-L1 treatment. (a,b) Flow cytometry analysis of PD-L1 cell surface levels on GFP and SA-GFP E0771 (a) and AT-3 (b) cells. A representative histogram (left) and quantification (right) are shown. (c,d) The effect of anti-PD-L1 treatment on SA-GFP E0771 tumor growth in WT syngeneic mice. Data are mean±SEM of tumor volume (c) and tumor weight (d) for 8 IgG- and 10 anti-PD-L1-treated mice per group.
To assess the clinical relevance of results obtained in the mouse models, we examined the expression of IFNAR1 in human breast cancer samples. The analysis was carried out on the archival formalin-fixed and paraffin-embedded specimens of human primary invasive breast cancer tissues collected for 12 years in three different institutions (see Materials and Methods). A total of 1,502 patients with up to 20 years of clinical follow-up data (progression-free survival; median 8.8 years) were evaluated for IFNAR1 levels in the cancer cell compartment of tumors.
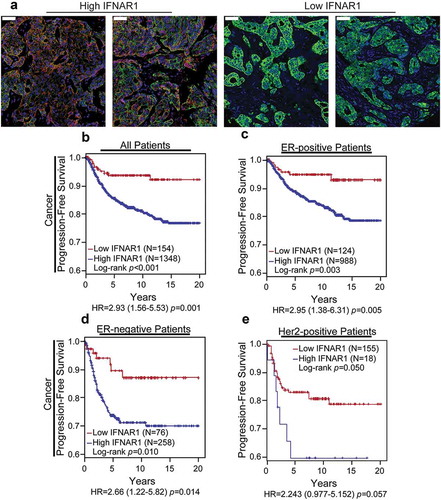
The quantitative immunohistochemistry analysis of human breast cancer tissues revealed significant differences in cancer cell IFNAR1 levels among patients (). Kaplan-Meier survival analyses showed that patients with high IFNAR1 levels correlated with decreased progression-free survival compared to patients with low IFNAR1 (). Importantly, this association remained significant regardless of the status of either estrogen receptor (,d) or HER2 (). These results indicate that high IFNAR1 levels in breast cancer cells are associated with poor prognosis, and, together with data obtained in mouse models, suggest a pro-tumorigenic role of IFNAR1 in breast cancers.
Figure 4. The high levels of IFNAR1 inversely correlate with breast cancer poor prognosis. (a) Representative immunohistochemistry staining of human breast cancer expressing high or low levels of IFNAR1 in cancer cells. Scale bars represent 50 µm. (be) Breast cancer patients with high cancer cell levels of IFNAR1 have poor progression-free survival in comparison with patients with low IFNAR1 expression, an effect observed in all patients (b), within ER-positive patients (c), within ER-negative patients (d) or within HER2-positive patients (e).
Discussion
Here we show that, in contrast to melanomas and colorectal adenocarcinomas, elevated levels of IFNAR1 in the malignant compartments in patients with breast cancer correlated with poor prognosis. These observations in human patients were faithfully reproduced in the orthotopic syngeneic mouse models where expression of a stabilized IFNAR1 mutant in two independent mouse mammary adenocarcinoma cell lines did not exhibit direct anti-proliferative effects but instead promoted tumor growth despite elevated IFN1 signaling and expression of ISGs. Together these data along with the observations of other groups associating an enhanced expression of ISGs with resistance to treatment and poor prognosisCitation21,Citation22 suggest that the IFN1 pathway in malignant breast epithelial cells is likely to elicit pro-tumorigenic effects.
The absence of direct anti-proliferative effects of SA mutant in mammary adenocarcinoma cells in vitro was similar to one reported in MC38 colorectal adenocarcinomaCitation14 but not in humanCitation24 or mouseCitation13 melanoma cells. Although these cell types in general, and cell lines in particular have many differences, which can contribute to the diversity of proliferative phenotype, one of these factors might be the status of p53 tumor suppressor. Induction of cell cycle arrest, senescence, and apoptosis in response to IFN1 relies on the integrity of p53 function;Citation28-Citation30 these observations prompted a suggestion that the lack of cell-autonomous anti-tumorigenic effects of IFN1 observed in chemically induced mouse sarcomas may be related to p53 inactivation.Citation31 Conversely, many types of human and mouse melanoma cells often preserve wild type p53Citation32,Citation33 whereas p53 is mutated in E0771Citation34 and MC38Citation35 cells. Whereas the exact status of p53 in AT-3 cell line has not been determined, it is important to note that these cells originated from a primary mammary adenocarcinoma induced by the Polyoma virus middle T oncogene expression in the MTAG transgenic mouse.Citation36 It has been known that this oncogene can transform primary rodent cells only if p53 is inactivatedCitation37 suggesting that this tumor suppressor is not functional in AT-3 cells either. Further investigation is required of the requirements that govern the direct anti-proliferative effect of IFNAR1 (or the lack thereof) in malignant cells.
How highly expressed IFNAR1 interacts with tumor microenvironment in vivo to promote tumor growth and why this effect is evident in tumors growing within mammary glands but not in the flank remains a focus of additional studies. It is plausible that enhanced IFN1-IFNAR1 pathway supports the generation of an inflammatory mammary environment where IFN1-inducible immune suppressive, pro-inflammatory and angiogenesis-stimulating molecules (such as PD-L1, interleukin-10, indoleamine 2,3 deoxygenase, and others) expressed on benign cells stimulate tumor growth. A PD-L1-dependent mechanism was proposed to underlie the pro-tumorigenic effects of IFN1 in head and neck squamous cell carcinomas.Citation25 Partial deceleration of tumor growth observed in response to anti-PD-L1 antibody (,d) is suggestive of a similar scenario playing out in part in our experimental system.
The mammary environment-specific phenotype observed here can be plausibly associated with unique adipocyte-rich mammary gland tumor microenvironment. Adipocytes have a significant impact on development and progression of cancer via production of tumor-promoting factors including inflammatory and angiogenic cytokines, hormones, metabolites, and reactive oxygen species (reviewed inCitation38). Given that PD-L1 is highly expressed on adipocytes and contributes to immune suppression,Citation39 additional signals from abundant IFNAR1 in mammary microenvironment can further promote tumor growth and progression. Our data also cannot rule out a possibility that high levels of IFNAR1 can signal to produce yet to be characterized cytokines that increase the expression of immune suppressive molecules not only on malignant cells but also on mammary adipocytes or infiltrating myeloid cells. Future studies will test these exciting hypotheses.
Material and methods
Human patient samples
All specimen and data collections were conducted according to research protocols approved by local Institutional Review Boards. The specimens were unselected consecutive cases with the inclusion criteria of available tumor tissue and clinical outcome data. Patients of any age were eligible for analysis. Missing other select clinico-pathological variable(s) was not an exclusion criterion, nor were there other inclusion or exclusion criteria. Patients received postoperative radiotherapy or systemic therapy according to the treating physician’s discretion. Primary invasive breast cancer tissue specimens were reviewed by central pathologist (JAH), and representative cancer tissue regions were selected for inclusion in tissue microarrays .
Immunohistochemistry
IFNAR1 was detected by chromogen or immunofluorescence IHC as previously describedCitation14 with the following specifications: antigen retrieval with citric acid buffer (pH 6.0), rabbit polyclonal IFNAR1 antibody (Sigma, HPA018015; 1:200), and mouse monoclonal anti-pan-cytokeratin (clone AE1/AE3, DAKO, 1:100) for co-detection of carcinoma cells. Quantitative analysis was performed as previously describedCitation40 using the Pannoramic 250 Flash II slide scanner (3DHISTECH Ltd., Budapest, Hungary) to capture high-resolution digital images followed by quantification of biomarker levels using Tissue Studio image analysis software (Definiens). Briefly, user-guided machine learning was performed to identify DAPI-stained cell nuclei and cytokeratin-stained cells within the epithelial or stromal regions of each tissue. Mean cytoplasmic biomarker signal intensity then was calculated for the cancer cell compartment.
Cell lines, culture condition, and viral infection
E0771-tdTomato breast cancer cells were generated by LEGO-T2 lentiviral transduction of the murine breast cancer cell line E0771 (purchased from CH3 BioSystems) to express red fluorescent protein, tdTomato. E0771-tdTomato cell line was cultured according the provider’s recommendations in RPMI1640 supplemented with 10% FBS and penicillin-streptomycin (100 U/ml/100 µg/ml) solution. AT-3 tumor cell line were kindly provided by Scott I. Abrams (Roswell Park Comprehensive Cancer Center, Buffalo, NY) and cultured as described in.Citation36
For lentiviral transduction, 293 T cells were plated to form a 5070% confluent culture and then transfected using Lipofectamine 2000 (Invitrogen). pCIG/EGFP and pCIG/mIFNAR1S526A-EGFP (previously described inCitation9) were co-transfected with pVSV-G, pMDL, and pRSV-Rev. After 24–48 h, supernatants containing lentiviral particles were passed through a 0.45 µm nylon filter and concentrated for transduction by centrifugation at 28,000rpm at 4°C for 4 h in Beckman SW32Ti rotor. The concentrated lentiviruses were mixed with Polybrene (8 µg/ml, Santa Cruz) and transferred to plated target cancer cells. The stable E0771-tdTomato and AT-3 triple negative cell lines expressing EGFP (GFP) or mouse phosphorylation/ubiquitination-deficient Ifnar1S526A mutant together with EGFP (Ifnar1SA-GFP or SA-GFP) were established by cell sorting.
Animal studies
All animal experiments were approved by the Institutional Animal Care and Use Committee (IACUC) of the University of Pennsylvania and were carried out in accordance with the IACUC guidance. All mice were of C57Bl/6 background and had chow and water ad libitum.
For tumor growth studies, cancer cells were inoculated orthotopically into the fourth right mammary gland of the 10-12-week-old female mice at 2.5 × 10⁵ E0771-tdTomato cells and at 2.0 × 10⁵ AT-3 cells re-suspended in 50 µl Hank’s balanced salt solution (HBSS).
Tumor measurements were taken three times a week by digital caliper, and tumor volumes (mm3) were calculated from digital caliper raw data by using the formula: Volume = π/6×(Length×Width×Height). Mice were euthanized when the tumor reached 150 mm3 or became ulcerated, and tumors were flash frozen in liquid nitrogen for further analysis.
For the PD-L1 blockade experiments, mice were treated with intraperitoneal injection of anti-PD-L1 (BioXCell 10 F.9G2; 200 µg/mouse) or control antibodies (BioXCell) twice a week for total six time starting on day 7 after tumor cell inoculation.
Flow cytometry
FACS analysis was performed using LSR Fortessa Flow Cytometer (BD Biosciences) and data were analyzed using FlowJo V10 software. To assess PD-L1 induction by IFNβ (250IU/ml) cells were treated 21 h prior flow cytometry. The cancer cells were stained with APC-conjugated anti-mouse IFNAR1 (Biolegend, 1:500), PE/Cy7-conjugated anti-mouse PD-L1 (Biolegend, 1:500) antibodies or relevant isotype controls (APC- conjugated rat IgG2α and PE/Cy7-conjugated rat IgG2b; Biolegend).
Cell proliferation assay
Cancer cells expressing either GFP or Ifnar1SA-GFP were seeded in a 96-well plate at ~20% confluency (1.5 × 10³ cells/well) to allow room for cell growth and measurement of proliferation for 3 days. Cells were seeded in triplicate for each time point (24 h, 48 h, and 72 h) and cell count were determined using hemocytometer.
Western blot
To induce IFN1 signaling, cells were treated with 250IU/ml IFNβ for 30 min and 1 h. Protein were extracted from cancer cells in RIPA lysis buffer with protease and phosphatase inhibitors. Antibodies against phosphoTyrY701-Stat1 (1:1,000; CST 9167, Danvers, MA), Stat1 (1:1,000; CST 9172, Danvers, MA), phosphoTyrY705-Stat3 (1:2,000; CST 9145, Danvers, MA), and Stat3 (1:1,000; CST 12640, Danvers, MA) were used in this study. Antibodies against GAPDH (1:20,000; CST 5174, Danvers, MA) were used as internal control.
Quantitative real-time PCR
Total RNA was isolated from cultured cancer cells and tumor samples using Trizol Reagent and phenol-chloroform method. After extraction, RNA was reversely transcribed to cDNA using Applied Biosystems High-Capacity RNA-to cDNA Kit and amplified by real-time PCR using SYBR Green Master Mix. Relative changes in gene expression were calculated according to the comparative Threshold Cycle (CT) method and were normalized to Gapdh that was used as an internal control. The gene-specific primer sets, and their sequences are listed below. GAPDH forward: 5ʹ- AGCTTGTCATCAACGGGAAG-3ʹ and reverse: 5ʹ-TTTGATGTTAGTGGGGTCTCG-3ʹ; Isg15 forward: 5ʹ-GGAACGAAAGGGGCCACAGCA-3ʹ and reverse: 5ʹ-CCTCCATGGGCCTTCCCTCGA-3ʹ; Irf7 forward: 5ʹ-GAGACTGGCTATTGGGGGAG-3ʹ and reverse: 5ʹ-GACCGAAATGCTTCCAGGG-3ʹ; Pdl1 forward: 5ʹ-GCTCCAAAGGACTTGTACGTG-3ʹ and reverse: 5ʹ-TGATCTGAAGGGCAGCATTTC-3ʹ; Ifitm3 forward: 5ʹ-CCCCCAAACTACGAAAGAATCA-3ʹ and reverse: 5ʹ- ACCATCTTCCGATCCCTAGAC-3ʹ; Stat1 forward: 5ʹ-TCACAGTGGTTCGAGCTTCAG-3ʹ and reverse: 5ʹ-GCAAACGAGACATCATAGGCA-3ʹ.
Statistical analysis
Results were reported as mean ± SEM (standard error of the mean). Statistical analysis was performed by using GraphPad Prism 7 software (GraphPad Software, SanDiego, CA, USA) and Microsoft Excel. Statistical significance between two groups was calculated by using an unpaired Student’s t test. A p value of <0.05 was considered significant. Two-way ANOVA analysis followed by the Bonferroni posttest was used for analysis of tumor growth curve and cell proliferation curve. In all cases, N values describe the number of biological replicates. Optimal cutpoint for dichotomization (High vs. Low) of IFNAR1 expression levels in cancer cells as a function of progression-free survival was derived using X-tile software, which employs cross-validation to produce corrected p-values for multiple cutpoints.Citation41 The prognostic value of the resulting dichotomized marker was evaluated using the Log-rank test and Kaplan–Meier curves.
Disclosure of potential conflicts of interest
No potential conflicts of interest were disclosed.
Acknowledgments
We thank Dr. Scott I. Abrams (Roswell Park Comprehensive Cancer Center, Buffalo, NY) for the AT-3 mammary adenocarcinoma cell line, Drs. Angelica Ortiz, Rumela Chakrabarti, Andy J. Minn (University of Pennsylvania, Philadelphia, PA) and Dong-Er Zhang (UCSD, La Jolla, CA) for thoughtful discussion.
Additional information
Funding
References
- Minn AJ. Interferons and the immunogenic effects of cancer therapy. Trends Immunol. 2015;36(11):725–737. doi:10.1016/j.it.2015.09.007.
- Parker BS, Rautela J, Hertzog PJ. Antitumour actions of interferons: implications for cancer therapy. Nat Rev Cancer. 2016;16(3):131–144. doi:10.1038/nrc.2016.14.
- Platanias LC. Mechanisms of type-i- and type-ii-interferon-mediated signalling. Nat Rev Immunol. 2005;5(5):375–386. doi:10.1038/nri1604.
- Zitvogel L, Galluzzi L, Kepp O, Smyth MJ, Kroemer G. Type i interferons in anticancer immunity. Nat Rev Immunol. 2015;15(7):405–414. doi:10.1038/nri3845.
- Fuchs SY. Hope and fear for interferon: the receptor-centric outlook on the future of interferon therapy. J Interferon Cytokine Res. 2013;33(4):211–225. doi:10.1089/jir.2012.0117.
- Kumar KG, Tang W, Ravindranath AK, Clark WA, Croze E, Fuchs SY. Scf(hos) ubiquitin ligase mediates the ligand-induced down-regulation of the interferon-alpha receptor. Embo J. 2003;22(20):5480–5490. doi:10.1093/emboj/cdg524.
- Qian J, Zheng H, Huangfu WC, Liu J, Carbone CJ, Leu NA, Baker DP, Fuchs SY. Pathogen recognition receptor signaling accelerates phosphorylation-dependent degradation of ifnar1. PLoS Pathog. 2011;7(6):e1002065. doi:10.1371/journal.ppat.1002065.
- Zheng H, Qian J, Carbone CJ, Leu NA, Baker DP, Fuchs SY. Vascular endothelial growth factor-induced elimination of the type 1 interferon receptor is required for efficient angiogenesis. Blood. 2011;118(14):4003–4006. doi:10.1182/blood-2011-06-359745.
- Huangfu WC, Qian J, Liu C, Liu J, Lokshin AE, Baker DP, Rui H, Fuchs SY. Inflammatory signaling compromises cell responses to interferon alpha. Oncogene. 2012;31(2):161–172. doi:10.1038/onc.2011.221.
- Ortiz A, Gui J, Zahedi F, Yu P, Cho C, Bhattacharya S, Carbone CJ, Yu Q, Katlinski KV, Katlinskaya YV, et al. An interferon-driven oxysterol-based defense against tumor-derived extracellular vesicles. Cancer Cell. 2019;35(1):33–45 e36. doi:10.1016/j.ccell.2018.12.001.
- Bhattacharya S, Zheng H, Tzimas C, Carroll M, Baker DP, Fuchs SY. Bcr-abl signals to desensitize chronic myeloid leukemia cells to ifnalpha via accelerating the degradation of its receptor. Blood. 2011;118(15):4179–4187. doi:10.1182/blood-2010-12-325373.
- Bhattacharya S, HuangFu WC, Dong G, Qian J, Baker DP, Karar J, Koumenis C, Diehl JA, Fuchs SY. Anti-tumorigenic effects of type 1 interferon are subdued by integrated stress responses. Oncogene. 2013;32(36):4214–4221. doi:10.1038/onc.2012.439.
- Katlinskaya YV, Katlinski KV, Yu Q, Ortiz A, Beiting DP, Brice A, Davar D, Sanders C, Kirkwood JM, Rui H, et al. Suppression of type i interferon signaling overcomes oncogene-induced senescence and mediates melanoma development and progression. Cell Rep. 2016;15(1):171–180. doi:10.1016/j.celrep.2016.03.006.
- Katlinski KV, Gui J, Katlinskaya YV, Ortiz A, Chakraborty R, Bhattacharya S, Carbone CJ, Beiting DP, Girondo MA, Peck AR, et al. Inactivation of interferon receptor promotes the establishment of immune privileged tumor microenvironment. Cancer Cell. 2017;31(2):194–207. doi:10.1016/j.ccell.2017.01.004.
- Bidwell BN, Slaney CY, Withana NP, Forster S, Cao Y, Loi S, Andrews D, Mikeska T, Mangan NE, Samarajiwa SA, et al. Silencing of irf7 pathways in breast cancer cells promotes bone metastasis through immune escape. Nat Med. 2012;18(8):1224–1231. doi:10.1038/nm.2830.
- Rautela J, Baschuk N, Slaney CY, Jayatilleke KM, Xiao K, Bidwell BN, Lucas EC, Hawkins ED, Lock P, Wong CS, et al. Loss of host type-i ifn signaling accelerates metastasis and impairs nk-cell antitumor function in multiple models of breast cancer. Cancer Immunol Res. 2015;3(11):1207–1217. doi:10.1158/2326-6066.CIR-15-0065.
- Brockwell NK, Owen KL, Zanker D, Spurling A, Rautela J, Duivenvoorden HM, Baschuk N, Caramia F, Loi S, Darcy PK, et al. Neoadjuvant interferons: critical for effective pd-1-based immunotherapy in tnbc. Cancer Immunol Res. 2017;5(10):871–884. doi:10.1158/2326-6066.CIR-17-0150.
- Slaney CY, Moller A, Hertzog PJ, Parker BS. The role of type i interferons in immunoregulation of breast cancer metastasis to the bone. Oncoimmunology. 2013;2(1):e22339. doi:10.4161/onci.22339.
- Slaney CY, Rautela J, Parker BS. The emerging role of immunosurveillance in dictating metastatic spread in breast cancer. Cancer Res. 2013;73(19):5852–5857. doi:10.1158/0008-5472.CAN-13-1642.
- Brockwell NK, Parker BS. Tumor inherent interferons: impact on immune reactivity and immunotherapy. Cytokine. 2019;118:42–47. doi:10.1016/j.cyto.2018.04.006.
- Weichselbaum RR, Ishwaran H, Yoon T, Nuyten DS, Baker SW, Khodarev N, Su AW, Shaikh AY, Roach P, Kreike B, et al. An interferon-related gene signature for DNA damage resistance is a predictive marker for chemotherapy and radiation for breast cancer. Proc Natl Acad Sci U S A. 2008;105(47):18490–18495. doi:10.1073/pnas.0809242105.
- Post AEM, Smid M, Nagelkerke A, Martens JWM, Bussink J, Sweep F, Span PN. Interferon-stimulated genes are involved in cross-resistance to radiotherapy in tamoxifen-resistant breast cancer. Clin Cancer Res. 2018;24(14):3397–3408. doi:10.1158/1078-0432.CCR-17-2551.
- Boelens MC, Wu TJ, Nabet BY, Xu B, Qiu Y, Yoon T, Azzam DJ, Twyman-Saint Victor C, Wiemann BZ, Ishwaran H, et al. Exosome transfer from stromal to breast cancer cells regulates therapy resistance pathways. Cell. 2014;159(3):499–513. doi:10.1016/j.cell.2014.09.051.
- Kumar KG, Liu J, Li Y, Yu D, Thomas-Tikhonenko A, Herlyn M, Fuchs SY. Raf inhibitor stabilizes receptor for the type i interferon but inhibits its anti-proliferative effects in human malignant melanoma cells. Cancer Biol Ther. 2007;6(9):1437–1441. doi:10.4161/cbt.6.9.4569.
- Ma H, Yang W, Zhang L, Liu S, Zhao M, Zhou G, Wang L, Jin S, Zhang Z, Hu J. Interferon-alpha promotes immunosuppression through ifnar1/stat1 signalling in head and neck squamous cell carcinoma. Br J Cancer. 2019;120(3):317–330. doi:10.1038/s41416-018-0352-y.
- Garcia-Diaz A, Shin DS, Moreno BH, Saco J, Escuin-Ordinas H, Rodriguez GA, Zaretsky JM, Sun L, Hugo W, Wang X, et al. Interferon receptor signaling pathways regulating pd-l1 and pd-l2 expression. Cell Rep. 2017;19(6):1189–1201. doi:10.1016/j.celrep.2017.04.031.
- Morimoto Y, Kishida T, Kotani SI, Takayama K, Mazda O. Interferon-beta signal may up-regulate pd-l1 expression through irf9-dependent and independent pathways in lung cancer cells. Biochem Biophys Res Commun. 2018;507(1–4):330–336. doi:10.1016/j.bbrc.2018.11.035.
- Moiseeva O, Mallette FA, Mukhopadhyay UK, Moores A, Ferbeyre G. DNA damage signaling and p53-dependent senescence after prolonged beta-interferon stimulation. Mol Biol Cell. 2006;17(4):1583–1592. doi:10.1091/mbc.e05-09-0858.
- Takaoka A, Hayakawa S, Yanai H, Stoiber D, Negishi H, Kikuchi H, Sasaki S, Imai K, Shibue T, Honda K, et al. Integration of interferon-alpha/beta signalling to p53 responses in tumour suppression and antiviral defence. Nature. 2003;424(6948):516–523. doi:10.1038/nature01850.
- Yu Q, Katlinskaya YV, Carbone CJ, Zhao B, Katlinski KV, Zheng H, Guha M, Li N, Chen Q, Yang T, et al. DNA-damage-induced type i interferon promotes senescence and inhibits stem cell function. Cell Rep. 2015;11(5):785–797. doi:10.1016/j.celrep.2015.03.069.
- Dunn GP, Bruce AT, Sheehan KC, Shankaran V, Uppaluri R, Bui JD, Diamond MS, Koebel CM, Arthur C, White JM, et al. A critical function for type i interferons in cancer immunoediting. Nat Immunol. 2005;6(7):722–729. doi:10.1038/ni1213.
- Melnikova VO, Bolshakov SV, Walker C, Ananthaswamy HN. Genomic alterations in spontaneous and carcinogen-induced murine melanoma cell lines. Oncogene. 2004;23(13):2347–2356. doi:10.1038/sj.onc.1207405.
- Jochemsen AG. Reactivation of p53 as therapeutic intervention for malignant melanoma. Curr Opin Oncol. 2014;26(1):114–119. doi:10.1097/CCO.0000000000000033.
- Johnstone CN, Smith YE, Cao Y, Burrows AD, Cross RS, Ling X, Redvers RP, Doherty JP, Eckhardt BL, Natoli AL, et al. Functional and molecular characterisation of eo771.Lmb tumours, a new c57bl/6-mouse-derived model of spontaneously metastatic mammary cancer. Dis Model Mech. 2015;8(3):237–251. doi:10.1242/dmm.017830.
- Vierboom MP, Zwaveling S, Bos GMJ, Ooms M, Krietemeijer GM, Melief CJ, Offringa R. High steady-state levels of p53 are not a prerequisite for tumor eradication by wild-type p53-specific cytotoxic t lymphocytes. Cancer Res. 2000;60(19):5508–5513.
- Stewart TJ, Abrams SI. Altered immune function during long-term host-tumor interactions can be modulated to retard autochthonous neoplastic growth. J Immunol. 2007;179(5):2851–2859. doi:10.4049/jimmunol.179.5.2851.
- Lomax M, Fried M. Polyoma virus disrupts arf signaling to p53. Oncogene. 2001;20(36):4951–4960. doi:10.1038/sj.onc.1204717.
- Nieman KM, Romero IL, Van Houten B, Lengyel E. Adipose tissue and adipocytes support tumorigenesis and metastasis. Biochim Biophys Acta. 2013;1831(10):1533–1541. doi:10.1016/j.bbalip.2013.02.010.
- Wu B, Sun X, Gupta HB, Yuan B, Li J, Ge F, Chiang HC, Zhang X, Zhang C, Zhang D, et al. Adipose pd-l1 modulates pd-1/pd-l1 checkpoint blockade immunotherapy efficacy in breast cancer. Oncoimmunology. 2018;7(11):e1500107. doi:10.1080/2162402X.2018.1500107.
- Peck AR, Girondo MA, Liu C, Kovatich AJ, Hooke JA, Shriver CD, Hu H, Mitchell EP, Freydin B, Hyslop T, et al. Validation of tumor protein marker quantification by two independent automated immunofluorescence image analysis platforms. Mod Pathol. 2016;29(10):1143–1154. doi:10.1038/modpathol.2016.112.
- Camp RL, Dolled-Filhart M, Rimm DL. X-tile: A new bio-informatics tool for biomarker assessment and outcome-based cut-point optimization. Clin Cancer Res. 2004;10(21):7252–7259. doi:10.1158/1078-0432.CCR-04-0713.