
 ?Mathematical formulae have been encoded as MathML and are displayed in this HTML version using MathJax in order to improve their display. Uncheck the box to turn MathJax off. This feature requires Javascript. Click on a formula to zoom.
ABSTRACT
Properly stratifying high-risk individuals with early stage hepatocellular carcinoma (HCC) is essential to identify patients in which the potentially therapies can be offered. To this context, we systematically investigated the prognostic value of epigenetic clock with early stage HCC as well as the association with other molecular characteristics.
We computed DNA methylation (DNAm) age of 256 early stage HCC patients and 50 normal samples from TCGA by Horvath clock model. The characteristics of two DNAm age subgroups were differentiated regarding HBV expression, pathway activity, epigenomic, and genomic alteration. Cox regression and restricted cubic spline (RCS) analysis were utilized to evaluate the prognostic value of epigenetic acceleration.
DNAm age was significantly associated with chronological age in normal tissue but largely disrupted in tumors (P< .001), and showed significant negative correlation with HBV expression (P< .05). We identified two DNAm age groups (DNAmAge-ACC and DNAmAge-DEC), and the former presented with an immunoactive phenotype (all FDRs<0.05 in enrichment analysis), CpG island hypermethylation (P< .001), and lower mutation burden (P= .018). Every 10-year increase in DNAm age was associated with a 18% decrease in fatality after adjustment for major clinical variables; DNAmAge-ACC had 50% lower mortality risk than DNAmAge-DEC (HR: 0.50, 95% CI: 0.27–0.94, P= .03). RCS revealed the fatality risk significantly decreased as epigenetic age accelerated (P = .04). Conclusions
In summary, we highlighted the prognostic value of epigenetic age acceleration for early stage HCC; better prognosis, relatively lower HBV load, and higher enrichment of immune signatures were tightly associated with epigenetic age accelerated tumors.
Introduction
Hepatocellular carcinoma (HCC) accounts for the majority of primary liver cancers. Worldwide, liver cancers are the fourth most common cause of cancer-related death and rank sixth in terms of incident cases. The World Health Organization estimates that more than one million patients will die from liver cancer in 2030, according to the annual projections.Citation1 In United Stages, death rate of liver cancer increased by 43% (from 7.2 to 10.3 deaths per 100,000) between 2000 and 2016,Citation2 and in 2019, approximately 42,030 new cases and 31,780 deaths of HCC were estimated to occur.Citation3 With a 5-year survival of 18%, liver cancer is the second most lethal tumor, after pancreatic cancer.Citation4 Patients suffering underlying liver cancer constitute the majority of hepatocellular carcinomas, and most of them are hepatitis B or C virus (HBV or HCV) infected or alcohol abused. Unfortunately, unless HCC could be diagnosed at an early stage, it will maintain a poor prognosis. It is in this context that providing appropriate screening to high-risk individuals for those patients with early stage HCC is essential to assist identifying patients to whom potentially curative therapies of surgical resection, radiofrequency ablation, and liver transplantation can be offered.Citation5
Age is a strong predictor of risk of HCC and other common but complex disease (e.g., cardiovascular and neuropathic diseases).Citation6 Several DNA methylation-based clocks developed recently have shown promise as biomarkers for biological aging,Citation7,Citation9,Citation10,Citation11-12 especially the Horvath’s clock which has been shown to be tightly and robustly associated with chronological age. Epigenetic age acceleration, which could be measured as an vertical shift between DNAm age and chronological age, was reported to be correlated with the clinical outcomes of many diseases, including tumors.Citation13,Citation14,Citation16-17
A previous study has indicated that the DNAm age of 164 patients diagnosed with liver hepatocellular carcinoma was not associated with patients’ overall survivalCitation18; however, the prognostic value of the epigenetic clock in early stage HCC remains unexplored up to date. In this study, we focused on patients diagnosed with HCC at early stages (i.e., stage I and II) and comprehensively excavated the associations of DNAm age with clinical outcomes, tumor clinicopathological features as well as molecular characteristics.
Results
DNAm age of cancerous tissue showed weak correlation with chronological age
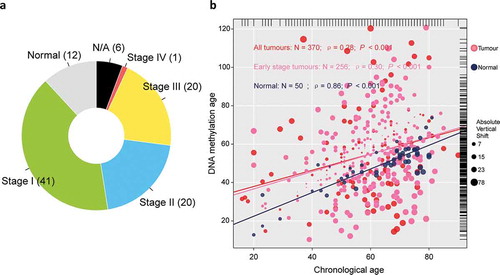
A total of 374 tumor samples retrieved from TCGA was first collected, including 171 stage I tumors, 86 stage II tumors, 85 stage III tumors, and 5 stage IV tumors. Among which, we selected 257 samples confirmed as early-stage hepatocellular carcinoma for the purpose of this study, and a total of 50 normal hepatic samples was retrieved as control ()). One sample without record of chronological age was removed from analysis. Among normal samples, chronological age is highly correlated with DNAm age (ρ = 0.86); however, there is only a weak correlation between tumor tissue-based DNAm age and chronological age (ρ = 0.28), and alike, in early-stage hepatic tissues (ρ = 0.30), which indicated the pattern of DNA methylation observed in normal hepatic tissues collapsed in tumor tissues (both, P< .001; )). We then dichotomized the patients diagnosed with early-stage hepatocellular carcinoma as either epigenetic age accelerated (DNAmAge-ACC) or decelerated group (DNAmAge-DEC) according to the individual vertical shift between DNAm age and chronological age with a cutoff of 0 which means DNAm age was equal to chronological age.
Figure 1. Overview of sample selection, and correlations between DNAm age and chronological age. (a) The pie chart shows the proportion of normal samples and tumor samples at different stage. A total of 24 (6%) tumor samples without available stage information are labeled as “N/A,” (b) DNAm age of 50 normal hepatic samples can predict chronological age with decent correlation coefficient, whereas such correlation descended largely in either entire TCGA tumor cohort of 370 samples (red or pink dots) or early stage tumors with 256 samples (pink dots). The top and right marginal rug line describes the distribution of chronological age and DNAm age, respectively
Association between DNAm age, epigenetic age acceleration, and HBV expression
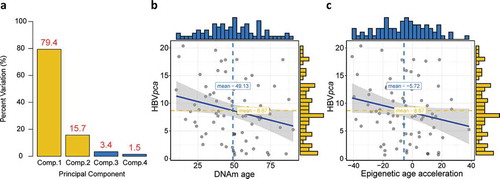
Similar to a previous literature,Citation19 we calculated a comprehensive variable by principle component analysis (PCA) based on four detected HBV oncoproteins to present the general virus expression. The first and second principle components were used since they covered almost all the variations (95.1%; )). For 75 patients who expressed at least one of the four HBV oncoproteins, we found significant negative correlation between either DNAm age or epigenetic age acceleration and
(ρ = −0.24, P = .02 for DNAm age; ρ = −0.22, P = .03 for epigenetic age acceleration; ), but no association could be observed between
and chronological age (not shown).
Figure 2. Construction of , and its association with DNAm age or epigenetic age acceleration. (a) Barplot demonstrates that the first and second principal components covered almost all the variations with a summing percentage of 95.1%. Significant negative correlations between
and either DNAm age or epigenetic age acceleration are shown in (b) and (c), respectively
Cooccurrence of epigenetic age acceleration and immunoactivation as well as hypermethylation
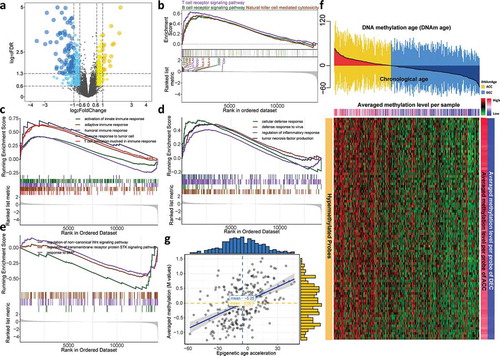
For the sake of excavating molecular differences in terms of DNAm age status, we conducted differential expression analysis and identified 117 and 201 significantly upregulated genes (fold change > 1.5, FDR < 0.05) for DNAm-ACC and DNAm-DEC groups, respectively (), Table S1) and we found that immune-related and terms were specifically enriched in DNAm-ACC groups (Table S2). For instance, upregulated genes in DNAm-ACC group were enriched for activation of innate immune response (FDR = 0.003), response to interferon-gamma (FDR = 0.001) and T cell differentiation (FDR < 0.001). Gene set enrichment analysis further detailed that patients with epigenetic age acceleration presented a universal immunoactive phenotype by upregulated lymphocytes pathways (i.e., T cells, B cells and natural killer cells; all, FDR < 0.01; ), Table S3), immune response (all, FDR < 0.05; ), Table S4), and other functions related to immunoactivation (i.e., tumor necrosis factor (TNF) signaling, defense response to virus; both, FDR = 0.01; ); Table S4); whereas DNAmAge-DEC group was enriched with bone morphogenic protein (BMP) signaling pathway, serine/threonine kinase signaling pathway and Wingless-type (Wnt) signaling pathway (all, P < .05, FDR < 0.25; ), Table S4). Differential methylation analysis identified 16,219 DMPs located in CpG island (P< .05, FDR < 0.05; Table S5), among which 16,128 (99%) probes gained methylation in DNAmAge-ACC group while only 91 (1%) were identified for patients with decelerated age. Under a more stringent criteria, we selected 89 hypermethylated probes for DNAmAge-ACC group and no hypomethylated probes could be identified ()). As expected, the epigenetic age acceleration was significantly associated with DNA methylation level in CpG island (ρ = 0.49, P< .001; )).
Figure 3. Cooccurrence of epigenetic age acceleration and immunoactivation as well as hypermethylation. (a) Volcano plot of differentially expressed genes for DNAmAge-ACC group against DNAmAge-DEC group with 117 upregulated and 201 down-regulated genes. GSEA identified upregulated (b) lymphocyte-related pathways and (c) immune response signaling pathways. GSEA further identified upregulated (d) other pathways related to immunoactivation for DNAmAge-ACC group; whereas (e) BMP signaling pathway, serine/threonine kinase signaling pathway and Wnt signaling pathway for DNAmAge-DEC group. (f) A total of 89 stringent hypermethylated probes were identified for DNAmAge-ACC group. The heatmap based on DNA methylation M values demonstrates a cooccurrence of epigenetic age acceleration and CpG island hypermethylation. For the averaged methylation level per sample, mean methylation β value was calculated for each sample (per column); for the averaged methylation level per probe, mean methylation β value per probe was calculated for DNAmAge-ACC and DNAmAge-DEC groups (per row), respectively. (g) Significant positive correlation between epigenetic age acceleration and averaged methylation level (M values)
Mutation landscape of two groups regarding epigenetic age acceleration status
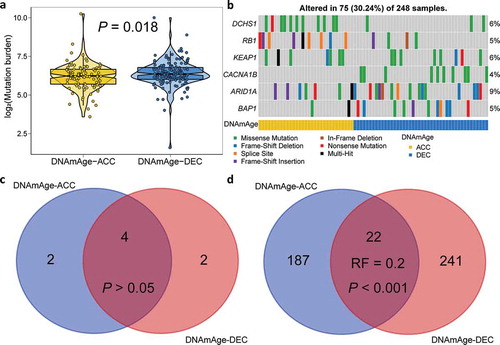
To further investigate the association between epigenetic age acceleration and genetic alterations, we calculate tumor mutation burden for each sample and found DNAm-ACC group presented significantly lower mutation burden (P= .018; )). We then filtered genes with a nonsynonymous mutation frequency ≥ 10, and identified two differentially mutated genes regarding epigenetic age acceleration status (), Table S6). To be specific, DNAm-ACC group was enriched with DCHS1 mutation whereas mutation of CACNA1B was enriched in DNAm-DEC group (both, P< .01, FDR < 0.1). CACNA1B is a member of Voltage-gated calcium channels (VGCC) family; calcium ion channels also have confirmed roles in cellular functions, including mitogenesis, proliferation, differentiation, apoptosis, and metastasis, and are promising to be targeted for novel cancer therapy.Citation20 Under a stringent threshold of q < 0.05, MutSigCV detected four common genes (4/8, 50%; P > .05, Representation factor: 1.8; ), Table S7–8) that significantly mutated in either DNAmAge-ACC and DNAmAge-DEC groups, but also revealed that mutations of RB1 and KEAP1 were significantly enriched in DNAmAge-ACC group whereas mutations of ARID1A and BAP1 were frequently mutated in DNAmAge-DEC group. However, under a loose threshold of P < .05, only 22 SMGs were shared (22/450, 5%; P < .001, Representation factor: 0.2; ), Table S7–8), suggesting a dramatic alteration in genome as epigenetic age accelerated.
Figure 4. Mutation landscape of two DNAm age groups. (a) Violin plot shows lower tumor mutation burden in DNAmAge-ACC group as compared to DNAmAge-DEC group. (b) Mutational oncoprint depicts differential mutated genes for two DNAm age groups, including fisher’s exact test-based independent mutated genes and significantly mutated genes (SMGs) identified by MutSigCV algorithm. Common and group-specific SMGs under either stringent (q < 0.05) and loose (P < .05) criteria of MutSigCV algorithm were displayed by Venn diagrams in (c) and (d), respectively. Representation factor (RF) and the associated probability were calculated to infer the statistical significance of the overlap between two groups of genes where a RF < 1 indicates less overlap than expected of two independent groups
Association between DNAm age and overall survival
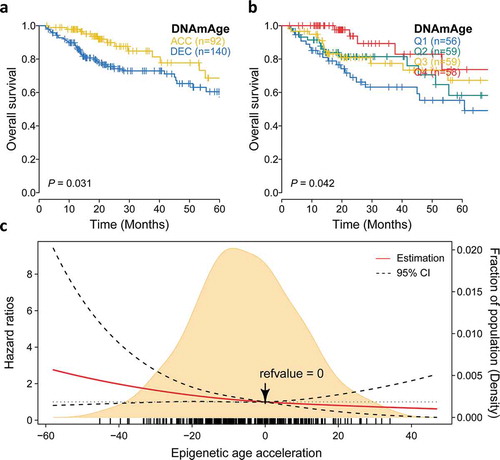
We then investigate whether epigenetic age acceleration was associated with patients’ clinical outcomes, and found that DNAmAge-ACC had significantly more favorable prognosis when taking OS as an outcome (P = .03; )). Seperated survival rate could also be observed when using quartile DNAm age (OS: P= .04; )). We found that every 10-year increase in DNAm age was associated with a 18% decrease in fatality in the Cox model adjusted for chronological age and tumor clinical stage (HR: 0.82, 95% CI: 0.70–0.96, P= .01; ). Compared with the first quartile, the forth quartile (HR: 0.28, 95% CI: 0.11–0.72, P= .007) demonstrated a longer survival. Additionally, DNAmAge-ACC group had 50% lower risk of fatality comparing to DNAmAge-DEC group when considering other covariables (HR: 0.50, 95% CI: 0.27–0.94, P= .03). To further reveal the relationship between continuous epigenetic age acceleration and OS. RCS model with 3 knots was harnessed and it revealed that, as 0 was chosen as reference (i.e., DNAm age = chronological age), the risk of fatality significantly decreased as epigenetic age accelerated under adjustment for major clinical variables (P = .04; )).
Table 1. Association of overall survival with epigenetic age acceleration for hepatocellular carcinoma in early stage
Figure 5. Prognostic value of epigenetic age acceleration in early stage HCC. (a) Kaplan-Meier curve with log-rank test demonstrates that patients belonging to DNAmAge-ACC showed significantly favorable prognosis regarding overall survival (OS). (b) Epigenetic age acceleration was further discretized into quartiles: Q1 (−58.0, −18.0), Q2 (−18.0, −5.7), Q3 (−5.7, 7.3), Q4 (7.3, 46.9), and rates of (b) OS also well-distinguished. (c) The association between epigenetic age acceleration and the fatality risk of early stage HCC when adjusted for chronological age (binary) and tumor stage was presented with cubic spline graph of the adjusted HR (solid red line) and 95% CI (dotted black line). Knots: −29.4 (10th), −5.7 (50th), and 18.9 (90th) of the distribution of epigenetic age acceleration; reference value: 0, which means that DNAm age equals to chronological age
Demographic characteristics
The distributions of patient BMI (categorized by WTO criteria), race, ethnicity, tumor grade, clinical stage, tumor status, and risk factors were not different DNAmAge-ACC and DNAmAge-DEC groups. However, male patients were enriched in DNAmAge-ACC group and DNAmAge-DEC group has much more older patients (P = .01 for gender and P < .001 for age; ).
Table 2. Demographic and clinicopathological characteristics and the associations with DNAm age for 256 patients diagnosed with early stage hepatocellular carcinoma
Discussion
The increase in deaths due to hepatocellular carcinoma is a growing concern.Citation2 The clinical management of hepatocellular carcinoma has improved in the past decade, particularly for patients at advanced stages; however, identification of new biomarkers to stratify patients diagnosed with HCC at early-stage will help personalize clinical management and surveillance, and further reduce this burden of mortality.Citation1 Accumulating evidence suggest epigenetic age acceleration as a novel biomarker for cancer riskCitation15,Citation17,Citation21; thus, in this study, we systematically examined the association of epigenetic age acceleration with the prognostic value as well as other molecular features for early stage HCC.
The current study suggested that epigenetic deceleration, or a younger biological age, may induce poorer prognosis for early stage HCC, which contradicted previous findings that younger DNAm age in normal tissues was associated with health improving.Citation22,Citation23,Citation24-25 To normal tissues, these findings could be rational since accelerated DNAm age stands for that the individual is at an older biological age than chronological age, and such acceleration is often induced by unhealthy lifestyles, susceptible heredity, detrimental environmental factors to name but a few; however, this situation may not be suitable for tumor tissues. It is worth noting that carcinogenesis is an evolutionary process that involves somatic mutations, subclonal evolution, and formation of cancer stem cells that highly participate in process of proliferation and propagation.Citation26,Citation27 It is similar to normal cells that the DNAm age of tumor cells increases as cells propagate, which indicates that cancer cells with a lower DNAm age may be more likely to proliferate and develop into dreadful malignancies.Citation8 Moreover, significantly higher burden of mutation existed in DNAm-Age-DEC group, which was consistence with the fact that lower DNAm age in cancer cells was converged to higher rates of genetic alterations.Citation8 It was reported that increased DNAm age may play dual character and its effect may vary in cancers; that is to say, aging cells may be prevented from proliferation and cancerization, but chromosomal changes are likely to trigger other mutations that might lead to cancer progression and poorer outcomes.Citation28 Consistently, when adjusting major clinical factors and taking OS as the clinical outcome, the association between DNAm age and prognosis of early stage HCC was significant. More specifically, patients diagnosed with early stage HCC would have favorable prognosis if epigenetic age was accelerated.
Up till now, HBV is accepted to be a major risk factor of HCC development and its viral load is being increasingly recognized as a prognostic factor in HCC.Citation29 Such virus can cause host epigenetic changes and genetic alterations by inducing DNA hypomethylation and regulating the expression fo cellular oncogenes and tumor suppressor genes.Citation30,Citation31 Recent meta-analysis manifested that antiviral treatment reduces liver-related mortality after curative therapy of HCC.Citation32 Consistent with these reports, we found significant increase of HBV expression when epigenetic age decelerated in early stage HCC, and alike, we found DNAmAge-DEC group presented with a dramatic hypomethylation pattern in CpG islands as well as a significantly higer somatic mutation burden.
In addition, we also found DNAmAge-ACC group presented an immunoactive phenotype, characterized by significant enrichment for immune signatures, such as lymphocyte, inflammatory and immune response. DNAmAge-ACC inhibited more enriched TNF signaling, which is concordant with previous research that TNF can facilitate immune-mediated virological control by mediating innate immune mechanisms in HBV clearance.Citation33,Citation34 Therefore, we reasoned that on the one hand, the HBV-triggered CpG island hypomethylation may partially cause epigenetic age deceleration; on the other hand, a stronger inflammatory/immune response may help control HBV load and lead to a better prognosis for DNAmAge-ACC group. Furthermore, the enrichment analysis indicated that receptors serine/threonine kinase (e.g., BMP) and Wnt pathway may play roles in DNAmAge-DEC group. It has been reported that the BMP signaling pathway enables to modulate Wnt signaling in gastrointestinal tumor, and activation of Wnt–β-catenin signaling will promote the development and/or progression of different diseases, including liver cancer.Citation35,Citation36
The present study has limitations. First, this investigation has a drawback of retrospective design, and it is also limited to one center (TCGA) that provided tumor samples. Second, this study only included adjacent-normal samples and due to the lack of truly normal controls, we can hardly confirm whether there is a difference between normal and adjacent-normal tissue. Larger prospective studies are required for providing more evidence.
To sum up, our findings present new evidence into prognostic value of epigenetic age acceleration in early stage HCC, and put insight for future research into the mechanisms of age-associated DNAm patterns and potential therapeutic targets in early stage HCC treatment.
Patients and methods
Study population
Molecular data were obtained from The Cancer Genome Atlas Project (TCGA) patients diagnosed with liver hepatocellular carcinoma. Methylation data assessed by TCGA using Infinium 450 K arrays were downloaded from Xena Public Data Hubs (https://xena.ucsc.edu/public-hubs), including 377 tumor samples and 50 normal samples. Transcriptome HTSeq-counts data of the TCGA-LIHC project were downloaded from the GDC data portal using R package “TCGAbiolinks,” including 371 primary tumor samples and 50 normal samples. The raw, paired-end reads in FASTQ were also obtained for virus detection. Somatic mutation data and patients’ survival information were downloaded from TCGA PanCanAtlas and were filtered for LIHC tumor type. Clinicopathological information of available patients were retrieved from cBioPortal (http://www.cbioportal.org/datasets). Among all patients with full survival and chronological age information, 256 patients diagnosed with early stage hepatocellular carcinoma (i.e., pathological stage I and II) were selected for this study.
DNA methylation age and epigenetic age acceleration
We first filtered, imputed and then normalized methylation β matrix through BMIQ method by R package “ChAMP.”Citation37 We then using R package “wateRmelon” to construct a Horvath’s clock model and calculate the DNA methylation age from normalized methylation β values.Citation38 We extracted chronological age from DNAm age individually to quantify epigenetic age acceleration (i.e., vertical shift). Tests for differentially methylated probes (DMP) were conducted by “ChAMP” with default parameters and we reasoned a probe gained methylation if the difference of mean β value between two groups is statistically significant (false discovery rate (FDR) < 0.05) and greater than 0. Moreover, if the average methylation level was greater than a threshold of 0.3 in one group but less than 0.2 in another group with FDR < 0.05, hypermethylated probes would be considered, and vice versa for hypomethylated probes. We transformed β value to M value by Beta2M() function for its stronger signals when presenting a methylation heatmap.Citation39
Data preprocessing for transcriptome HTSeq-counts
Ensembl ID for genes (protein-coding mRNAs) was annotated in GENCODE27 to generate Gene Symbol names. We calculated the number of fragments per kilobase of nonoverlapped exon per million fragments mapped (FPKM) first and subsequently transferred FPKM into transcripts per kilobase million (TPM) values. To reduce noise, we kept only mRNAs with TPM equal to or above 1 in at least 10% of the samples for downstream analysis.
Virus detection from RNA-Seq
VirusSeqCitation40 algorithm was harnessed to computationally subtract human sequences and generate a set of nonhuman sequences (e.g., viruses) in RNA-Seq. We aligned the RNA-Seq libraries to both human and HBV genomes to quantify the host and viral gene expression. Four oncoproteins of HBV, i.e., HBVgp3_X, HBVgp2_S, HBVgp2_pre-S1/S2, and HBVgp4_c were identified and presented as FPKM values. To comprehensively quantify the expression level of HBV, we established a new variable to explain the original expression level of four oncoproteins that was calculated by principal component analysis (PCA) according the literature.Citation19 The new PCA-based variable was derived from the first and second principal components that represented 79.4% and 15.7% of the variation in the original data, respectively. The coefficients (normalized loading) of four oncoproteins to the first and second principal components are shown in . Mathematically, let
represent log2(FPKM + 1) value of specific oncoprotein
in sample
and
denote the corresponding coefficient of HPV16 oncoprotein (
) for principal component
(
). The
can be calculated as follows:
Table 3. The coefficients of four HBV oncoproteins to the first and second principal components
Molecular characterization of two DNA methylation age groups
We utilized R package “DESeq2” to perform differential expression analysis with the standard comparison mode with false positive rate (FDR) adjustment for multiple testing.Citation41 We performed gene set enrichment analysis (GSEA) to characterize specific group according to the mRNA expression profiling through the R package “clusterProfiler.”Citation42,Citation43 Mutation landscape was analyzed by R package “maftools” with removal of 100 FLAGS genes first.Citation44,Citation45 Tumor mutation burden was calculated by “maftools” per sample by considering high or moderate variant consequences, including Frame_Shift_Del, Frame_Shift_Ins, Splice_Site, Translation_Start_Site, Nonsense_Mutation, Nonstop_Mutation, In_Frame_Del, In_Frame_Ins, and Missense_Mutation. Significantly mutated genes (SMGs) across the current identified groups were inferred by the MutSigCV_v1.41 algorithm with default parameters.Citation46
Statistical analysis
All statistical tests were executed by R/3.5.2 using a Fisher’s exact test for categorical data, a two-sample Wilcoxon test (Mann-Whitney test) for continuous data and a log-rank test for Kaplan–Meier curve. Correlation between two continuous variables was measured by Pearson’s correlation coefficient. Fisher’s -to-
transformation was used to calculate a value of
that was applied to assess the significance of the difference between two correlation coefficients. Representation factor and the associated probability were calculated to infer the statistical significance of the overlap between two groups of genes where a representation factor > 1 indicates more overlap than expected of two independent groups, a representation factor < 1 indicates less overlap than expected. We utilized the R package “survival” to perform survival analysis. Cox regression adjusted for confounding clinical variables was introduced to calculate hazard ratio (HR) for epigenetic age status regarding overall survival (OS). Based on R packages “Hmisc” and “smoothHR,” we used the restricted cubic spline (RCS) analysis in the multivariate Cox regression to explore the association between continuous epigenetic age acceleration and patient’s clinical outcomes with knots set at equally spaced.Citation47 Optimal number of knot for RCS analysis was first determined by minimizing the model’s Akaike information criterion. To enhance the robustness of survival-related analyses, we excluded 24 patients whose OS time was less than two months. For all statistical analyses, a P value <.05 was considered statistically significant.
Declaration of interests
The authors declare no competing interests.
Supplemental Material
Download MS Excel (1.7 MB)Acknowledgments
The results published here are based upon data generated by TCGA and managed by the NCI and NHGRI; we are thus grateful to TCGA. Information regarding TCGA can be found at http://cancergenome.nih.gov.
Supplementary material
Supplemental data for this article can be accessed on the publisher’s website.
Additional information
Funding
References
- Villanueva A. Hepatocellular carcinoma. N Engl J Med. 2019;380:1450–1462. doi:10.1056/NEJMra1713263.
- Xu J. Trends in liver cancer mortality among adults aged 25 and over in the United States, 2000-2016. US Department of Health & Human Services, Centers for Disease Control and Prevention, National Center for Health Statistics; 2018.
- Siegel RL, Miller KD, Jemal A. Cancer statistics, 2019. CA Cancer J Clin. 2019;69(1):7–34. doi:10.3322/caac.21551.
- Jemal A, Ward EM, Johnson CJ, Cronin KA, Ma J, Ryerson AB, Mariotto A, Lake AJ, Wilson R, Sherman RL, et al. Annual report to the nation on the status of cancer, 1975–2014, featuring survival. J Natl Cancer Inst. 2017;109(9). doi:10.1093/jnci/djx030.
- Burak KW. Prognosis in the early stages of hepatocellular carcinoma: predicting outcomes and properly selecting patients for curative options. Can J Gastroenterol Hepatol. 2011;25:482–484.
- Driver JA, Djoussé L, Logroscino G, Gaziano JM, Kurth T. Incidence of cardiovascular disease and cancer in advanced age: prospective cohort study. BMJ. 2008;337:a2467. doi:10.1136/bmj.a2467.
- Hannum G, Guinney J, Zhao L, Zhang L, Hughes G, Sadda S, Klotzle B, Bibikova M, Fan J-B, Gao Y, et al. Genome-wide methylation profiles reveal quantitative views of human aging rates. Mol Cell. 2013;49(2):359–367. doi:10.1016/j.molcel.2012.10.016.
- Horvath S. DNA methylation age of human tissues and cell types. Genome Biol. 2013;14:3156. doi:10.1186/gb-2013-14-10-r115.
- Koch CM, Wagner W. Epigenetic-aging-signature to determine age in different tissues. Aging (Albany NY). 2011;3:1018. doi:10.18632/aging.100395.
- Numata S, Ye T, Hyde TM, Guitart-Navarro X, Tao R, Wininger M, Colantuoni C, Weinberger D, Kleinman J, Lipska B, et al. DNA methylation signatures in development and aging of the human prefrontal cortex. Am J Hum Genet. 2012;90(2):260–272. doi:10.1016/j.ajhg.2011.12.020.
- Rakyan VK, Down TA, Maslau S, Andrew T, Yang T-P, Beyan H, Whittaker P, McCann OT, Finer S, Valdes AM, et al. Human aging-associated DNA hypermethylation occurs preferentially at bivalent chromatin domains. Genome Res. 2010;20:434–439. doi:10.1101/gr.103101.109.
- Teschendorff AE, Menon U, Gentry-Maharaj A, Ramus SJ, Weisenberger DJ, Shen H, Campan M, Noushmehr H, Bell CG, Maxwell AP, et al. Age-dependent DNA methylation of genes that are suppressed in stem cells is a hallmark of cancer. Genome Res. 2010;20(4):440–446. doi:10.1101/gr.103606.109.
- Horvath S, Garagnani P, Bacalini MG, Pirazzini C, Salvioli S, Gentilini D, Di Blasio AM, Giuliani C, Tung S, Vinters HV, et al. Accelerated epigenetic aging in down syndrome. Aging Cell. 2015;14(3):491–495. doi:10.1111/acel.12325.
- Nevalainen T, Kananen L, Marttila S, Jylhävä J, Mononen N, Kähönen M, Raitakari OT, Hervonen A, Jylhä M, Lehtimäki T, et al. Obesity accelerates epigenetic aging in middle-aged but not in elderly individuals. Clin Epigenetics. 2017;9(1):20. doi:10.1186/s13148-016-0301-7.
- Ambatipudi S, Horvath S, Perrier F, Cuenin C, Hernandez-Vargas H, Le Calvez-Kelm F, Durand G, Byrnes G, Ferrari P, Bouaoun L, et al. DNA methylome analysis identifies accelerated epigenetic ageing associated with postmenopausal breast cancer susceptibility. Eur J Cancer. 2017;75:299–307. doi:10.1016/j.ejca.2017.01.014.
- Levine ME, Hosgood HD, Chen B, Absher D, Assimes T, Horvath S. DNA methylation age of blood predicts future onset of lung cancer in the women’s health initiative. Aging (Albany NY). 2015;7(9):690. doi:10.18632/aging.100809.
- Zheng Y, Joyce BT, Colicino E, Liu L, Zhang W, Dai Q, Shrubsole MJ, Kibbe WA, Gao T, Zhang Z, et al. Blood epigenetic age may predict cancer incidence and mortality. EBioMedicine. 2016;5:68–73. doi:10.1016/j.ebiom.2016.02.008.
- Lin Q, Wagner W, Greally JM. Epigenetic aging signatures are coherently modified in cancer. PLoS Genet. 2015;11(6):e1005334. doi:10.1371/journal.pgen.1005334.
- Lu X, Jiang L, Zhang L, Zhu Y, Hu W, Wang J, Ruan X, Xu Z, Meng X, Gao J, et al. Immune signature-based subtypes of cervical squamous cell carcinoma tightly associated with human papillomavirus type 16 expression, molecular features, and clinical outcome. Neoplasia. 2019;21(6):591–601. doi:10.1016/j.neo.2019.04.003.
- Phan NN, Wang CY, Chen CF, Sun Z, Lai MD, Lin YC. Voltage-gated calcium channels: novel targets for cancer therapy. Oncol Lett. 2017;14:2059–2074. doi:10.3892/ol.2017.6457.
- Zheng C, Li L, Xu R. Association of epigenetic clock with consensus molecular subtypes and overall survival of colorectal cancer. Cancer Epidemiol Biomarkers Prev. 2019;cebp. doi:0208.2019.
- Zhang Y, Wilson R, Heiss J, Breitling LP, Saum K-U, Schöttker B, Holleczek B, Waldenberger M, Peters A, Brenner H, et al. DNA methylation signatures in peripheral blood strongly predict all-cause mortality. Nat Commun. 2017;8(1):14617. doi:10.1038/ncomms14617.
- Perna L, Zhang Y, Mons U, Holleczek B, Saum K-U, Brenner H. Epigenetic age acceleration predicts cancer, cardiovascular, and all-cause mortality in a German case cohort. Clin Epigenetics. 2016;8(1):64. doi:10.1186/s13148-016-0228-z.
- Yang Z, Wong A, Kuh D, Paul DS, Rakyan VK, Leslie RD, Zheng SC, Widschwendter M, Beck S, Teschendorff AE, et al. Correlation of an epigenetic mitotic clock with cancer risk. Genome Biol. 2016;17(1):205. doi:10.1186/s13059-016-1064-3.
- Marioni RE, Shah S, McRae AF, Chen BH, Colicino E, Harris SE, Gibson J, Henders AK, Redmond P, Cox SR, et al. DNA methylation age of blood predicts all-cause mortality in later life. Genome Biol. 2015;16(1):25. doi:10.1186/s13059-015-0584-6.
- van Niekerk G, Davids LM, Hattingh SM, Engelbrecht AM. Cancer stem cells: A product of clonal evolution? Int J Cancer. 2017;140:993–999. doi:10.1002/ijc.30448.
- Chen H, Lin F, Xing K, He X. The reverse evolution from multicellularity to unicellularity during carcinogenesis. Nat Commun. 2015;6:6367. doi:10.1038/ncomms7367.
- Ren J-T, Wang M-X, Su Y, Tang L-Y, Ren Z-F. Decelerated DNA methylation age predicts poor prognosis of breast cancer. BMC Cancer. 2018;18:989. doi:10.1186/s12885-018-4884-6.
- Yu SJ, Kim YJ. Hepatitis B viral load affects prognosis of hepatocellular carcinoma. World J Gastroenterol: WJG. 2014;20:12039. doi:10.3748/wjg.v20.i34.12039.
- Lee S-M, Lee Y-G, Bae J-B, Choi JK, Tayama C, Hata K, Yun Y, Seong J-K, Kim Y-J. HBx induces hypomethylation of distal intragenic CpG islands required for active expression of developmental regulators. Proc Natl Acad Sci. 2014;111(26):9555–9560. doi:10.1073/pnas.1400604111.
- Tian Y, Ou J-H. Genetic and epigenetic alterations in hepatitis B virus-associated hepatocellular carcinoma. Virol Sin. 2015;30:85–91. doi:10.1007/s12250-015-3582-7.
- Wong JW, Wong GH, Tsoi KF, Wong VS, Cheung SS, Chong CN, et al. Meta‐analysis: the efficacy of anti‐viral therapy in prevention of recurrence after curative treatment of chronic hepatitis B‐related hepatocellular carcinoma. Aliment Pharmacol Ther. 2011;33:1104–1112. doi:10.1111/j.1365-2036.2011.04634.x.
- Tzeng H-T, Tsai H-F, Chyuan I-T, Liao H-J, Chen C-J, Chen P-J, Hsu P-N. Tumor necrosis factor-alpha induced by hepatitis B virus core mediating the immune response for hepatitis B viral clearance in mice model. PLoS One. 2014;9(7):e103008. doi:10.1371/journal.pone.0103008.
- Valaydon Z, Pellegrini M, Thompson A, Desmond P, Revill P, Ebert G. The role of tumour necrosis factor in hepatitis B infection: Jekyll and Hyde. Clin Transl Immunol. 2016;5(12):e115. doi:10.1038/cti.2016.68.
- Voorneveld P, Kodach L, Jacobs R, Van Noesel C, Peppelenbosch M, Korkmaz K, Molendijk I, Dekker E, Morreau H, van Pelt GW, et al. The BMP pathway either enhances or inhibits the Wnt pathway depending on the SMAD4 and p53 status in CRC. Br J Cancer. 2015;112(1):122. doi:10.1038/bjc.2014.560.
- Perugorria MJ, Olaizola P, Labiano I, Esparza-Baquer A, Marzioni M, Marin JJ, Bujanda L, Banales JM. Wnt–β-catenin signalling in liver development, health and disease. Nat Rev Gastro Hepatol. 2019;16:121–136. doi:10.1038/s41575-018-0075-9.
- Tian Y, Morris TJ, Webster AP, Yang Z, Beck S, Feber A, Teschendorff AE. ChAMP: updated methylation analysis pipeline for illumina BEADCHIPS. Bioinformatics. 2017;33(24):3982–3984. doi:10.1093/bioinformatics/btx513.
- Pidsley R, Wong CC, Volta M, Lunnon K, Mill J, Schalkwyk LC. A data-driven approach to preprocessing Illumina 450K methylation array data. BMC Genomics. 2013;14:293. doi:10.1186/1471-2164-14-293.
- Du P, Zhang X, Huang -C-C, Jafari N, Kibbe WA, Hou L, Lin SM. Comparison of beta-value and M-value methods for quantifying methylation levels by microarray analysis. BMC Bioinform. 2010;11(1):587. doi:10.1186/1471-2105-11-587.
- Chen Y, Yao H, Thompson EJ, Tannir NM, Weinstein JN, Su X. VirusSeq: software to identify viruses and their integration sites using next-generation sequencing of human cancer tissue. Bioinformatics. 2012;29:266–267. doi:10.1093/bioinformatics/bts665.
- Love MI, Huber W, Anders S. Moderated estimation of fold change and dispersion for RNA-seq data with DESeq2. Genome Biol. 2014;15:550. doi:10.1186/s13059-014-0550-8.
- Yu G, Wang L-G, Han Y, He Q-Y. clusterProfiler: an R package for comparing biological themes among gene clusters. OMICS. 2012;16:284–287. doi:10.1089/omi.2011.0118.
- Subramanian A, Tamayo P, Mootha VK, Mukherjee S, Ebert BL, Gillette MA, Paulovich A, Pomeroy SL, Golub TR, Lander ES, et al. Gene set enrichment analysis: a knowledge-based approach for interpreting genome-wide expression profiles. Proc Natl Acad Sci. 2005;102(43):15545–15550. doi:10.1073/pnas.0506580102.
- Shyr C, Tarailo-Graovac M, Gottlieb M, Lee JJ, van Karnebeek C, Wasserman WW. FLAGS, frequently mutated genes in public exomes. BMC Med Genomics. 2014;7:64. doi:10.1186/s12920-014-0064-y.
- Mayakonda A, Lin D-C, Assenov Y, Plass C, Koeffler HP. Maftools: efficient and comprehensive analysis of somatic variants in cancer. Genome Res. 2018;28:1747–1756. doi:10.1101/gr.239244.118.
- Lawrence MS, Stojanov P, Polak P, Kryukov GV, Cibulskis K, Sivachenko A, Carter SL, Stewart C, Mermel CH, Roberts SA, et al. Mutational heterogeneity in cancer and the search for new cancer-associated genes. Nature. 2013;499(7457):214. doi:10.1038/nature12213.
- Meira-Machado L, Cadarso-Suárez C, Gude F, Araújo A. smoothHR: an R package for pointwise nonparametric estimation of hazard ratio curves of continuous predictors. Comput Math Methods Med. 2013;2013:745742-745752.doi: 10.1155/2013/745742.