
ABSTRACT
The prognosis of AML is generally poor, with 5-year survival rate of 25%. There has been substantial progress in identification of new therapeutic targets, along with approval of at least three targeted therapies for AML in recent years. Nevertheless, treatment has largely remained unchanged over couple of decades, with ~40% patients not achieving remission. AML is a highly heterogenous disease and there is a need for a preclinical platform to understand the heterogeneity and tumor microenvironment that can guide therapy selection. In this study, we employed an ex vivo tumor explant model to study tumor microenvironment and to select a treatment course for AML patients. Our data reveal dysregulation of DNA methyltransferase (DNMT) and histone deacetylase (HDAC) in a subset of AML patients. Based on this observation, epigenetic modulators azacitidine and panobinostat alone and in combination, were evaluated as treatment regimens in cytarabine refractory tumors. More than 50% of the treated samples showed response to the combination therapy. In order to explore alternate treatment modalities for tumors refractory to these epigenetic modulators, TCGA data analysis was done which revealed increased expression and hypomethylation of IFNGR1/2, suggesting activation of JAK/STAT pathway in AML. This was further interrogated ex vivo, with p-STAT3 expression in patients’ samples. Fedratinib, a JAK/STAT inhibitor was evaluated and 78% tumor efficacy response was achieved. Taken together, our data indicate that ex vivo platform derived from patient samples is capable in guiding optimal therapy selection for various classes of drugs including identification of novel targeted therapies.
Introduction
The genetic plasticity of cancer cells results in the inherent ability of tumor to constantly evolve and adapt under pressure. This leads to a highly heterogenous and dynamic landscape of diverse clonal subpopulations. Further, this landscape shifts with disease progression and/or during a treatment. This spatio-temporal heterogeneity of cancer often leads to failure of predictive and prognostic biomarkers. Hence, a targeted therapy that is being directed toward an actionable mutation often falls short in efficacy. This is predominantly due to molecular and phenotypic heterogeneity among cancer cells, particularly if mutation(s) is/are present in a small subcloneCitation1. Further, a cytotoxic chemotherapy itself can induce mutations in cells or can bias the selection toward a drug-resistant subclone by eliminating sensitive clones.Citation2 This aspect of cancer cells, represents a significant challenge in therapy selection.
Acute myeloid leukemia (AML) has been established as a highly heterogenous hematological malignancy. Cytogenetic analysis in adults with de novo AML has shown that about 52% of patients have nonrandom chromosomal abnormalities (e.g., deletions, translocations). Some of these abnormalities have been associated with longer remission and survival, while some have been associated with poor therapy outcome and shorter survival.Citation3 Even within the cytogenetically normal AML subgroup, a substantial genetic and epigenetic diversity exists with complex interplays,Citation4,Citation5 and not all patients within this subgroup show a similar response to treatment. Thus, the risk pattern in AML and the clinical outcomes are determined based on cytogenetic abnormalities, mutations leading to over- or underexpression of one or many proteins, and/or epigenetic changes. This is further complicated by the fact that the disease evolves over time and multiple competing clones coexist at any given point of time.
Several new targeted agents have been recently approved for clinical use. In 2017, FDA approved 2 targeted therapies for AML, midostaurin (Rydapt®) for patients with mutation in the FLT3 geneCitation6 and enasidenib (Idhifa®) for patients with IDH2 mutation.Citation7 In 2018, ivosidenib (Tibsovo®) was approved by FDA for the treatment of patients with IDH1 mutation. Despite the progress in understanding of AML biology and identification of new therapy targets, treatment of AML has largely remained unchanged over the last couple of decades.Citation8 This is probably because clinical implications of the biological intricacies of AML are still largely unclear. Cytarabine has historically been one of the major drugs used in the treatment of AML. It is used both as remission-induction therapy and postremission consolidation therapy.Citation9,Citation10 However, with the current treatment protocols, about 20%–40% of patients still do not achieve remission with standard chemotherapy, and 50%–70% of first complete remission (CR) patients often relapse over a time period of 3 years. Especially in elderly patients over 60 years, despite achievement of reasonable complete response rates (CR rates 35%–55%), intensive chemotherapy is associated with high incidence of 4-week mortality and with 3- to 5-year survival rates of < 10%.Citation11,Citation12 Further, prognosis for patients with AML refractory to first-line treatment or in relapsed cases is generally poor.Citation10 Recent studies have raised the possibility that chemotherapy itself contributes to relapse of AML by generating new mutations in the founding clone or one of the subclones, which then undergoes selection and clonal expansion.Citation13 Therefore, rational use of treatment options is critical, and it is important that physicians make informed decision toward the course of treatment. Attempts have been made to develop risk stratification panels based on cytogenetics and mutational patterns that broadly classifies AML patients into various risk groups, with an aim to predict therapy outcomes.Citation12,Citation14,Citation15 However, there is still a pressing need for a platform that will provide near real-time information on treatment outcome for individual patients in a personalized setting.
In this study, we employed an ex-vivo tumor explant model (CANscript™) to select a treatment course for AML patients. CANscript™ platform offers a comprehensive system that mimics patient tumor microenvironment by preserving heterogeneity, tumor/stroma ratios and integrity of pathway networks in an individualized ex vivo functional system. The platform is capable of guiding optimal treatment selection for various classes of agents including epigenetic modulators and at early stage of clinical evaluation in many indications including AML.Citation16
Results:
Ex vivo, functional platform predicts response to cytarabine therapy
Eight patient samples, which were confirmed cases of AML were recruited in the first round of this study. Tumor samples were analyzed on a personalized tumor explant culture system (CANscriptTM) to predict response to cytarabine, which is one of the standard of care options in treatment of AML. Treatment efficacy was evaluated by assessing changes in tumor cell viability (CCK8), morphology (H&E), proliferation (Ki-67) and induction of apoptosis (cleaved caspase-3) after treating tumor explants with cytarabine. Inputs from these parameters were integrated into a mathematical algorithm (SVMpAUC) to generate a single score (S-Score).Citation16 Our study demonstrated that S-Score can segregate patients into populations of responders (S-score >19.1) and nonresponders (S-score ≤ 19.1) to a given therapy with high positive predictive value. Analysis of S-scores revealed that of the eight samples treated with cytarabine, three were predicted responders and 5 were predicted nonresponders to the drug (). Amongst these eight patients, two patients (P4 and P8) were treated with low dose cytarabine monotherapy (30 mg/m2) in clinic and there was no remission of the disease showing concordance with CANscript prediction (), Supplementary Table S1). The other six samples were treated in clinic with a different treatment regimen than what was tested using our ex vivo platform.
Table 1. Cytarabine response pattern in first round of recruited patient samples
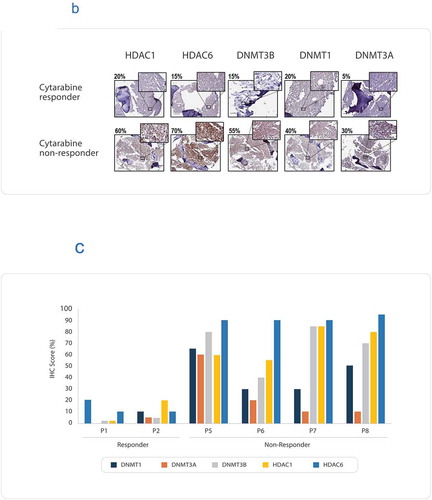
Figure 1. (a) Flow diagram showing AML patient recruitment, CANscriptTM prediction to cytarabine monotherapy and their clinical response. (b) Representative IHC images showing expression levels of: DNMT1, DNMT3A, DNMT3B, HDAC1, and HDAC6. The images were taken from sections of a tumor sample responder to cytarabine and a tumor sample nonresponder to cytarabine. The responder and nonresponders were determined from S-score, with S-Score > 19.1 being classified as responders and S-Score ≤ 19.1 being considered nonresponders. The IHC score (%) have been shown with each image. (c) IHC scores (%) are shown for the biomarkers DNMT1, DNMT3A, DNMT3B, HDAC1, and HDAC6, in two responder and four nonresponder samples. IHC scores were based on percentage of tumor cells expressing the marker
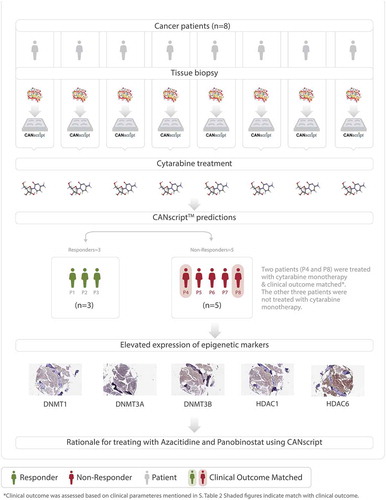
Figure 1. (Continued)
Epigenetic modulation in tumors nonresponsive to cytarabine
Epigenetic abnormalities have been implicated in drug response pattern in AML. Epigenomic profiling have revealed hypermethylation in AML.Citation11,Citation17 In AML, frequent upregulation of DNMT1, DNMT3A, and DNMT3B have been reported.Citation18 Histone deacetylases, HDAC1 and HDAC6, have been reported to be frequently overexpressed in AML.Citation19,Citation20 Studies reveal that down-regulation of both HDACs 1 and 6 is critical in enhancing cytarabine-induced apoptosis in pediatric AML.Citation21
We evaluated the expression of DNMT1, DNMT3A, DNMT3B, HDAC1, and HDAC6 using IHC in the cytarabine nonresponder samples. In one tumor sample (P4), the markers could not be evaluated owing to the paucity of sample. All four predicted nonresponders to cytarabine revealed high scoring pattern for DNMT1, DNMT3B (≥ 30%) compared to the responders (≤ 20%) ()). Previous studies have correlated expression levels of DNMT1 and DNMT3B with aberrant hypermethylation of p15INAKCitation4B tumor suppressor gene in AML.Citation18 Further, analysis of HDAC expression revealed that all nonresponders had high expression scores of both HDAC1 and HDAC6 (>50%) (). In contrast, in the two cytarabine responder samples, the expressions of all epigenetic markers evaluated were much lower than that of the nonresponders (≤ 20%) (). Due to limitation of sample availability, we were unable to test the DNA methylation status in these samples using methylation specific PCR. Based on the elevated expression of the epigenetic markers in the nonresponder group, we attempted to evaluate if epigenetic modulators can be selected as alternative treatment regimens for patients who do not respond to cytarabine treatment. Azacitidine is a DNA methyltransferase (DNMT)-inhibiting cytosine nucleoside analogue, approved for the treatment of MDS and AML in the United States and European Union. Azacitidine reduces genomic DNA methylation by irreversibly binding to DNA methyltransferases (DNMT) after incorporation into newly synthesized DNA.Citation22 In addition, the covalent protein-DNA adduct formation triggers DNA damage and results in eventual cell death.Citation22 Panobinostat is a hydroxamic acid-based pan-HDAC inhibitor approved under FDA’s accelerated approval program for the treatment of multiple myeloma. This prompted us to undertake next round of assessment that involved evaluating azacitidine and panobinostat alone and in combination for the treatment of AML.
In the next round, seven patient samples were recruited. Each of the seven samples were treated on the ex vivo platform with four treatment arms, namely (i) cytarabine monotherapy; (ii) azacitidine monotherapy; (iii) panobinostat monotherapy; and (iv) azacitidine + panobinostat combination therapy. Drug responsiveness was determined using multiparametric phenotypic assays. All 7 tumor samples were nonresponders to cytarabine, one (P28) responded to azacitidine monotherapy, and one sample (P11) responded to panobinostat monotherapy. Five samples (including the two samples that responded to azacitidine monotherapy (P28) and panabinostat monotherapy (P11)) responded to azacitidine + panobinostat combination therapy (), ). Two samples were nonresponders to all four treatment arms, including azacitidine + panobinostat combination therapy (P9 and P13). Supplementary Figure. S1A and S1B show representative images for H&E, Ki-67, and Caspase-3 C in cytarabine refractory samples which were responders and nonresponders respectively to epigenetic modulators. In the clinic, four patients (P9, P11, P13, and P14), were treated with cytarabine monotherapy, one patient (P28) was treated with azacitidine monotherapy, and two patients (P10 and P12) were treated with decitabine, another DNMT-inhibiting cytosine nucleoside analogue. Incidentally, in an earlier report, azacitidine and decitabine were shown to have similar clinical outcome in terms of objective response rates, overall survival, and event-free survival.Citation23 Clinical outcome revealed that of the four patients treated with low dose cytarabine monotherapy none showed remission of disease, thereby matching the CANscript prediction. The other three patients were not treated with cytarabine monotherapy, hence it was not feasible to match their clinical prognosis with CANScript response prediction. In addition, one patient (P28) who was predicted as a responder to azacitidine monotherapy, also showed response in clinic when treated with azacitidine. Two patients (P10 and P12), who were treated with decitabine did not show remission, hence matching the CANscript predicted outcome to azacitidine (), Supplementary Table S1). None of the recruited patient samples were treated in clinic with panobinostat or with the combination of azacitidine and panobinostat.
Table 2. Response pattern to the following drug arms (i) cytarabine, (ii) azacitidine, (iii) panobinostat, and (iv) combination of azacitidine and panobinostat in the second round of recruitment
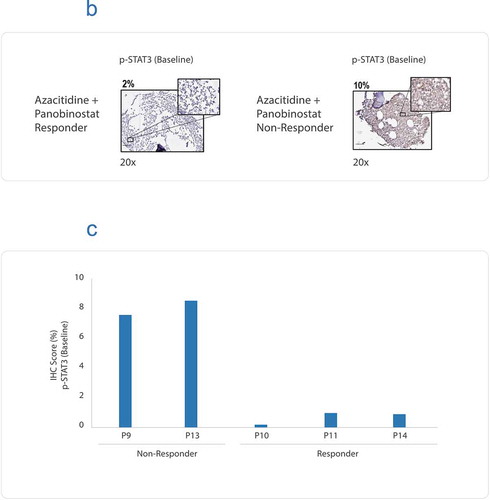
Figure 2. (a) Flow diagram showing AML patient recruitment, CANscriptTM prediction to the indicated treatment arms and their clinical response. (b) Representative IHC images showing baseline expression levels of p-STAT3, in a azacitidine and panobinostat (Aza + Pano) responder and a Aza + Pano nonresponder. The responder and nonresponders were determined from S-score. (c) IHC scores (%) are shown for basal expression in two nonresponder and three responder samples. IHC scores were based on percentage of tumor cells expressing the marker
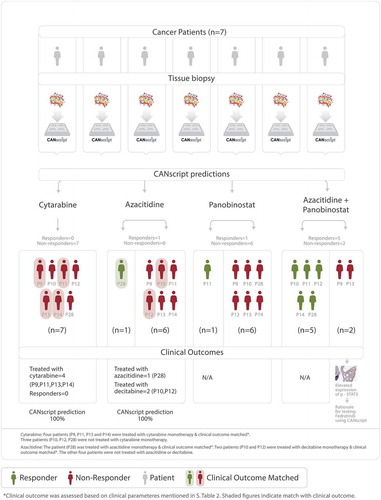
Figure 2. (Continued)
Activation of JAK/STAT pathway in tumors refractory to epigenetic modulators
Dysregulation of JAK-STAT pathway has been documented in many hematologic malignancies and members of the JAK/STAT pathway have been proposed as targets in chemotherapy resistant AML.Citation24 In order to elucidate if JAK/STAT pathway is indeed activated in AML, we studied the expression and methylation status of genes in AML patients using The Cancer Genome Atlas (TCGA) database (https://portal.gdc.cancer.gov/projects/TCGA-LAML). TCGA data indicated the highest variation in DNMT3A in AML and its association with poor survival. To assess the expression level of DNMTs, RNAseq (transcriptomic data) and methylation data (n = 100) was derived from TCGA database for AML patients. Data pre-processing and normalization steps were performed using in-house perl scripts. The resulting matrix contained mRNA expression information for ~17 K genes across all analyzed samples. Genes with FPKM >1 were considered for further analysis. Transcriptomic data indicates increased expression of DNMT (DNMT1, DNMT3A, and DNMT3B) family of genes in AML patients (Supplementary Table S2A). These findings were in line with the experimental data, which showed high expression of DNMTs in the cytarabine nonresponders and suggested the possibility of using a DNMT inhibitor along with a HDAC inhibitor in cytarabine refractory tumors. In addition, the transcriptomic data also revealed increased expression of IFNGR1, IFNGR2, and STAT3 (Supplementary Table S2A). Next, methylation data preprocessing and normalization steps were performed using in-house perl scripts. Genes with beta value ≥ 0.8 were considered as hypermethylated and beta value ≤ 0.2 were considered as hypomethylated. We observed hypomethylation of IFNGR1, IFNGR2, and STAT3 genes (Supplementary Table S2C, S2E). The TCGA data showing increased expression along with hypomethylation of IFNGR1, IFNGR2 suggested activation of the JAK/STAT pathway.Citation25 TCGA data indicated hypomethylation of several gene components of JAK-STAT pathway, which was correlated with an increased expression of these genes in RNAseq data (Supplementary Figure S2, Supplementary Table S2). Taken together this data indicates aberrant expressions for DNMTs/HDACs and activation in JAK/STAT pathway in AML patients. This prompted us to test the expression of activated STAT-3 and BCl2L10 (a Bcl-2 family protein and an independent prognostic factor of azacitidine outcome in AML)Citation26 in patients who are predicted nonresponders to azacitidine and panobinostat.
We studied the cellular expression of p-STAT3 and BCL2L10 in tumor samples, which were nonresponders to azacitidine and panobinostat therapy. Data revealed that that the two nonresponders (to all the three treatment arms, P9 and P13) had high basal expression of both p-STAT3 () and BCL2L10 (Supplementary Figure S3). In contrast, the 3 responders to azacitidine and panobinostat combination therapy (P10, P11, and P14) demonstrated lower p-STAT3 scores (. We next attempted to evaluate efficacy of fedratinib, a JAK inhibitor shown to suppress phosphorylation of STAT3.Citation27
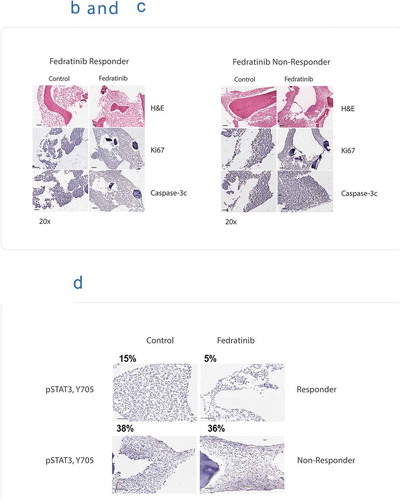
In the next round, 16 patient samples were recruited. Ten of the 16 samples were each treated on the ex vivo CANScript platform with 5 treatment arms, (i) cytarabine; (ii) azacitidine monotherapy; (iii) panobinostat monotherapy; (iv) azacitidine + panobinostat combination therapy; and (v) fedratinib. Four samples were treated with only cytarabine owing to insufficient size of tissue. One sample was treated with two treatment arms, cytarabine and fedratinib, and one sample was treated with cytarabine and all three arms of epigenetic modulators. Drug response patterns were determined using phenotypic assays. Interestingly, of the 11 samples treated with fedratinib, 8 tumors showed response, of which 5 were nonresponders to all other treatment arms (, . For this cohort, none of the patients received treatment regime as was tested using CANScript. We studied the cellular expression of p-STAT3 in tumor samples, which were responder and nonresponder to fedratinib therapy. It was observed that nonresponder to fedratinib had high basal level of p-STAT3 (38%) and it remained unchanged (36%) after treatment with fedratinib. In contrast, in the responder sample, there was a decrease in p-STAT3 level post fedratinib treatment (15% and 5% respectively) ()).
Table 3. The response pattern to the following drug arms (i) cytarabine, (ii) azacitidine, (iii) panobinostat, (iv) combination of azacitidine and panobinostat, and (v) Fedratinib in the final round of recruitment
Figure 3. (a) Flow diagram showing AML patient recruitment, CANscriptTM prediction to the indicated treatment arms. (b) CANscriptTM identifies responders to fedratinib test arms of tumors refractory to all treatment arms of epigenetic modulators. Representative images taken from sections stained with H&E, Ki-67, and active Caspase-3. (c) CANscriptTM identifies nonresponders to fedratinib test arms of tumors refractory to all treatment arms of epigenetic modulators. Representative images taken from sections stained with H&E, Ki-67, and active Caspase-3. (d) Representative IHC images showing expression levels of p-STAT3 at basal and posttreatment with fedratinib, in a fedratinib responder and a nonresponder
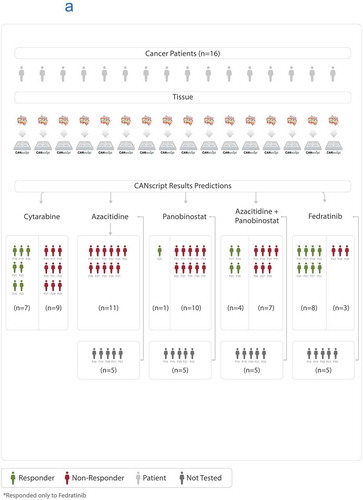
Figure 3. (Continued)
Using this platform, we demonstrated that overall ~32% (10/31) of AML patient samples responded to cytarabine. Based on an overall trend toward a higher expression of epigenetic markers in the nonresponder group, we postulated that epigenetic modulators azacitidine and panobinostat, could be tested as an alternate treatment regimen for cytarabine refractory AML. We observed that 50% (9/18) of patient samples responded to azacitidine+panobinostat combination therapy, and 11% (2/18) and 5.5% (1/18) responded to panobinostat and azacitidine monotherapies respectively. Next, based on high expression of p-STAT3 among nonresponders to treatment by epigenetic modulators, we selected fedratinib as a treatment arm. Interestingly ~73% (8/11) of the treated patient samples responded to fedratinib (Supplementary Figure S4). When we compared the expression levels of epigenetic markers DNMT1, DNMT3A, DNMT3B, HDAC1, and HDAC6, we observed a general trend toward a higher expression of the markers in cytarabine nonresponders and a lower expression of the markers in cytarabine responders (Supplementary Figure S5A and S5B). Similarly, expression of p-STAT3, both under basal condition and posttreatment with azacitidine and panobinostat combination, showed a higher expression in the nonresponder group of azacitidine and panobinostat combination therapy compared to the responder groups (Supplementary Figure S6A and S6B). However, there were outliers within both groups. We concluded that while biomarkers used in this study provide important insight into the choice of therapy, the biomarkers alone were not sufficient as predictive/prognostic factors in selecting treatment at an individual level for AML patients.
Our study demonstrates that CANscriptTM as a suitable platform to guide personalized treatment selection in hematological malignancies like AML. Furthermore, data from our CANscript platform suggests that the JAK/STAT pathway can be further investigated as a novel therapeutic target in AML.
Discussion
In the present study, we have used an ex vivo tumor microenvironment platform (CANscriptTM) that effectively recreates intratumoral heterogeneity close to that of the patient. The platform provides functional and phenotypic assessment of drug response on a patient’s tumor conserved in a native tumor microenvironment. Previous studies described ex vivo and in vivo preclinical models for AML to investigate therapeutic response or for understanding mechanistic underpinnings.Citation28–33 CANscriptTM is a unique platform that has been developed as a clinically relevant predictive model, in which a tumor ecosystem is reconstructed ex vivo with grade-matched tumor matrix support in the presence of matched autologous serum. The ex vivo tumor ecosystem, together with a machine learning algorithm form a powerful personalized system for predicting the therapeutic efficacy of anticancer drugs in hematological malignancies based on purely phenotypic readouts.
Using the ex vivo, functional platform, we demonstrated that only 32% of AML patient samples responded to the standard of care cytarabine. Studies have shown complete cytarabine response rates between 40 and 80% of patients stratified into poor, intermediate, and favorable genetic risk groups respectivelyCitation34 defined according to recommendations published earlier.Citation14 Chemoresistance in AML has been attributed to hypermethylation of gene promoters and associated silencing of tumor suppressor genes. Methylation of mammalian genomic DNA is catalyzed by DNA-methyltransferase enzymes (DNMTs). Drugs that inhibit DNA methylation have been used in AML and shown to enhance cytarabine sensitivity.Citation35 Posttranslation modifications in histone, including acetylation, deacetylation, and phosphorylation are other important epigenetic changes in humans. Their dysregulation is brought about by changes in histone acetylation (HAT) and deacetylation (HDAC) and has been implicated in several malignancies including AML.Citation36 HDAC enzymes have been shown to be overexpressed in several leukemias and are evaluated as drug targets. Several HDAC inhibitors (HDI) are in clinical trials and four are approved in the clinic.Citation37 We evaluated the epigenetic markers both in an attempt to explain cytarabine nonresponsiveness and also to guide our decision toward the selection of epigenetic modulators as one of the treatment options for patients refractory to cytarabine. Based on the expression pattern of the epigenetic markers, we next included three additional treatments arms, namely, azacitidine monotherapy, panobinostat monotherapy, and azacitidine and panobinostat combination therapy. Our data indicated that 5% and 11% of patient samples in the overall study cohort responded to azacitidine and panobinostat monotherapies respectively as per response prediction done on an ex vivo, functional platform developed in our labs. Previous reports indicate that when panobinostat was used alone in the clinics for hematologic malignancies, responses were observed in 4/83 (5%) patients with AML and 1/11 (9%) patients with MDS.Citation38 In contrast, panobinostat used in combination with azacitidine resulted in an overall clinical response of 35% (AML 31%, MDS 50%).Citation39 In addition, in a preclinical study, panobinostat was shown to act synergistically with decitabine, another demethylating agent, causing greater reduction in AML cell viability compared to the single agents alone.Citation40 Contrasting results were obtained from another recent clinical trial data, where panobinostat did not enhance the therapeutic benefits of azacitidine in AML, even though improved responses were seen in CMML and MDS with the combination therapy.Citation41 Using our ex vivo platform, we observed that ~50% of patient samples responded to azacitidine and panobinostat combination therapy. Previous studies have used whole genome approaches to determine the genetic causes for cytarabine sensitivity.Citation42,Citation43 While these studies are important in predicting response of AML patients to cytarabine treatment, very few studies have actually provided an actionable strategy for rationally selecting a treatment course in patients who do not respond to cytarabine. Using our personalized approach, we have shown that azacitidine and panobinostat combination can be an alternative treatment option for patients who are refractory to cytarabine. Notably, of the 15 patients’ samples recruited in the first two rounds, 9 patients had received a treatment matching the drug arms tested on CANscriptTM. A full concordance was observed in this small cohort of patients, between clinical response and CANscriptTM predicted response. Next, we attempted to rationalize a therapy option for tumors that did not respond to any of the epigenetic modulators.
We observed activation of the JAK/STAT pathway using TCGA data for AML patients. STAT signaling contributes to cellular transformation through modulation of target genes. Following phosphorylation by various kinases, STATs translocate to the nucleus, bind to a consensus site in the promoter of target genes, and activate or repress transcription. Targets of STATs include genes involved in promoting proliferation, survival, angiogenesis and invasion, including the Bcl-2 family of genes.Citation44 Aberrant activation of STAT3 has been observed in AML and been associated with poor prognosis and chemoresistance in AML.Citation45 Activation of STAT3 has been correlated with the overexpression of Bcl-2 family of proteins.Citation46,Citation47 High levels of phosphorylated STAT3 have also been implicated in lack of clinical response to vorinostat, another hydroxamic acid-based pan-HDAC inhibitor.Citation48 In other studies, BCL2L10, an antiapoptotic member of the Bcl-2 family, has been correlated with azacitidine resistance.Citation26 Majority of the nonresponders to azacitidine and panobinostat combination therapy showed both high basal levels of phosphorylated-STAT3 compared to the responders. We evaluated fedratinib, a JAK2 inhibitor shown to reduce STAT3 phosphorylation, as a potential treatment regimen for AML.Citation27 In a previously reported clinical trial, ruxolitinib, the only FDA approved JAK2 inhibitor was evaluated in patients with refractory AML and showed modest antileukemic activity.Citation49 In a more recent study, fedratinib was shown to reduce leukemia in mouse xenograft models in 59% of cases, while ruxolitinib was ineffective.Citation50 Using our ex vivo platform we showed a predicted response rate of ~73% (8/11) to fedratinib treatment. We do not rule out the activation of other pathways in AML cases which are nonresponder to cytarabine monotherapy or epigenetic modulators. Indeed, we do note that amongst the 16 patients recruited in third round (), 3 patients did not respond to fedratinib as per our ex vivo platform prediction. Further experiments are required to understand the cause of this nonresponse, which is beyond the scope of this manuscript.
In this study, we have developed an ex vivo, phenotypic platform that maintains the native tumor contexture and thereby captures the inherent complexity of this key hematological malignancy, AML in a personalized setting. Using the platform, we have demonstrated rational selection of treatment modalities for AML. We have depicted fedratinib as a novel therapeutic agent in AML patients who are nonresponders to cytarabine or azacitidine. Recent advances in diagnosis and management of AML based on genetic testing has been recommended by European Leukemia Net (ELN), which also includes the dose recommendations of cytarabine.Citation15,Citation51 Taken together our current data establish CANscriptTM as a personalized ex vivo platform to guide treatment course in AML. We have also shown a good correlation with results from previously reported clinical studies. Further, we have shown concordance with clinical outcome in patients who received matching treatment arms as those tested on the CANscriptTM platform. Our study is limited by the small cohort of patient samples and further by the fact that matching clinical outcome was available for an even smaller subset. Further clinical validation of this using larger sets of patient samples is required to understand the clinical outcome of fedratinib in AML.
Materials and methods
Patients
Bone marrow biopsies (n = 31) from patients with AML (Supporting Information ) were collected in Lactate Ringer’s transport buffer and transported in BD Vacutainer tubes (BD Biosciences, USA) to the laboratory. Informed consent was received prior to collection of clinical tissue specimens from the patients. Blood samples were also collected from the same patients and maintained under refrigerated condition for further use. The experimental study protocol was approved by the Institutional Review Board (IRB) of the respective hospitals and carried out in accordance with regional guidelines and standards. All experiments were commenced within 24 hours of the biopsies. A summary of the demographic is listed in Supplementary Table S3.
Drugs
Azacitidine (Natco Pharma, India; Catalog no.: 500152), Panobinostat (Selleckchem, TX, USA; Catalog no: S1030), Cytarabine (Sigma-Aldrich, MO, USA; Catalog no: C1768), Fedratinib (Selleckchem, MO, USA; Catalog no: S2736) were procured. The explants were treated with the dugs at the following concentrations based on their Cmax values. The Cmax values were 638 ng/ml for Azacitidine, 21.6 ng/ml for Panobinostat, 26.3 ng/ml for Cytarabine, and 525 ng/ml for Fedratinib.
CANscript explant culture
Bone marrow biopsies were manually dissected to the explant size of 2–3 mm3. These explants were randomized in the culture to ensure tumor heterogeneity. The explants were cultured either in triplicate or quadruplicate in 48 well plate coated with indication specific tumor matrix proteins as described.Citation16,Citation52 The plates were observed under inverted phase contrast microscope every 24 h to ascertain tissue integrity.
Viability assay
Tumor cell viability was assessed by Cell Counting Kit-8 (CCK-8) (Dojindo). Briefly, one-tenth of the volume of the CCK-8 solution was added to each well of the plate and incubated at 37°C for 3 h in a 5% CO2 incubator under humidified condition. Absorbance was measured at 450 nm using a multimode microplate reader (EnSpire®, Perkin Elmer, MA, USA). Baseline samples (T0) were used as calibrators (1×) to normalize intersample variation in absorbance readings. The results were expressed as a percentage of tumor cell viability or inhibition relative to vehicle controls.
Histopathological evaluation
Histological characterization of AML explants was conducted before and after culture. A small part of the bone marrow biopsies were fixed in 10% formalin immediately after the biopsy and embedded in paraffin (T0 baseline). Following decalcification (5% HCl for 2–3 days), the explants were sectioned at 4 µm and stained with hematoxylin and eosin. The explants receiving different treatments were graded and scored according to standard clinical criteria.Citation53
Immunohistochemical analysis
Immunohistochemistry (IHC) of the tissue sections were performed using tissue sections, to study the expression profiles of biomarkers Ki-67, active Caspase-3, DNMT1, DNMT3A, DNMT3B, histone deacetylase 1 (HDAC1), and histone deacetylase 6 (HDAC6). Antigen retrieval was done by using Antigen Unmasking Solution (Vector Laboratories, CA, USA). For each IHC staining, appropriate positive and negative controls were included. Microphotographs were taken at 200× using Leica DM-2500 Microscope (Leica Microsystems, Germany). Changes in the levels of cell proliferation or cell death after drug treatment (compared to vehicle control) were evaluated by specific proliferation/apoptosis markers using rabbit polyclonal Ki-67 at 1:600 dilution (Vector Laboratories, CA, USA), and rabbit polyclonal caspase-3 (cleaved) antibodies at 1:600 dilution (Cell Signaling Technology, MA, USA). For detecting levels of the epigenetic markers, the following antibodies were used, rabbit polyclonal anti-DNMT1 at dilution of 1: 500 (Catalog number: ab19905; Abcam, USA), rabbit polyclonal anti-DNMT3A at of dilution 1:50 (Catalog number: HPA026588; Atlas Antibodies, Sweden), rabbit polyclonal anti-DNMT3B at dilution of 1:200 (Catalog number: HPA001595; Atlas Antibodies, Sweden), rabbit polyclonal anti-HDAC1 at dilution of 1:100 (Catalog number: ab19845; Abcam, USA), and rabbit polyclonal anti-HDAC6 at dilution of 1:200 (Catalog number: ab117516; Abcam, USA). Rabbit polyclonal anti-BCL2L10 (Catalog number: ab151419; Abcam, USA) was used at dilution 1:100 and rabbit monoclonal antibody Phosphorylated-STAT3 (Tyr705) (Catalog number: 9145; Cell Signaling Technology, MA, USA) was used at dilution 1:50. The IHC scores were given as percentage of tumor cells expressing the marker. For DNMT1, DNMT3A, DNMT3B, HDAC1, HDAC6, BCL2L10, and Phosphorylated-STAT3 (p-STAT3), the results of IHC staining were also categorized using the following cutoff percentages, 0 (0%), 1 (≤5%), 2 (6–25%), 3 (26–50%), 4 (51–75%), or 5 (>76%), respectively.Citation54
S-SCOre
Values from histology (morphology), tumor cell proliferation, cell death and viability were used as inputs in a machine learning algorithm as described earlier.Citation16,Citation52 The algorithm finally generates a single score (S-Score) which has the potential of predicting clinical outcome to therapy. A value greater than 19.1 may clinically correspond with response to the drug(s) or combinations tested in CANscriptTM, while a value lower or equal to 19.1 may indicate nonresponse.Citation16,Citation52
Transcriptome and methylation analysis using TCGA data
Txt files of 100 patients were downloaded from TCGA portal (https://portal.gdc.cancer.gov/) for AML patients. For RNAseq analysis, FPKM txt files were downloaded. Matrix of FPKM (fragments per kilo-base of transcripts per million mapped reads) values was generated using in-house perl script. Data was normalized and median value of FPKM was calculated for each gene. Genes with FPKM >1 were considered for further analysis. Similarly, for methylation analysis txt files were downloaded and a matrix of (Probe_ID, Beta_value, Gene_symbol, and Position_to_TSS) was generated using in-house perl scripts. Data normalization and median beta value for each gene was calculated. The coding genes were only considered for further analysis. Genes with a beta value ≥ 0.8 were considered as hypermethylated and a beta value ≤ 0.2 were considered as hypomethylated.
Authors’ contributions
Conception and design: Govind Babu and Saravanan Thiyagarajan
Development of methodology: Manoj Rajappa and Saravanan Thiyagarajan
Acquisition of data (CANscript data; Pathology Images/interpretation; Patient Handling and information.): Manoj Rajappa, Manjusha Biswas, Biplab Tewary, Bipinesh Sansar, Chethan Rajegowda, and Govind Babu
Computational analysis: Jayshree Advani, Aneesha Radhakrishnan, Padmaparna Chaudhuri, and Aditi Chatterjee
Writing, review, and/or revision of the manuscript: Saravanan Thiyagarajan, Ram Shankar Upadhayaya, Govind Babu, Padmaparna Chaudhuri, and Aditi Chatterjee
Study supervision: Padhma Radhakrishnan and Pradip K Majumder
Disclosure of Potential Conflicts of Interest:
Except Bipinesh Sansar, Chethan Rajegowda, Govind Babu and Jayshree Advani all authors are either employees of Mitra Biotech and/or hold equity of Mitra Biotech. The remaining authors declare no competing financial interests.
Supplemental Material
Download Zip (13.6 MB)Acknowledgments
We are grateful to Dr. Biswanath Majunder for critically reading the manuscript and scientific inputs. We thank Arun Prasath for assisting in S-score generation and Dr. Debapriya Mehrotra for pathological insights.
Supplementary material
Supplemental data for this article can be accessed on the publisher’s website.
References
- Fisher R, Pusztai L, Swanton C. Cancer heterogeneity: implications for targeted therapeutics. Br J Cancer. 2013;108:479–485. doi:10.1038/bjc.2012.581.
- Szikriszt B, Poti A, Pipek O, Krzystanek M, Kanu N, Molnar J, Ribli D, Szeltner Z, Tusnády GE, Csabai I, et al. A comprehensive survey of the mutagenic impact of common cancer cytotoxics. Genome Biol. 2016;17:99. doi:10.1186/s13059-016-0963-7.
- Byrd JC, Mrozek K, Dodge RK, Carroll AJ, Edwards CG, Arthur DC. Pretreatment cytogenetic abnormalities are predictive of induction success, cumulative incidence of relapse, and overall survival in adult patients with de novo acute myeloid leukemia: results from cancer and leukemia group B (CALGB 8461). Blood. 2002;100:4325–4336. doi:10.1182/blood-2002-03-0772.
- Cancer Genome Atlas Research N, TJ L, Miller C, Ding L, BJ R, AJ M. Genomic and epigenomic landscapes of adult de novo acute myeloid leukemia. N Engl J Med. 2013;368:2059–2074.
- Papaemmanuil E, Gerstung M, Bullinger L, Gaidzik VI, Paschka P, Roberts ND, Potter NE, Heuser M, Thol F, Bolli N, et al. Genomic classification and prognosis in acute myeloid leukemia. N Engl J Med. 2016;374(23):2209–2221. doi:10.1056/NEJMoa1516192.
- Levis M. Midostaurin approved for FLT3-mutated AML. Blood. 2017;129:3403–3406. doi:10.1182/blood-2017-05-782292.
- Stein EM, DiNardo CD, Pollyea DA, Fathi AT, Roboz GJ, Altman JK, Stone RM, DeAngelo DJ, Levine RL, Flinn IW, et al. Enasidenib in mutant IDH2 relapsed or refractory acute myeloid leukemia. Blood. 2017;130:722–731. doi:10.1182/blood-2017-04-779405.
- Saultz JN, Garzon R. Acute myeloid leukemia: a concise review. J Clin Med. 2016;5:33-49.
- Lowenberg B, Pabst T, Vellenga E, van Putten W, Schouten HC, Graux C, Ferrant A, Sonneveld P, Biemond BJ, Gratwohl A, et al. Cytarabine dose for acute myeloid leukemia. N Engl J Med. 2011;364:1027–1036. doi:10.1056/NEJMoa1010222.
- Kumar CC. Genetic abnormalities and challenges in the treatment of acute myeloid leukemia. Genes Cancer. 2011;2:95–107.
- Gutierrez SE, Romero-Oliva FA. Epigenetic changes: a common theme in acute myelogenous leukemogenesis. J Hematol Oncol. 2013;6:57. doi:10.1186/1756-8722-6-57.
- Prada-Arismendy J, Arroyave JC, Rothlisberger S. Molecular biomarkers in acute myeloid leukemia. Blood Rev. 2017;31:63–76. doi:10.1016/j.blre.2016.08.005.
- Ding L, Ley TJ, Larson DE, Miller CA, Koboldt DC, Welch JS, Ritchey JK, Young MA, Lamprecht T, McLellan MD. Clonal evolution in relapsed acute myeloid leukaemia revealed by whole-genome sequencing. Nature. 2012;481:506–510. doi:10.1038/nature10738.
- Dohner H, Estey EH, Amadori S, Appelbaum FR, Buchner T, Burnett AK. Diagnosis and management of acute myeloid leukemia in adults: recommendations from an international expert panel, on behalf of the European LeukemiaNet. Blood. 2010;115:453–474.
- Dohner H, Estey E, Grimwade D, Amadori S, Appelbaum FR, Buchner T. Diagnosis and management of AML in adults: 2017 ELN recommendations from an international expert panel. Blood. 2017;129:424–447.
- Majumder B, Baraneedharan U, Thiyagarajan S, Radhakrishnan P, Narasimhan H, Dhandapani M. Predicting clinical response to anticancer drugs using an ex vivo platform that captures tumour heterogeneity. Nat Commun. 2015;6:6169.
- Kroeger H, Jelinek J, Estecio MR, He R, Kondo K, Chung W, Zhang L, Shen L, Kantarjian HM, Bueso-Ramos CE, et al. Aberrant CpG island methylation in acute myeloid leukemia is accentuated at relapse. Blood. 2008;112:1366–1373. doi:10.1182/blood-2007-11-126227.
- Mizuno S, Chijiwa T, Okamura T, Akashi K, Fukumaki Y, Niho Y. Expression of DNA methyltransferases DNMT1, 3A, and 3B in normal hematopoiesis and in acute and chronic myelogenous leukemia. Blood. 2001;97:1172–1179. doi:10.1182/blood.V97.5.1172.
- Bradbury CA, Khanim FL, Hayden R, Bunce CM, White DA, Drayson MT, Craddock C, Turner BM. Histone deacetylases in acute myeloid leukaemia show a distinctive pattern of expression that changes selectively in response to deacetylase inhibitors. Leukemia. 2005;19:1751–1759. doi:10.1038/sj.leu.2403910.
- Wada T, Kikuchi J, Nishimura N, Shimizu R, Kitamura T, Furukawa Y. Expression levels of histone deacetylases determine the cell fate of hematopoietic progenitors. J Biol Chem. 2009;284:30673–30683. doi:10.1074/jbc.M109.042242.
- Xu X, Xie C, Edwards H, Zhou H, Buck SA, Ge Y, Pandey S. Inhibition of histone deacetylases 1 and 6 enhances cytarabine-induced apoptosis in pediatric acute myeloid leukemia cells. PLoS One. 2011;6:e17138. doi:10.1371/journal.pone.0017138.
- Gnyszka A, Jastrzebski Z, Flis S. DNA methyltransferase inhibitors and their emerging role in epigenetic therapy of cancer. Anticancer Res. 2013;33:2989–2996.
- Lee YG, Kim I, Yoon SS, Park S, Cheong JW, Min YH, Lee J-O, Bang S-M, Yi HG, Kim CS, et al. Comparative analysis between azacitidine and decitabine for the treatment of myelodysplastic syndromes. Br J Haematol. 2013;161:339–347. doi:10.1111/bjh.12256.
- Vainchenker W, Constantinescu SN. JAK/STAT signaling in hematological malignancies. Oncogene. 2013;32:2601–2613. doi:10.1038/onc.2012.347.
- Qing Y, Stark GR. Alternative activation of STAT1 and STAT3 in response to interferon-gamma. J Biol Chem. 2004;279:41679–41685. doi:10.1074/jbc.M406413200.
- Vidal V, Robert G, Goursaud L, Durand L, Ginet C, Karsenti JM, Luciano F, Gastaud L, Garnier G, Braun T, et al. BCL2L10 positive cells in bone marrow are an independent prognostic factor of azacitidine outcome in myelodysplastic syndrome and acute myeloid leukemia. Oncotarget. 2017;8:47103–47109. doi:10.18632/oncotarget.17482.
- Pardanani A, Tefferi A, Jamieson C, Gabrail NY, Lebedinsky C, Gao G, Liu F, Xu C, Cao H, Talpaz M, et al. A phase 2 randomized dose-ranging study of the JAK2-selective inhibitor fedratinib (SAR302503) in patients with myelofibrosis. Blood Cancer J. 2015;5:e335. doi:10.1038/bcj.2015.63.
- Bray LJ, Binner M, Korner Y, von Bonin M, Bornhauser M, Werner C. A three-dimensional ex vivo tri-culture model mimics cell-cell interactions between acute myeloid leukemia and the vascular niche. Haematologica. 2017;102:1215–1226. doi:10.3324/haematol.2016.157883.
- Aljitawi OS, Li D, Xiao Y, Zhang D, Ramachandran K, Stehno-Bittel L, Van Veldhuizen P, Lin TL, Kambhampati S, Garimella R, et al. A novel three-dimensional stromal-based model for in vitro chemotherapy sensitivity testing of leukemia cells. Leuk Lymphoma. 2014;55:378–391. doi:10.3109/10428194.2013.793323.
- Blanco TM, Mantalaris A, Bismarck A, Panoskaltsis N. The development of a three-dimensional scaffold for ex vivo biomimicry of human acute myeloid leukaemia. Biomaterials. 2010;31:2243–2251. doi:10.1016/j.biomaterials.2009.11.094.
- Snijder B, Vladimer GI, Krall N, Miura K, Schmolke AS, Kornauth C, Lopez de la Fuente O, Choi H-S, van der Kouwe E, Gültekin S, et al. Image-based ex-vivo drug screening for patients with aggressive haematological malignancies: interim results from a single-arm, open-label, pilot study. Lancet Haematol. 2017;4:e595–e606. doi:10.1016/S2352-3026(17)30208-9.
- Frismantas V, Dobay MP, Rinaldi A, Tchinda J, Dunn SH, Kunz J, Richter-Pechanska P, Marovca B, Pail O, Jenni S, et al. Ex vivo drug response profiling detects recurrent sensitivity patterns in drug-resistant acute lymphoblastic leukemia. Blood. 2017;129(11):e26–e37. doi:10.1182/blood-2016-09-738070.
- Brown FC, Still E, Koche RP, Yim CY, Takao S, Cifani P, Reed C, Gunasekera S, Ficarro SB, Romanienko P, et al. MEF2C phosphorylation is required for chemotherapy resistance in acute myeloid leukemia. Cancer Discov. 2018;8:478–497. doi:10.1158/2159-8290.CD-17-1271.
- Anders B, Veltri L, Kanate AS, Shillingburg A, Shah N, Craig M, Cumpston A. Outcomes of six-dose high-dose cytarabine as a salvage regimen for patients with relapsed/refractory acute myeloid leukemia. Adv Hematol. 2017;2017:6464972. doi:10.1155/2017/6464972.
- Borthakur G, Huang X, Kantarjian H, Faderl S, Ravandi F, Ferrajoli A. Report of a phase 1/2 study of a combination of azacitidine and cytarabine in acute myelogenous leukemia and high-risk myelodysplastic syndromes. Leuk Lymphoma 2010; 51:73–78.
- Ahmadzadeh A, Khodadi E, Shahjahani M, Bertacchini J, Vosoughi T, Saki N. The Role of HDACs as Leukemia Therapy Targets using HDI. Int J Hematol Oncol Stem Cell Res. 2015;9:203–214.
- Eckschlager T, Plch J, Stiborova M, Hrabeta J. Histone deacetylase inhibitors as anticancer drugs. Int J Mol Sci. 2017;18:1414–1438.
- DeAngelo DJ, Spencer A, Bhalla KN, Prince HM, Fischer T, Kindler T, Giles FJ, Scott JW, Parker K, Liu A, et al. Phase Ia/II, two-arm, open-label, dose-escalation study of oral panobinostat administered via two dosing schedules in patients with advanced hematologic malignancies. Leukemia. 2013;27:1628–1636. doi:10.1038/leu.2013.38.
- Tan P, Wei A, Mithraprabhu S, Cummings N, Liu HB, Perugini M, Reed K, Avery S, Patil S, Walker P, et al. Dual epigenetic targeting with panobinostat and azacitidine in acute myeloid leukemia and high-risk myelodysplastic syndrome. Blood Cancer J. 2014;4:e170. doi:10.1038/bcj.2013.68.
- Fiskus W, Buckley K, Rao R, Mandawat A, Yang Y, Joshi R, Wang Y, Balusu R, Chen J, Koul S, et al. Panobinostat treatment depletes EZH2 and DNMT1 levels and enhances decitabine mediated de-repression of JunB and loss of survival of human acute leukemia cells. Cancer Biol Ther. 2009;8:939–950. doi:10.4161/cbt.8.10.8213.
- Garcia-Manero G, Sekeres MA, Egyed M, Breccia M, Graux C, Cavenagh JD, Salman H, Illes A, Fenaux P, DeAngelo DJ, et al. A phase 1b/2b multicenter study of oral panobinostat plus azacitidine in adults with MDS, CMML or AML with 30% blasts. Leukemia. 2017;31:2799–2806. doi:10.1038/leu.2017.159.
- Gamazon ER, Lamba JK, Pounds S, Stark AL, Wheeler HE, Cao X, Im HK, Mitra AK, Rubnitz JE, Ribeiro RC, et al. Comprehensive genetic analysis of cytarabine sensitivity in a cell-based model identifies polymorphisms associated with outcome in AML patients. Blood. 2013;121:4366–4376. doi:10.1182/blood-2012-10-464149.
- Hartford CM, Duan S, Delaney SM, Mi S, Kistner EO, Lamba JK, Huang RS, Dolan ME. Population-specific genetic variants important in susceptibility to cytarabine arabinoside cytotoxicity. Blood. 2009;113:2145–2153. doi:10.1182/blood-2008-05-154302.
- Alvarez JV, Frank DA. Genome-wide analysis of STAT target genes: elucidating the mechanism of STAT-mediated oncogenesis. Cancer Biol Ther. 2004;3:1045–1050. doi:10.4161/cbt.3.11.1172.
- Redell MS, Ruiz MJ, Alonzo TA, Gerbing RB, Tweardy DJ. Stat3 signaling in acute myeloid leukemia: ligand-dependent and -independent activation and induction of apoptosis by a novel small-molecule Stat3 inhibitor. Blood. 2011;117:5701–5709. doi:10.1182/blood-2010-04-280123.
- Sepulveda P, Encabo A, Carbonell-Uberos F, Minana MDBCL-2. expression is mainly regulated by JAK/STAT3 pathway in human CD34+ hematopoietic cells. Cell Death Differ. 2007;14:378–380. doi:10.1038/sj.cdd.4402007.
- Nielsen M, Kaestel CG, Eriksen KW, Woetmann A, Stokkedal T, Kaltoft K, Geisler C, Röpke C, Ødum N. Inhibition of constitutively activated Stat3 correlates with altered Bcl-2/Bax expression and induction of apoptosis in mycosis fungoides tumor cells. Leukemia. 1999;13:735–738. doi:10.1038/sj.leu.2401415.
- Fantin VR, Loboda A, Paweletz CP, Hendrickson RC, Pierce JW, Roth JA, Li L, Gooden F, Korenchuk S, Hou XS, et al. Constitutive activation of signal transducers and activators of transcription predicts vorinostat resistance in cutaneous T-cell lymphoma. Cancer Res. 2008;68(10):3785–3794. doi:10.1158/0008-5472.CAN-07-6091.
- Eghtedar A, Verstovsek S, Estrov Z, Burger J, Cortes J, Bivins C, Faderl S, Ferrajoli A, Borthakur G, George S, et al. Phase 2 study of the JAK kinase inhibitor ruxolitinib in patients with refractory leukemias, including postmyeloproliferative neoplasm acute myeloid leukemia. Blood. 2012;119:4614–4618. doi:10.1182/blood-2011-12-400051.
- Chen WC, Yuan JS, Xing Y, Mitchell A, Mbong N, Popescu AC, McLeod J, Gerhard G, Kennedy JA, Bogdanoski G, et al. An Integrated Analysis of Heterogeneous Drug Responses in Acute Myeloid Leukemia That Enables the Discovery of Predictive Biomarkers. Cancer Res. 2016;76(5):1214–1224. doi:10.1158/0008-5472.CAN-15-2743.
- Magina KN, Pregartner G, Zebisch A, Wölfler A, Neumeister P, Greini HT, Berghold A, Sill H. Cytarabine dose in the consolidation treatment of AML: a systematic review and meta-analysis. Blood. 2017;130(7):946–948. doi:10.1182/blood-2017-04-777722.
- Brijwani N, Jain M, Dhandapani M, Zahed F, Mukhopadhyay P, Biswas M, Khatri D, Radhakrishna VD, Majumder B, Radhakrishnan P, et al. Rationally co-targeting divergent pathways in KRAS wild-type colorectal cancers by CANscript technology reveals tumor dependence on Notch and Erbb2. Sci Rep. 2017;7(1):1502. doi:10.1038/s41598-017-01566-x.
- Benedettini E, Sholl LM, Peyton M, Reilly J, Ware C, Davis L, Vena N, Bailey D, Yeap BY, Fiorentino M, et al. Met activation in non-small cell lung cancer is associated with de novo resistance to EGFR inhibitors and the development of brain metastasis. Am J Pathol. 2010;177:415–423. doi:10.2353/ajpath.2010.090863.
- Fedchenko N, Reifenrath J. Different approaches for interpretation and reporting of immunohistochemistry analysis results in the bone tissue - a review. Diagn Pathol. 2014;9:221. doi:10.1186/s13000-014-0221-9.