
ABSTRACT
The nucleophosmin 1 (NPM1) protein is frequently overexpressed in various cancers compared to normal tissues and represents a potential biomarker for maliganancy. However, its role in colorectal cancer (CRC) is still not fully understood. In this report, we show that NPM1 levels in CRC correlate with prognosis and sensitivity to chemotherapy. NPM1 expression was found to be significantly increased in CRC tumors (P < .001) and was associated with poor overall 5-year survival (P < .05). For individuals with Stage IV disease, this represented a reduction in survival by 11 months (P < .01; HR = 0.38, CI [0.21, 0.69]. In vitro, we show that NPM1 gene silencing enhanced the chemosensitivity of CRC cells and that pharmacological inhibition of NPM1 by NSC348884 triggered the onset of programmed cell death. Our immunofluorescence microscopy and immunoblot analyses also revealed that blocking NPM1 function sensitized CRC cells to chemotherapy-induced apoptosis through a mechanism that involves proteins in the AKT pathway. Consistent with the in vitro data, our patient-derived CRC xenograft model showed that inhibition of NPM1 suppressed tumor growth and attenuated AKT signaling in vivo. Moreover, LY294002, an inhibitor of the PI3K/AKT pathway, restored the chemosensitivity of CRC cells expressing high levels of NPM1. The findings that NPM1’s expression in CRC tissue correlates with prognosis and supports anti-apoptotic activity mediated by AKT signaling, further our understanding of the role of NPM1 in CRC.
Introduction
NPM1, also known as B23, belongs to the family of nucleoplasmin chaperone proteins. It is highly expressed in the nucleolus, and proper shuttling of NPM1 between the nucleus and cytoplasm is critical to its function in ribosome biogenesis, DNA transcription, cell cycle progression, centrosome duplication, DNA repair and response to apoptotic stimuli.Citation1, Citation2 Given the diversity of cellular processes regulated by NPM1, alterations in NPM1 activity is often implicated in tumorigenesis. Significantly higher expression of NPM1 in solid tumors, in comparison to paired normal tissues, has been consistently identified in clinical specimens from various cancers, including liver,Citation3 thyroid,Citation4 colorectal,Citation5 bladder,Citation6 and prostateCitation7 cancers.
In colorectal cancer (CRC), our group previously reported a correlation between high levels of NPM1 expression and progression toward CRC, suggesting that NPM1 plays a key role in the transformation of the normal colonic epithelium into adenomatous polyps (precursors to CRC) and subsequent cancer development.Citation8 This is further supported by a subsequent independent study that revealed an association between high NPM1 levels and lymph node metastasis, thereby solidifying the involvement of NPM1 in CRC progression.Citation9
The ability of NPM1 to promote tumor growth has been attributed to its inhibitory effect on the tumor suppressor p53. Our group had also demonstrated the interplay between NPM1 and p53.Citation8 In this study, we delve further into the mechanisms of NPM1 in CRC and show that high NPM1 expression not only supports the activation of p53, but that it also sustains AKT signaling in CRC cell lines, thereby supporting cellular survival despite exposure to chemotherapy. In addition, we also demonstrate that high NPM1 expression is associated with a reduction in overall survival in individuals with CRC.
Materials and methods
Patients cohort and data analysis
Publicly available array-based gene expression data from 326 CRC samples with corresponding clinical information were retrieved from curatedCRCData (http://bioconductor.org/packages/curatedCRCData). Additional transcriptome-sequencing-based gene expression data consisting of 73 CRC samples from the Personalized OncoGenomics (POG) Program at BC Cancer were also used to examine for an association between NPM1 expression with prognosis. Normalization of the mRNA expression level were conducted by dividing the number of gene transcript read by the total transcript number of the sample to account for the sequencing depth variability across samples.
The survival data were right-censored at 5 years to minimize non-tumor-related causes of death. April 02, 2019 was set as the date used to calculate overall survival in the curatedCRCData and POG.
Kaplan-Meier survival curve analysis was performed, with the selection of the cutoff scores based on the receiver operating characteristic (ROC) curve.Citation10 The highest score with maximum sensitivity and specificity on the curve was selected as the cutoff point. The data were dichotomized into high-level and low-level groups, followed by Kaplan-Meier survival analysis.Citation11 To use ROC curve analysis, the patients were dichotomized: dead and alive in the follow-up data as clinical outcome, high expression and low expression in the index. Log-rank test was used to compare the difference between two groups. ROC curves and Kaplan-Meier survival curves were analyzed by Survminer package version 0.4.2 under R version 3.4.1 environment.
Cell lines
The human colorectal cell lines HCT116 and RKO were maintained in Dulbecco’s Modified Eagle Medium (DMEM) (Invitrogen) supplemented with 10% newborn calf serum (Invitrogen, CA, U.S.A.), 1% penicillin-streptomycin and 1% kanamycin at 37°C in a humidified atmosphere with 5% CO2.).Citation12
Lentiviral particle preparation and infection
For virus packaging, pGIPZ lentiviral shRNA constructs (Sequence: 5ʹ-GCATTAAAGCAGCGTATC-3ʹ,Thermo Fisher Scientific, MA, U.S.A.) targeting the NPM1 gene were co-transfected with packaging plasmids (pGIPZ-sh-NPM1, pCMV-delta R8.74, pRSV-Rev, pCMV-VSV-G, ratio- 4:2:1:1) in serum-free DMEM with PEI (1 µg/µl) into 80% 293 T (packaging plasmids were kindly provided by Dr. Andrew Weng). Two different shRNAs targeting the NPM1 gene were used (designated as shNPM1_a and shNPM1_b; control designated as shCt). 48 hrs after transfection, the virus-containing supernatant was collected and directly added to the wells containing RKO cells, for virus transduction. Puromycin (0.2 µg/ml) was used for stable clone selection, beginning at 48 hr post transduction. NPM1 expression was verified by quantitative RT-PCR (qRT-PCR) and Western blotting (S. ).
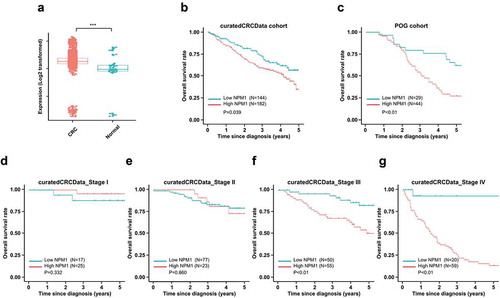
Figure 1. High NPM1 expression is associated with poor prognosis in CRC patients. (a) HSP47 mRNA expression level in 3,296 CRC patients compared with 76 control tissues (normal colon) from 22 microarray databases (curatedCRCData); two-sample unpaired Wilcoxon rank-sum test, ***, P < .001. Kaplan-Meier (KM) survival analysis of the CRC patient in (b) curatedCRCData and (c) POG cohorts. The patients were divided into high- and low- expression group based on the cutoff value derived from the ROC analysis, using the Log-rank test for statistical analysis
qRT-PCR
Total RNA was extracted with TRIzol (Invitrogen) according to manufacturer’s instruction. 1 µg of total RNA and RevertAid Reverse Transcriptase (Fermentas, MA, U.S.A.) were used to generate oligo(dT)-primed (Thermo Fisher Scientific) first-strand cDNA following manufacturer’s instruction. The abundance of NPM1 mRNA in stable knockdown clones, relative to RKO cells transduced with the scrambled control shRNA (RKO_shCt), was determined by qRT-PCR using EvaGreen qPCR Mastermix-ROX (Applied Biological Materials, BC, Canada) in ABI Prism 7900HT Sequence Detection System (Applied Biosystems, CA, U.S.A.). Cycling conditions were as follows: 95°C for 10 min followed by 40 cycles of 95°C for 15 s and 60°C for 1 min. Melting curve analysis was performed at the end of cycles to monitor unspecific amplification. Raw Ct values were calculated using the SDS software v.2.4 using automatic baseline settings. The primers used for the amplification were: 5ʹ-CTCTCCTACCTAAGTGCGTGC-3ʹ and 5ʹ-CAGCCCCTAAACTGACCGTTC-3ʹ for NPM1 and 5ʹ-TGAAATCGCCAATGCCAACTC-3ʹ and 5ʹ-GGCTGTACCCTTCCGCTTACC-3ʹ for RPL19. NPM1 expression levels were calculated by the comparative CT method (2−∆∆CT) using RPL19 as normalization control.
Cell viability assays
HCT116 and RKO cells were seeded at 3000 cells per well in 96-well plates for 24 hrs followed by treatment with the indicated concentrations of the NPM1 inhibitor NSC348884Citation13 (di-[((6-methyl-1 H-benzo[d]imidazol-2-yl)methyl)((5-methyl-3-oxo-3 H-indol-2-yl)methyl)]) aminoethane) (Santa Cruz Biotechnology, CA, U.S.A.) with or without 5-FU for 72 hrs. PI3K inhibitor LY294002 (Sigma-Aldrich) was used to examine AKT signaling. Cell viability was determined by MTS (3-(4,5-dimethylthiazol-2-yl)-5-(3-carboxymethoxyphenyl)-2-(4-sulfophenyl)-2 H-tetrazolium, inner salt) viability assay (Promega, WI, USA.) using VersaMaxmicroplate reader (version 4.8, Molecular Devices, CA, USA.) according to manufacturer’s instruction. Viability was calculated relative to the non-treated control.
The Synergistic effect between NSC348884 and 5-FU was assessed by using the following formula, reported by Kern et al:Citation14 R index (RI) = [(cell survival observed with drug A alone) x (cell survival observed with drug B alone)]/(cell survival observed with the combination of drug A and drug B), where an RI ≤ 1.0 represented the absence of synergism or antagonism.Citation14–16 Additionally, the Chou–Talalay method to assess the synergistic effects of NSC348884 and 5-FU was also used, with the combination index (CI) < 1 representing synergism, a CI>1 representing antagonism and CI = 1 representing an additive effectCitation17
Caspase-3/7 assay
20 μg of cell lysate was incubated with a proluminescent caspase-3/7 DEVD-aminoluciferin substrate (Promega) in a 1:1 volume ratio in a white-walled 96-well plate. Cleavage of the substrate, which is coupled to luciferase activity, produces a luminescent signal that is proportional to caspase-3/7 activity.
Immunofluorescence microscopy
RKO_shCt and RKO_shNPM1 cells were seeded onto tissue-culture-treated coverslips (Thermo Fishers Scientific) overnight followed by the treatment with 10 μM 5-FU and 15 μM CPT-11 for 48 hr. After drug treatment, the coverslips were fixed with 4% paraformaldehyde for 15 min at room temperature (RT) followed by permeabilization with 0.2% Triton X-100 in PBS for 10 min. Blocking using 1% BSA/PBS was performed for 1 hr at RT to minimize nonspecific binding. Cells were incubated with primary antibody M30 (1:60 dilution in PBS, Roche Molecular Systems, CA, USA) in a humidified chamber at 4°C overnight followed by the incubation with AlexaFluor® 555-conjugated secondary antibody (1:300 dilution in PBS, Invitrogen) for 1 h at RT. Nuclear counterstain was performed with Hoechst 33258 staining (0.2 μg/mL, Sigma-Aldrich, MO, U.S.A.) at RT for 10 min. Washing with PBS buffer was performed after each step. The coverslips were then mounted onto glass slides with SlowFade® Gold Antifade (Invitrogen) and viewed under a DM6000 B microscope (Leica Microsystems, Wetzlar, Germany). All images were captured using a 20X objective and subsequently processed with ImageJ software (National Institute of Health, USA.).
For fluorescent immunohistochemical analysis of the Optimal Cutting Temperature (OCT) compound-preserved PDX samples, 10 μm cryosections of the tumors were prepared using a Leica CM1850 Cryostat (Leica). The same immunostaining procedure that was used for the analysis of cultured cells was followed. The tissues were stained with M30 and P-AKT(Ser473) (1:60 in PBS, Cat. 9271, Cell Signaling Technology, MA, U.S.A.) primary antibodies, followed by AlexaFluor® 647- and 555-conjugated secondary antibodies, respectively. The images were taken using the 60X oil immersion objective of a Nikon A1Si confocal microscope (Nikon, Tokyo, Japan).
Immunoblotting
Cell pellets were lysed in RIPA buffer (25 mM Tris-HCl, pH7.4, 150 mM NaCl, 1% NP-40, 1% sodium deoxycholate and 0.1% SDS) supplemented with 8 mM NaF and 20 mM Na3VO4 and protease inhibitor cocktail (Sigma-Aldrich). For native PAGE analysis, cell lysates were specifically prepared in SDS-free buffer (50 mM Tris-HCl, pH7.4, 150 mM NaCl and 0.5% NP-40) to preserve the native states of proteins. 40 μg of total protein for each sample was loaded onto 10 ~ 12% SDS-PAGE for electrophoretic separation and then wet-transferred (Transfer buffer: 15 mM Tris-base, 192 mM glycine, 20% methanol) onto polyvinylidene difluoride membranes (MilliporeSigma, MA, USA.). The western blot membranes were probed with primary antibodies against NPM1 (cat. 3542S), P-p53 (Ser15) (cat. 9286S), CASP9 (cat. 9502S), P-AKT (Ser473) (cat. 9271S), AKT (cat. 4685S), PTEN (cat. 9552), P-MDM2 (Ser166) (cat. 3521S) and P-BAD (Ser136) (cat. 9295S) (all from Cell Signaling Technology; 1:1000 dilution) at 4°C overnight followed by incubation with horseradish peroxidase (HRP)-conjugated anti-rabbit secondary antibody (Cell Signaling Technology) at RT for 1 hr. Blots were developed with enhanced chemiluminescence (ECL) reagents and exposed to Bioflex MSI film (Mandel Scientific, BC, Canada) using an automatic film developer. Immunoblots were probed with antibodies against β-actin (1:2500; Applied Biological Materials) as protein-loading control. Densitometry analysis was performed using Image J software (National Institutes of Health, USA.).
In vivo animal studies
To assess the potential inhibitive effect of NPM1 knockdown on CRC tumor growth, fresh human CRC tissues originating from primary tumors were grafted subcutaneously into the flanks of C.B-17/SCID (severe combined immunodeficient) mice (Taconic, NY, U.S.A.). Once successful uptake of patient-derived xenografts was confirmed, the tumors were harvested, excised into smaller pieces (~ 2x2x2 mm) and re-implanted into C.B-17/SCID mice. When the tumor volume reached a size of 50–100 mm3, the mice were randomly assigned to receive intratumoral injections of lentivirus containing NPM1-shRNA or scrambled shRNA at 1 × 10Citation7 IU/mm3 of tumor, 6–7 mice/group. Tumor dimensions were measured using a digital caliper, and volumes were calculated using the formula ½ (Length × WidthCitation2). Body weights of the animals were monitored concurrently during the treatment period (S. ). At the completion of the study, tumors were harvested for downstream studies (qRT-PCR, immunoblotting, or immunofluorescence studies).
Figure 2. NSC348884 promotes NPM1 oligomer disassembly and induces apoptosis. (a) NSC348884 disrupts NPM1 oligomer formation. Whole cell lysates of HCT116 and RKO cells treated with increasing concentrations of the NPM1 inhibitor for 24 h were analyzed by native PAGE, which allows the detection of native NPM1 oligomers (results based on 3 independent experiments). (b) HCT116 and RKO cells are sensitive to the effects of NSC348884. Changes in cell viability were determined by the MTS assay by comparing the percentage of viable cells remaining after 24 h incubation in the NPM1 inhibitor, relative to the number of live untreated cells. IC50 values were interpolated from the dose response curves using non-linear regression. (c) Synergistic effects of NSC348884 and 5-FU on HCT116 and RKO cells were determined by the MTS assay. Cells were treated with 2.2 μM NPM1 inhibitor for 24 h, followed by treatment with 5 μM 5-FU for an additional 48 h. The combination of NSC348884 and 5-FU resulted in a RI index of 1.1 for HCT116 and 1.2 for RKO, where values greater than 1.0 indicate synergism. Each data point was plotted as the mean ± SD (n ≥ 3 independent experiments). Statistical significance of the results was assessed by ANOVA, followed by a multiple comparison test, *, P ≤ 0.05; **, P ≤ 0.01 (d) NSC348884 (2.2 μM, for 24 hrs) induces apoptosis in CRC cell lines. The level of apoptosis was assessed by caspase-3/7 assay. Student’s t test. *, P ≤ 0.05 (n = 3 independent experiments). (e) Inhibition of NPM1 by NSC348884 induces p53 activation, caspase-9 cleavage and attenuates AKT signaling, as indicated by the immunoblotting analysis (n = 3 independent experiments)
Results
Expression of NPM1 in CRC correlates with survival outcomes
To understand the role of NPM1 in colorectal cancer (CRC), we first examined NPM1 expression in CRC by analyzing data compiled from 22 independent microarray databases (curatedCRCData, version 2.12.0) and found that its expression was markedly elevated in CRC (P < .001) ().Citation18
We further examined whether the level of NPM1 expression in CRC correlated with specific clinical parameters, using two independent cohorts: publicly available curatedCRCData and the Personalized Oncogenomics (POG) dataset. Individuals with CRC in the two cohorts were grouped independently into low or high NPM1 expression subgroups according to the optimal cutoff value based on the ROC analysis. We did not observe an association between NPM1 expression with age, gender, race, tumor stage or tumor site in the curatedCRCData cohort () or the POG cohort (). However, NPM1 expression was associated with differences in overall survival in both cohorts.
Table 1. Association between NPM1 expression and clinic pathological factors in the curatedCRCData cohort
Table 2. Association between NPM1 expression and clinic pathological factors in the POG cohort
Individuals with CRC that express low levels of NPM1 had significantly better 5-year overall survival than those individuals with high NPM1-expressing CRCs (P = .039; HR = 0.65, CI [0.44, 0.96]; ). For all disease stages (Stages I–IV), individuals with low NPM1-expressing-CRCs had a mean survival advantage of 0.83 months (25 days). A similar pattern of improved overall survival was observed with the POG cohort (Stage IV disease), it was interesting to note that individuals with low-NPM1 expressing tumors survived 11 months longer than those with high-NPM1 expressing tumors individuals with (P < .01; HR = 0.38, CI [0.21, 0.69]; ). The main difference between the curatedCRCData and the POG cohorts is that the POG cohort is enriched for Stage IV CRC, as only those individuals with metastatic disease were enrolled in this study. Indeed, when we further examine the overall survival of patients in curatedCRCData cohort according to the disease stage, we found that NPM1 expression was not associated with the prognosis of CRC patients with localized disease (Stage I and II) (P > .05; and E). However, in individuals with regional lymph node metastasis (Stage III) (P < .01; ) and distant metastasis (Stage IV) (P < .01; ), high NPM1 expression again significantly correlated with poor prognosis. These findings suggest that NPM1 expression may provide prognostic information for individual with CRC, especially for the sub-group with Stage III and IV disease.
Inhibition of NPM1 by NSC348884 induces p53-dependent apoptosis in colorectal cancer cells
In order to examine how NPM1 may influence the overall survival in individuals with CRC, we assessed the effect of manipulating NPM1 levels on apoptosis in vitro. HCT116 and RKO cells were used as our model cell lines as both harbor wild-type p53. As a first step toward understanding NPM1 function in CRC, the cells were treated with the inhibitor NSC348884, which disrupts the assembly of functional NPM1 oligomers that contain the necessary surface features for interaction with NPM1 binding proteins.Citation19–21 To confirm its inhibitory effect on NPM1, HCT116 and RKO cells were titrated with increasing concentrations of the compound and the dissociation of higher-order NPM1 species was monitored by native polyacrylamide gel electrophoresis (PAGE). In HCT116 cells, a dramatic decrease in the level of NPM1 oligomers occurred at > 2 μM of NSC34884, while > 4 µM was required to disrupt oligomer assembly in RKO cells (), with marginal reductions in the NPM1 monomer (data not shown). Since NPM1 is involved in the regulation of cell growth and apoptosis, the effect of NSC348884 on cell viability was examined using the MTS assay. Indeed, treatment with the NPM1 inhibitor resulted in decreased viability of both HCT116 and RKO cell lines (). The IC50 of NSC348884 for HCT116 cells was calculated to be 2.7 ± 0.1 μM and 3.5 ± 0.3 μM for RKO cells, which are in line with the native PAGE analysis that a high concentration of the inhibitor was required to induce the disassembly of NPM1 oligomers in RKO cells. We noted that the effect of NSC348884 on cell death was dramatic in concentrations above 2.5 μM (as noted in ). We therefore chose to use NSC348884 at 2.2 μM, which has minimal effect on cell death, in order to better examine a potential synergistic effect when used in combination with 5-FU. In fact, NSC348884 potentiates the effect of 5-FU, with the combination treatment resulting in a greater reduction in cell viability in both HCT116 and RKO, compared to what was achieved with the individual agents (). Specifically, the addition of NSC348884 to 5-FU further decreased the viability of HCT116 from 87.7 ± 6.8% to 74.8 ± 1.5% and that of RKO from 75.1 ± 5.4% to 63.4 ± 7.6%. The combination of NSC348884 and 5-FU yielded a RI index of 1.2 and 1.1 for RKO and HCT116, respectively, where a RI index value greater than 1.0 indicates synergism.Citation14 In addition, we confirmed this synergistic effect using the Chou-Talalay, methods to assess synergy: in RKO, a CI of 0.136 was obtained for the combination of NSC348884 and 5-FU, while a CI of 0.141 was obtained in HCT116 cells. The loss in cell viability in response to NSC348884 is caused, in part, by the induction of apoptotic cell death. After exposing HCT116 and RKO cells to the NPM1 inhibitor, a more than twofold increase in caspase-3/7 activity was observed, signifying the activation of effector caspases that are essential for the execution of apoptosis ().Citation22 To understand the mechanism by which the NPM1 inhibitor NSC348884 induces programmed cell death, the involvement of the tumor suppressor p53 was first examined. Since NPM1 knockdown by siRNA (small interfering RNA) has been shown to enhance p53-mediated senescence,Citation8 it is possible that pharmacological inhibition by NSC348884 may likewise activate p53 to trigger apoptosis. Indeed, inhibition of NPM1 with NSC348884 induced the phosphorylation of p53 at Ser15 and its activation. P-p53(Ser15), which corresponds to an activated form of p53, was detected in HCT116 cells as early as 4 hours after treatment with the NSC348884 inhibitor, as shown by the immunoblot analysis ().Citation23 This led to the transient stabilization of p53 for the induction of apoptosis. In addition, caspase-9, which has been shown to be a downstream mediator of p53-dependent cell death, was found to undergo proteolytic cleavage following the activation of p53.Citation24 Cleavage of caspase-9 in response to the NPM1 inhibitor treatment activated this key initiator caspase and signaled the onset of the intrinsic apoptosis pathway. Interestingly, NSC348884 also reduced the level of active P-AKT(Ser473) in a time-dependent manner (). Together, our results show that the inhibition of NPM1 by NSC348884 effectively attenuates the oncogenic properties of NPM1 and sensitizes CRC cells to apoptosis through the upregulation of p53 activity and inactivation of AKT.
Knockdown of NPM1 expression enhances chemosensitivity of colorectal cancer cells via suppression of AKT signaling
To further define the role of NPM1 in modulating the chemosensitivity of CRC cells, RKO cells, which contain a high endogenous level of NPM1, were infected with a lentivirus encoding NPM1-specific shRNA (small hairpin RNA) to create a stable knockdown cell line. Our qRT-PCR (quantitative real-time PCR) analysis confirmed that the lentiviral construct effectively reduced NPM1 expression in the knockdown cell line (RKO_shNPM1) by 92% relative to the control (RKO_shCt), which was transduced with the scrambled shRNA (Figure S1). Next, the effect of NPM1 knockdown on sensitivity toward 5-fluorouracil (5-FU) and irinotecan (CPT-11), two chemotherapeutic agents that are considered the standard treatment for CRC, was examined. Cell viability assay result showed that the loss of NPM1 expression rendered RKO_shNPM1 cells more sensitive to 5-FU as the IC50 for 5-FU decreased nearly two-fold (RKO_shCt IC50: 14.5 ± 2.9 μM vs. RKO_shNPM1_a IC50: 6.8 ± 1.6 μM, RKO_shNPM1_b IC50: 5.4 ± 1.1 μM) (). For the CPT-11 treated group, NPM1 knockdown also led to an increase in sensitivity to CPT-11, with an IC50 of 12.7 ± 2.5 μM for RKO_shCt and 7.2 ± 1.9 μM for RKO_shNPM1_a and 4.4 ± 3.1 μM for RKO_shNPM1_b ().
Figure 3. NPM1 silencing enhances chemosensitivity to 5-FU and CPT-11. NPM1 knockdown cells (RKO_shNPM1) showed higher sensitivity toward (a) 5-FU and (b) CPT-11, whereas control cells with a high endogenous level of NPM1 (RKO_shCt) were more resistant. Changes in cell viability, after 72 h of drug treatment, were analyzed by the MTS assay and normalized to the untreated controls. IC50 values were calculated from the dose response curve using non-linear regression. (c) NPM1 knockdown cells exhibited increased apoptosis in response to 5-FU and CPT-11. RKO_shCt and RKO_shNPM1 cells were treated with 10 μM 5-FU and 15 μm CPT-11, respectively, for 48 h. The percentages of apoptotic cells were determined based on M30 labeling, followed by immunofluorescence image analysis. Representative images of M30-positive staining (in red), with arrows indicating the presence of fragmented nuclei. Student’s t test. *, P ≤ 0.05; **, P ≤ 0.01 (n = 3 independent experiments)
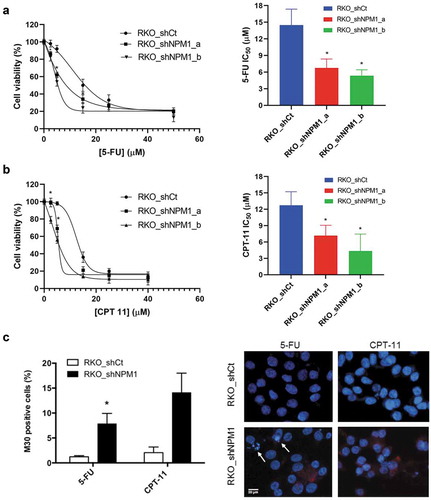
The increased chemosensitivity of NPM1 knockdown cells toward 5-FU and CPT-11 translated into enhanced levels of apoptosis as revealed by our M30 immunostaining analysis. The M30 antibody is specific toward an epitope of cytokeratin 18 that is unmasked after caspase cleavage and therefore, is suitable for the detection of apoptosis. Upon exposure to 10 μM 5-FU, 7.9 ± 1.2% of RKO_shNPM1 demonstrated positive staining for cleaved cytokeratin 18, while only 1.2 ± 0.2% of RKO_shCtwas M30 positive (). In addition, fragmentation of the nuclei, which is a morphological feature typical of apoptotic cells, was also more prominent in RKO_shNPM1 treated with 5-FU. CPT-11 also elicited a greater apoptotic response in RKO_shNPM1, with 14 ± 2.7% of the knockdown cells and 2.1 ± 0.7% of RKO_shCt exhibiting the M30 marker ().
Involvement of p53 in NPM-1 modulated Akt activity
The mechanism by which NPM1 expression confers resistance to chemotherapy in CRC cells is likely linked to the activation of the serine/threonine kinase AKT. RKO_shCt and RKO_shNPM1 cells were subjected to 5-FU () and CPT-11 () treatment, and assessed for the expression of proteins in the AKT pathway. The phosphorylation status of AKT, particularly at Ser473, which is required for full activation of AKT, was examined.Citation25 The level of P-AKT(Ser473) diminished more rapidly in NPM1 knockdown cells in response to treatment (with total AKT level remaining relatively constant). For instance, we observed a marked decrease in P-AKT(Ser473) in RKO_shNPM1 as early as 4 hours after incubation with 5-FU, while its level remained relatively steady in RKO_shCt over the 24 hour treatment period. Next, the effect of chemotherapy on the AKT substrate, MDM2, and p53 in CRC cells was examined. In RKO_shNPM1, where the level of activated AKT diminished significantly with drug treatment, a corresponding decrease in P-MDM2(Ser166) in response to 5-FU was observed (, S. ). This was associated with a more rapid accumulation of P-p53(Ser15) and total p53 that were available for the induction of apoptosis (). Likewise, phosphorylation of p53 at Ser15 and its subsequent activation also occurred more readily in CPT-11 treated RKO_shNPM1, compared with RKO_shCt (). Consistent with our data that NPM1 silencing sensitizes CRC cells to apoptosis, the extent to which the pro-apoptotic BAD is inhibited through AKT-mediated phosphorylation is also downregulated in NPM1 knockdown cells (). Phosphorylation of BAD by AKT leads to its sequestration by the 14-3-3 protein, such that it can no longer heterodimerize with BCL-xL or BCL-2 and antagonize their anti-apoptotic activities. Notably, the level of P-BAD(Ser136) is significantly more abundant in control cells expressing high levels of NPM1, and this likely contributes to their greater resistance to chemotherapy. In addition, we noted a greater reduction in P-BAD (Ser136) in RKO_shNPM1 cells treated with CPT-11 (15μM), than in cells treated with 5-FU (10μM). The difference in the extent of reduction of P-BAD (Ser136) is likely as a result of the higher concentration of CPT-11 used (which was closer to its IC50 of 12.7 ± 2.5), in comparison to 5-FU (IC50 14.5 ± 2.9). Collectively, our data suggest that knockdown of NPM1 sensitizes CRC cells to 5-FU and CPT-11 by regulating proteins in the apoptotic pathway via activation of p53 and suppression of AKT activity.
Figure 4. Downregulation of AKT survival signaling in NPM1 knockdown cells. Whole cell lysates from RKO_shCt and RKO_shNPM1 cells treated with (a) 10 μM 5-FU and (b) 15 μM CPT-11 were analyzed for the expression of proteins in the PI3K/AKT pathway by Western blotting (n = 3 independent experiments)
The PI3K inhibitor LY294002 restores chemosensitivity of colorectal cancer cells expressing high levels of NPM1
To further examine the role of PI3K/AKT signaling in mediating the chemoresistance of CRC cells expressing high levels of NPM1, we compared the viability of RKO_shCt and RKO_shNPM1 following treatment with 5-FU and/or LY294002, an inhibitor of the PI3K/AKT pathway. Consistent with our result from the 5-FU dose-response assay (), 5-FU induced a greater reduction in the viability of RKO_shNPM1 than in RKO_shCt (78.2 ± 1.7% in RKO_shNPM1 vs. 92.6 ± 3.5% in RKO_shCt) (). The lower sensitivity of RKO_shCt to 5-FU is also evident in the lack of cleaved PARP (poly(ADP-ribose)polymerase) at a lower concentration (2.5 μM) of 5-FU, which, in contrast, led to the visible accumulation of this apoptosis marker in the more sensitive RKO_shNPM1 (). The LY294002 treatment alone reduced the viability of both cell lines to a similar extent, irrespective of the level of NPM1 expression (77.6 ± 5.3% in RKO_shCt vs. 76.2 ± 2.7% in RKO_shNPM1). However, the addition of LY294002 significantly enhanced the sensitivity of CRC cells to 5-FU, more so in those with a higher level of NPM1. Specifically, the viability of RKO_shCt decreased from 92.6 ± 3.5% to 59.1 ± 1.3% after supplementing the 5-FU treatment with LY294002 and from 78.2 ± 1.7% to 52.6 ± 1.8% for RKO_shNPM1. That is, the addition of LY294002 further reduced cell viability by an additional 33% and 26% in RKO_shCt and RKO_shNPM1, respectively, compared to the effects of 5-FU alone (). The additional reduction in cell viability translated into a greater level of apoptosis, as demonstrated by the higher level of cleaved PARP in RKO_shCt that were subjected to the combination of LY294002 and 5-FU, compared to those treated with the individual agents (). A corresponding decrease in P-BAD(Ser136), an inactivated form of the pro-apoptotic protein, following the inhibition of AKT by LY294002, was observed along with the increase in cleaved PARP (). Together, these results suggest that LY294002, through the inhibition of PI3K/AKT signaling, could restore the sensitivity of high-expressing NPM1 CRC cells to 5-FU.
Figure 5. LY294002 restores chemosensitivity of cells expressing high levels of NPM1 to 5-FU. (a) Inhibition of PI3K/AKT signaling by LY294002 restored the 5-FU sensitivity of RKO cells with a high endogenous level of NPM1. RKO_shCt and RKO_shNPM1 cells were exposed to 5 μM LY294002 or vehicle for 24 h, before treatment with or without 2.5 μM 5-FU for another 48 h. Changes in cell viability, which were normalized to the untreated control, were assessed by the MTS assay. Each data point was plotted as the mean ± SD (n = 3). Statistical significance of the results was assessed by ANOVA, followed by a multiple comparison test (***, P ≤ 0.001). (b) The resulting whole cell lysates were analyzed for the expression of proteins in the PI3K/AKT and apoptosis pathways by Western blotting (n = 3 independent experiments). A decrease in P-BAD(Ser136), following the inhibition of AKT by LY294002, was observed along with the increase in cleaved PARP. 5 μM LY294002 treatment is denoted by (+) and vehicle by (-). Increasing concentrations of 5-FU at 2.5 and 5 μM are denoted by (+) and (++)
Knockdown of NPM1 inhibited tumor growth of CRC patient-derived xenografts
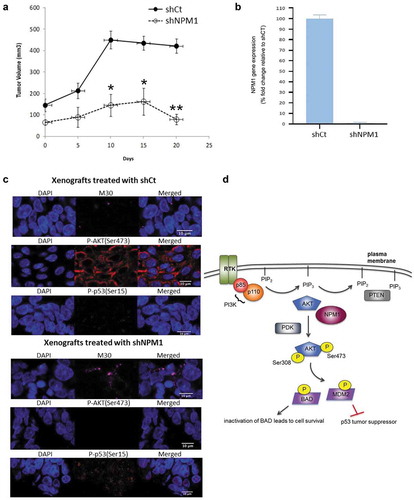
We next evaluated the effect of NPM1 expression on CRC growth in vivo using patient-derived xenografts (PDX) since they more closely reflect the molecular diversity of the disease. The xenografts were propagated through in vivo passaging, and once tumors reached a size of 50–100 mm3, the mice were subjected to intra-tumoral injections of lentiviral shRNA targeting the NPM1 gene (shNPM1) and scrambled control shRNA (shCt). We observed significant tumor growth (> 400 mm3) in the control group while reduced tumor volumes were noted for the PDX samples treated with shNPM1 (), with confirmation of NPM1 knockdown in the shNPM1-treated group (). To determine whether the activation of p53 limited the growth of shNPM1-treated PDX, we analyzed cryosections of the tumors by fluorescent immunohistochemistry (IHC). The induction of p53 activity was more apparent in the NPM1 knockdown group, compared to the control (). The immunostaining revealed that P-p53(Ser15) localized in both the cytoplasm and nucleus, where the signals appeared stronger, and this is consistent with its established role in triggering apoptosis in these two cellular compartments through transcription-dependent and -independent activities.Citation26 The increased expression of P-p53(Ser15) in the shNPM1-treated tumors is also in line with their higher level of M30-positive staining, a marker for apoptosis (). Moreover, we detected negligible P-AKT(Ser473) signals in the tumors treated with shNPM1 (). In contrast, the xenografts injected with shCt exhibited strong cytoplasmic staining for P-AKT(Ser473), which, in its activated form, phosphorylates its downstream effectors to inhibit apoptosis and promote cell survival. In agreement with our in vitro study with the NPM1 inhibitor NSC348884 (), our IHC data suggest that knockdown of NPM1 induces apoptosis in vivo by inhibiting AKT and upregulating p53 activity ().
Figure 6. Inhibition of NPM1 promotes tumor regression in vivo. (a) C.B-17/SCID mice implanted with patient-derived xenografts (PDX) of CRC tumors were subjected to intratumoral injections of lentiviral particles expressing scrambled shRNA (shCt) and NPM1 shRNA (shNPM1). Tumor volumes were expressed as the mean ± SD, 6–7 mice per group. (b) mRNA were isolated from tumors harvested at the completion of the study and gene expression of NPM1 was determined. (c) Immunofluorescence images of OCT-embedded PDX cryosections stained with M30, P-AKT(Ser473) and P-p53(Ser15) antibodies are shown. (d) Schematic diagram showing that NPM1 may promote AKT activation and the subsequent phosphorylation of downstream targets, BAD and MDM2. Phosphorylation inhibits the pro-apoptotic activity of BAD, while such post-translational modification enhances the ability of MDM2 to target the p53 tumor suppressor for proteasomal degradation, thereby promoting cell survival. Student’s t test. *, P ≤ 0.05, **, P ≤ 0.01
Discussion
In our attempt to elucidate the role of NPM1 in CRC, we began by examining the expression of this protein in primary CRC tissues and its potential association with overall survival. We observed that NPM1 expression was increased in CRC tissues and higher expression conferred a significant reduction in survival (~11 months), particularly in Stage IV disease.
We also demonstrated that NPM1 inhibition, either by the pharmacological agent, NSC348884, or shRNA-mediated gene knockdown, consistently led to decreased cell proliferation and apoptosis. We infer that high NPM1 expression contributes to CRC progression through its anti-apoptotic effects based on the finding that CRC cells with a high endogenous level of NPM1 were more resistant to apoptosis induced by 5-FU and CPT-11 than their NPM1 knockdown counterparts. This is further supported by data from our patient-derived tumor xenograft model, which showed that NPM1 knockdown inhibited tumor growth, while high expression of NPM1 led to progressively larger tumor volumes in vivo over time.
To investigate the molecular mechanism of how NPM1 confers chemoresistance and promotes aberrant cell growth in CRC cells, we examined the effects of NPM1 inhibition and gene silencing in HCT116 and RKO, two CRC cell lines with wild-type TP53. Our results indicate that PI3K/AKT signaling may represent yet another pathway through which NPM exerts its anti-apoptotic activity. PI3K/AKT signaling plays a vital role in the control of cell growth, survival and metabolism, and hyper-activation of this signal transduction pathway is frequently detected in human cancers, including CRC.Citation27 We found that high NPM1 expression was associated with sustained AKT signaling, both in vitro and in vivo. We noted minimal decrease in P-AKT(Ser473) levels in RKO_shCt cells in response to 5-FU and CPT-11 (), as well as intense cytoplasmic P-AKT(Ser473) staining in the shCt-treated tumor xenografts (). In contrast, knockdown of NPM1 in RKO cells led to diminishing levels of activated P-AKT(Ser473) in response to chemotherapy. As it is well established that AKT promotes cell survival by regulating apoptosis-related proteins,Citation28 we also observed increased inhibition of pro-apoptotic BAD (as evidenced by higher P-BAD (Ser136) levels) and delayed activation of p53 (partly due to inhibition by the AKT substrate, MDM2) in RKO_shCt following prolonged activation of AKT (). To verify that the changes in AKT status following chemotherapeutic treatment was due to NPM1-specific effects, we probed for the level of PTEN (phosphatase and tensin homologue deleted on chromosome ten), a major antagonist of the PI3K/AKT pathway that functions to dephosphorylate PIP3, a key signaling intermediate of PI3K, to PIP2.Citation29 Interestingly, PTEN levels remained relatively constant with 5-FU and CPT-11 treatments, irrespective of NPM1 expression. This precludes the possibility that the diminishing AKT activity observed in NPM1 knockdown cells was due to enhanced levels of PTEN. Thus, by promoting the activation of AKT, high expression of NPM1 in CRC cells confers chemoresistance and protects these cells from apoptotic stimuli.
It is known that the upstream lipid kinase, PI3K, can directly stimulate AKT activity.Citation30 Class Ia PI3K consists of a regulatory (p85) and catalytic subunit (p100) and mutations in this PI3K isoform are frequently implicated in cancer.Citation31 Indeed, the CRC cell lines used in our study, HCT116 and RKO, both harbor the hot spot mutation H1047R in the kinase domain of the p100α variant.Citation32 Such mutation can lead to higher lipid kinase activity and constitutive PI3K/AKT signaling. However, despite the stimulatory input from the constitutively active, mutant PI3K, we observed a significant, time-dependent decrease in P-AKT (Ser473) level in RKO_shNPM1 treated with 5-FU and CPT-11 while the level was minimally affected by drug treatment in RKO_shCt (). This suggests that high NPM1 expression in CRC cells plays a role in sustaining PI3K/AKT signaling. A key step in AKT activation is its recruitment to the plasma membrane, where PDK1 and mTORC2 phosphorylate AKT on Thr308 and Ser473, respectively, to fully activate the kinase.Citation33,Citation34 Given that NPM1 possesses specific binding affinity for PIP3, a membrane phospholipid, and that its interaction with AKT has been implicated in the survival of PC-12 and human lung adenocarcinoma cell line A549 cells, we speculate that NPM1 can associate with PIP3 and AKT in a complex.Citation35–37 In other words, NPM1 can potentially serve as a platform for localizing AKT to the cell membrane and thereby promote its activation and pro-survival activity.
Although the data we generated support the role of AKT and its downstream targets as part of the NPM1-mediated anti-death mechanism, the involvement of additional non-AKT-related pathways were not examined. For example, a recent report demonstrated that NPM1-overexpressing hepatocellular carcinoma (HCC) cells antagonize apoptosis via a mechanism independent of p53. It was observed that depletion of NPM1 sensitized HCC cells, particularly those with inactivated p53, to UV- and chemotherapy-induced cell death.Citation38 Simultaneous silencing of NPM1 and p53 failed to enhance the chemo-sensitizing effect derived from knockdown of NPM1 alone. Subsequent experiments revealed that, following exposure to stress stimuli, NPM1 binds specifically to the pro-apoptotic protein BAX in the activated conformation that is required for the formation of MOMP-mediating BAX oligomers in the outer mitochondrial membrane. As a result, this precludes the translocation of BAX to the mitochondria and prevents it from triggering apoptosis. That BAX plays a key role in NPM1-mediated death evasion in tumor cells harboring inactivated p53 is further supported by the observation that knockdown of BAX abolished the chemo-sensitizing effect of NPM1 silencing in HCC cells.
Small molecule inhibitors such as NCS348884,Citation13 Rev37-47,Citation39 RNA aptamer,Citation40 CIGB-300Citation41 and NucAnt 6 LCitation42 have all been described to target NPM1, with promising results as anti-cancer agents. In fact, clinical trials involving CIGB-300 and NucAnt 6 L have been reported.Citation41,Citation43
In summary, the data presented here provide additional insight into the molecular mechanism by which high NPM1 expression contributes to the development of CRC. In particular, the upregulation of AKT survival signaling observed in CRC cells that have a high endogenous level of NPM1 plays a key role in conferring chemoresistance to 5-FU and CPT-11 and the ability to evade apoptosis. Inhibition of the PI3K/AKT pathway with LY294002 restored the sensitivity of these cells to chemotherapy. Together with our finding that inhibition of NPM1 suppresses the growth of patient-derived CRC xenografts, these results suggest that targeting NPM1, in combination with PI3K/AKT inhibitors, may represent a potential therapeutic strategy for CRC.
Supplemental Material
Download Zip (276.5 KB)Acknowledgments
We thank Dr. Marco Marra and Dr. Janessa Laskin for sharing the colorectal cancer gene expression and clinical data from the Personalized Oncogenomics Program at the BC Cancer.
Disclosure statement
The authors declare there is no conflict of interests.
Supplementary material
Supplemental data for this article can be accessed on the publisher’s website.
Additional information
Funding
References
- Borer RA, Lehner CF, Eppenberger HM, Nigg EA. Major nucleolar proteins shuttle between nucleus and cytoplasm. Cell. 1989;56:379–390. doi:10.1016/0092-8674(89)90241-9.
- Grisendi S, Mecucci C, Falini B, Pandolfi PP. Nucleophosmin and cancer. Nat Rev Cancer. 2006;6:493–505. doi:10.1038/nrc1885.
- Yun JP, Miao J, Chen GG, Tian QH, Zhang CQ, Xiang J, Fu J, Lai PBS. Increased expression of nucleophosmin/B23 in hepatocellular carcinoma and correlation with clinicopathological parameters. Br J Cancer. 2007;96:477–484. doi:10.1038/sj.bjc.6603574.
- Pianta A, Puppin C, Franzoni A, Fabbro D, Di Loreto C, Bulotta S, Deganuto M, Paron I, Tell G, Puxeddu E, et al. Nucleophosmin is overexpressed in thyroid tumors. Biochem Biophys Res Commun. 2010;397:499–504. doi:10.1016/j.bbrc.2010.05.142.
- Nozawa Y, Van Belzen N, Van der Made AC, Dinjens WN, Bosman FT. Expression of nucleophosmin/B23 in normal and neoplastic colorectal mucosa. J Pathol. 1996;178:48–52.
- Tsui KH, Juang HH, Lee TH, Chang PL, Chen CL, Yung BY. Association of nucleophosmin/B23 with bladder cancer recurrence based on immunohistochemical assessment in clinical samples. Acta Pharmacol Sin. 2008;29:364–370. doi:10.1111/j.1745-7254.2008.00747.x.
- Subong EN, Shue MJ, Epstein JI, Briggman JV, Chan PK, Partin AW. Monoclonal antibody to prostate cancer nuclear matrix protein (PRO:4-216) recognizes nucleophosmin/B23. Prostate. 1999;39:298–304.
- Wong JC, Hasan MR, Rahman M, Yu AC, Chan SK, Schaeffer DF, Kennecke HF, Lim HJ, Owen D, Tai IT, et al. Nucleophosmin 1, upregulated in adenomas and cancers of the colon, inhibits p53-mediated cellular senescence. Int J Cancer. 2013;133:1567–1577. doi:10.1002/ijc.28180.
- Liu Y, Zhang F, Zhang XF, Qi LS, Yang L, Guo H, Zhang N. Expression of nucleophosmin/NPM1 correlates with migration and invasiveness of colon cancer cells. J Biomed Sci. 2012;19:53. doi:10.1186/1423-0127-19-53.
- Zlobec I, Steele R, Terracciano L, Jass JR, Lugli A. Selecting immunohistochemical cut-off scores for novel biomarkers of progression and survival in colorectal cancer. J Clin Pathol. 2007;60:1112–1116. doi:10.1136/jcp.2006.044537.
- Zhu ZH, Sun BY, Ma Y, Shao JY, Long H, Zhang X, Fu J-H, Zhang L-J, Su X-D, Wu Q-L, et al. Three immunomarker support vector machines-based prognostic classifiers for stage IB non-small-cell lung cancer. J Clin Oncol. 2009;27:1091–1099. doi:10.1200/JCO.2008.16.6991.
- Wagner HE, Thomas P, Wolf BC, Zamcheck N, Jessup JM, Steele GD Jr. Characterization of the tumorigenic and metastatic potential of a poorly differentiated human colon cancer cell line. Invasion Metastasis. 1990;10:253–266.
- Qi W, Shakalya K, Stejskal A, Goldman A, Beeck S, Cooke L, Mahadevan D. NSC348884, a nucleophosmin inhibitor disrupts oligomer formation and induces apoptosis in human cancer cells. Oncogene. 2008;27:4210–4220. doi:10.1038/onc.2008.54.
- Kern DH, Morgan CR, Hildebrand-Zanki SU. In vitro pharmacodynamics of 1-beta-D-arabinofuranosylcytosine: synergy of antitumor activity with cis-diamminedichloroplatinum(II). Cancer Res. 1988;48:117–121.
- Romanelli S, Perego P, Pratesi G, Carenini N, Tortoreto M, Zunino F. In vitro and in vivo interaction between cisplatin and topotecan in ovarian carcinoma systems. Cancer Chemother Pharmacol. 1998;41:385–390. doi:10.1007/s002800050755.
- Rahman M, Selvarajan K, Hasan MR, Chan AP, Jin C, Kim J, Chan SK, Le ND, Kim Y-B, Tai IT, et al. Inhibition of COX-2 in colon cancer modulates tumor growth and MDR-1 expression to enhance tumor regression in therapy-refractory cancers in vivo. Neoplasia. 2012;14:624–633. doi:10.1593/neo.12486.
- Chou TC. Drug combination studies and their synergy quantification using the Chou-Talalay method. Cancer Res. 2010;70:440–446. doi:10.1158/0008-5472.CAN-09-1947.
- Parsana P, Riester M, Waldron L. CuratedCRCData: clinically annotated data for the colorectal Cancer transcriptome. Bioconductor. 2013. http://www.bioconductor.org/packages/curatedCRCData/.
- Hingorani K, Szebeni A, Olson MO. Mapping the functional domains of nucleolar protein B23. J Biol Chem. 2000;275:24451–24457.
- Lee HH, Kim HS, Kang JY, Lee BI, Ha JY, Yoon HJ, Lim SO, Jung G, Suh SW. Crystal structure of human nucleophosmin-core reveals plasticity of the pentamer-pentamer interface. Proteins. 2007;69:672–678. doi:10.1002/prot.21504.
- Mitrea DM, Grace CR, Buljan M, Yun MK, Pytel NJ, Satumba J, Nourse A, Park C-G, Madan Babu M, White SW, et al. Structural polymorphism in the N-terminal oligomerization domain of NPM1. Proc Natl Acad Sci U S A. 2014;111:4466–4471. doi:10.1073/pnas.1321007111.
- Yan N, Shi Y. Mechanisms of apoptosis through structural biology. Annu Rev Cell Dev Biol. 2005;21:35–56.
- Tibbetts RS, Brumbaugh KM, Williams JM, Sarkaria JN, Cliby WA, Shieh SY, Taya Y, Prives C, Abraham RT. A role for ATR in the DNA damage-induced phosphorylation of p53. Genes Dev. 1999;13:152–157. doi:10.1101/gad.13.2.152.
- Wu GS, Ding Z. Caspase 9 is required for p53-dependent apoptosis and chemosensitivity in a human ovarian cancer cell line. Oncogene. 2002;21:1–8. doi:10.1038/sj.onc.1205020.
- Agarwal E, Brattain MG, Chowdhury S. Cell survival and metastasis regulation by Akt signaling in colorectal cancer. Cell Signal. 2013;25:1711–1719. doi:10.1016/j.cellsig.2013.03.025.
- Green DR, Kroemer G. Cytoplasmic functions of the tumour suppressor p53. Nature. 2009;458:1127–1130.
- Danielsen SA, Eide PW, Nesbakken A, Guren T, Leithe E, Lothe RA. Portrait of the PI3K/AKT pathway in colorectal cancer. Biochim Biophys Acta. 2015;1855:104–121.
- Papadatos-Pastos D, Rabbie R, Ross P, Sarker D. The role of the PI3K pathway in colorectal cancer. Crit Rev Oncol Hematol. 2015;94:18–30. doi:10.1016/j.critrevonc.2014.12.006.
- Luo H, Yang Y, Duan J, Wu P, Jiang Q, Xu C. PTEN-regulated AKT/FoxO3a/Bim signaling contributes to reactive oxygen species-mediated apoptosis in selenite-treated colorectal cancer cells. Cell Death Dis. 2013;4:e481. doi:10.1038/cddis.2013.3.
- Franke TF. PI3K/Akt: getting it right matters. Oncogene. 2008;27:6473–6488.
- Samuels Y, Wang Z, Bardelli A, Silliman N, Ptak J, Szabo S, Yan H, Gazdar A, Powell SM, Riggins GJ, et al. High frequency of mutations of the PIK3CA gene in human cancers. Science. 2004;304:554. doi:10.1126/science.1096502.
- Medico E, Russo M, Picco G, Cancelliere C, Valtorta E, Corti G, Buscarino M, Isella C, Lamba S, Martinoglio B, et al. The molecular landscape of colorectal cancer cell lines unveils clinically actionable kinase targets. Nat Commun. 2015;6:7002. doi:10.1038/ncomms8002.
- Alessi DR, James SR, Downes CP, Holmes AB, Gaffney PR, Reese CB, Cohen P. Characterization of a 3-phosphoinositide-dependent protein kinase which phosphorylates and activates protein kinase Balpha. Curr Biol. 1997;7:261–269. doi:10.1016/S0960-9822(06)00122-9.
- Sarbassov DD, Guertin DA, Ali SM, Sabatini DM. Phosphorylation and regulation of Akt/PKB by the rictor-mTOR complex. Science. 2005;307:1098–1101. doi:10.1126/science.1106148.
- Ahn JY, Liu X, Cheng D, Peng J, Chan PK, Wade PA, Ye K. Nucleophosmin/B23, a nuclear PI(3,4,5)P(3) receptor, mediates the antiapoptotic actions of NGF by inhibiting CAD. Mol Cell. 2005;18:435–445. doi:10.1016/j.molcel.2005.04.010.
- Lee SB, Xuan Nguyen TL, Choi JW, Lee KH, Cho SW, Liu Z, Ye K, Bae SS, Ahn J-Y. Nuclear Akt interacts with B23/NPM and protects it from proteolytic cleavage, enhancing cell survival. Proc Natl Acad Sci U S A. 2008;105:16584–16589. doi:10.1073/pnas.0807668105.
- Kim CK, Nguyen TL, Lee SB, Park SB, Lee KH, Cho SW, Ahn JY. Akt2 and nucleophosmin/B23 function as an oncogenic unit in human lung cancer cells. Exp Cell Res. 2011;317:966–975. doi:10.1016/j.yexcr.2010.12.013.
- Lo SJ, Fan LC, Tsai YF, Lin KY, Huang HL, Wang TH, Liu H, Chen T-C, Huang S-F, Chang C-J, et al. A novel interaction of nucleophosmin with BCL2-associated X protein regulating death evasion and drug sensitivity in human hepatoma cells. Hepatology. 2013;57:1893–1905. doi:10.1002/hep.26209.
- Chan HJ, Weng JJ, Yung BYM. Nucleophosmin/B23-binding peptide inhibits tumor growth and up-regulates transcriptional activity of p53. Biochem Biophys Res Commun. 2005;333:396–403. doi:10.1016/j.bbrc.2005.04.176.
- Jian Y, Gao Z, Sun J, Shen Q, Feng F, Jing Y, Yang C. RNA aptamers interfering with nucleophosmin oligomerization induce apoptosis of cancer cells. Oncogene. 2009;28:4201–4211. doi:10.1038/onc.2009.275.
- Sarduy M, García I, Coca M, Perera A, Torres L, Valenzuela C, Baladrón I, Solares M, Reyes V, Hernández I, et al. Optimizing CIGB-300 intralesional delivery in locally advanced cervical cancer. Br J Cancer. 2015;112:1636–1643. doi:10.1038/bjc.2015.137.
- Destouches D, Page N, Hamma-Kourbali Y, Machi V, Chaloin O, Frechault S, Birmpas C, Katsoris P, Beyrath J, Albanese P, et al. A simple approach to cancer therapy afforded by multivalent pseudopeptides that target cell-surface nucleoproteins. Cancer Res. 2011;71:3296–3305. doi:10.1158/0008-5472.CAN-10-3459.
- De Cola A, Franceschini M, Di Matteo A, Colotti G, Celani R, Clemente E, Ippoliti R, Cimini AM, Dhez AC, Vallée B, et al. N6L pseudopeptide interferes with nucleophosmin protein-protein interactions and sensitizes leukemic cells to chemotherapy. Cancer Lett. 2018;412:272–282. doi:10.1016/j.canlet.2017.10.038.