
ABSTRACT
Pancreatic ductal adenocarcinoma (PDAC) is one of the deadliest cancers in the modern world, in part due to poor delivery of chemotherapeutics. Sonoporation can be used to enhance the efficacy of standard of care therapies for PDAC. Using xenograft models of PDAC we investigate sonoporation using four ifferent ultrasound contrast agents (UCAs) and two ultrasound regimens to identify the ideal parameters to increase therapeutic efficacy. MIA-PaCa2 xenografts in over 175 immunodeficient mice were treated with gemcitabine and paclitaxel and subjected to low or high power ultrasound (60 and 200 mW/cm2 respectively) in conjunction with one of four different UCAs. The UCAs investigated were Definity®, SonoVue®, Optison™ or Sonazoid™. Tumor volumes, vascularity, hemoglobin, and oxygenation were measured and compared to controls. High power treatment in conjunction with Sonazoid sonoporation led to significantly smaller tumors when started early (tumors ~50mm3; p = .0105), while no UCAs significantly increased efficacy in the low power cohort. This trend was also found in larger tumors (~250mm3) where all four UCA agents significantly increased therapeutic efficacy in the high power group (p < .01), while only Definity and SonoVue increased efficacy in the low power cohort (p < .03). Overall, the higher power ultrasound treatment modality was more consistently effective at decreasing tumor volume and increasing vascularity characteristics. In conclusion, Sonazoid was the most consistently effective UCA at decreasing tumor volume and increasing vascularity. Thus, we are pursuing a larger phase II clinical trial to validate the increased efficacy of sonoporation in conjunction with chemotherapy in PDAC patients.
Introduction
Pancreatic ductal adenocarcinoma (PDAC) remains a lethal cancer with an overall five year survival rate of approximately 10%Citation1 and a median survival for all patients of less than 6 months.Citation2 Standard-of-care chemotherapy regimens consist of the cocktail FOLFIRINOX (oxaliplatin, irinotecan, 5-FU, leucovorin) or gemcitabine as either a single agent therapy or in combination with either paclitaxel or radiation therapy.Citation3–5 Unfortunately, these treatment regimens are not targeted in nature and have only marginally increased overall survival rates, and thus, are largely ineffective in preventing recurrence and eventual death.Citation1,Citation3–7
A primary driving force behind the low PDAC survival rates is that PDAC tumors are highly refractory to current systemic chemotherapeutics, Citation1,Citation3–7 this is in part due to poor drug delivery.Citation8 In contrast to normal tissue, up to 90% of the tumor’s mass consists of dense and fibrotic stroma,Citation9 which makes it difficult for chemotherapeutic agents to penetrate. Furthermore, whereas normal tissue possesses regular and consistent vasculature, the hyperdense stroma found in PDAC contributes to irregular and sparse vasculature. The combination of hyperdense stroma and hypodense vasculature leads to poor drug delivery, Citation8 and sets up a microenvironment that includes hypoxic, and hypoglycemic conditions which can further promote drug resistance.Citation10,Citation11 Attempts to increase drug delivery by targeting the specific pathways that contribute to the hyperdense stroma such as targeting the Hedge Hog pathway and hyaluronan/hyaluronic acid have demonstrated significant efficacy in pre-clinical models.Citation12–14 These have unfortunately shown little success in improving drug delivery/efficacy in the clinic.Citation12–15 A more promising attempt to target the tumor vasculature to improve drug delivery has been realized through mechanically increasing drug delivery utilizing sonoporation.Citation16,Citation17 Sonoporation involves the intravenous delivery of gas-filled microbubbles (1–8 μm in diameter); originally designed as ultrasound contrast agents (UCAs), which can enhance ultrasound imaging signals by up to 30 dB.Citation18,Citation19 Due to the size of these UCAs, they are primarily restricted to circulation within the vasculature.Citation17 The ultrasound pulses used for imaging cause the bubbles to vibrate, which can increase vasculature permeability leading to an increase in drug uptake.Citation20–22 It has been demonstrated in a small number of PDAC patients that sonoporation treatment aimed at enhancing chemotherapy efficacy has led to significant improvement in patients outcomes.Citation23,Citation24 These results, however, need to be verified in larger clinical trials in order to fully demonstrate the potential efficacy of this approach.
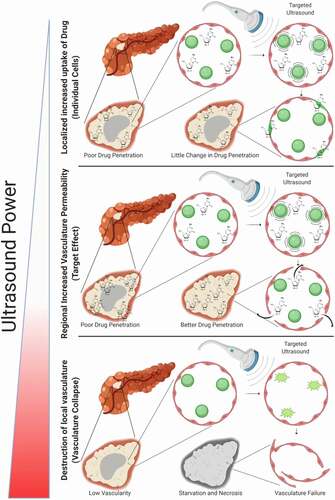
Microbubbles generate three distinct modes of behavior in response to the ultrasound wave that can be utilized for cancer therapy.Citation25 While discussing these it is important to keep in mind that while UCAs are delivered systemically, ultrasound can be targeted and so these effects can be localized to patient tumors. First, at low acoustic powers UCA oscillations can cause small ruptures in cell membranes locally increasing the delivery of drugs although not necessarily causing a regional increase in drug delivery, as the acoustic power increases the oscillation becomes nonlinear (so-called stable cavitationCitation15), which can lead to larger ruptures in capillaries causing the escape of blood, pooling and increased regional drug delivery. Finally, as the acoustic intensity is increased further, the UCAs can burst emitting shockwaves that lead to the rupture of local vasculature (so-called inertial cavitationCitation15), which can starve tumors of blood supply (). In this work we are attempting to increase the drug delivery to the entire tumor as depicted in the “target” section of . It is important to note that this is a generalized depiction of UCA effects, and at any given power level multiple of these effects are likely occurring simultaneously, however the predominant effects do shift as indicated when ultrasounds power is increased.
Figure 1. Effects of Sonoporation: At lower power the sonoporation can cause ruptures in cell membranes, increasing the permeability of individual cells. As power increases sonoporation can cause gaps between and through cells causing pooling of blood and an increased permeabilization of a regional area to drug, this is the modality of interest. As power continues to increase sonoporation can cause the rupture of the ultrasound contrast agents which can completely disrupt blood supply in a specific region
Another important parameter that can alter the efficacy of sonoporation is the choice of UCA.Citation26 In this study we investigated four different UCAs which varied across several parameters spanning in size from ~1-5 µm, surface zeta potential of −4.2 to −82 mV, with shells composed of either lipids, phospholipids, or proteins, and encasing one of the following gasses octafluoropropane, perflutren, sulfur hexafluoride, or perflurobutane (). These microbubbles (Definity, Optison, SonoVue and Sonazoid), while diverse, have all been shown to be safe for human use in the clinic. Through investigating multiple UCAs and two power settings, we are attempting to determine the optimal conditions for an upcoming phase II trial investigating the efficacy of sonoporation in increasing the efficacy of standard therapeutics for PDAC.
Table 1. Comparison of ultrasound contrast agents
Materials and methods
This study was conducted at Thomas Jefferson University (TJU; Philadelphia, PA, USA) and University of Bergen (UiB; Bergen, Norway). Athymic nude female mice were purchased from The Jackson Laboratory (Bar Harbor, ME, USA), while male NOD-scid IL2Rgnull mice (referred to as NSG) were bred at Vivarium (UiB) from breeding pairs purchased from Charles River (Wilmington, MA, USA). All experiments were performed following Institutional Animal Care and Use Committee (IACUC) approval and in accordance with the Animal Care Policies of TJU and the ARRIVE guidelines. All animals were kept in individually ventilated cages (3–5 mice per cage), and were kept on 24 hours 12:12 day night cycles, all treatments were performed during “day” cycles, mice were given ad libidum access to food and water, and during all procedures mice were kept on heating pads at 37°C. Xenografts were grown in 6 to 10-week-old mice via subcutaneous injection of 5 × 10⁶ MIA PaCa-2 cells (ATCC, Manassas, VA, USA) resuspended in 25–50% BD Matrigel™ (BD Science, Franklin Lakes, NJ, USA). Prior to injections MIA PaCa-2 cells were grown at 5% CO2, 37°C in Dulbecco’s Modified Eagle Medium supplemented with 10% Fetal Bovine Serum, Pen Strep at 50 units/ml, and 2 mM L-Glutamine. Cells were tested semiannually with short tandem repeat analysis and monthly for mycoplasma contamination. Initial experiments were performed with tumors growing at an exponential rate, when tumors reached ~50 mm3 (after ~2 weeks), while subsequent experiments were performed with tumors growing at a relatively linear rate, when tumors reached ~250 mm3 (after ~4 weeks). At that time, 4 UCAs: Definity® (Lantheus Medical Imaging, N Billerica, MA, USA), SonoVue® (or Lumason; Bracco, Milan, Italy), Optison™ (GE Healthcare, Princeton, NJ, USA) and Sonazoid™ (GE Healthcare, Oslo, Norway) were tested.
Sonoporation procedures
Sonoporation with UCAs was achieved using a Logiq E9 ultrasound scanner (GE Healthcare, Waukesha, WI, USA) in a high or a low acoustic power regimen corresponding to ISPTA values of approximately 200 or 60 mW/cm2, peak negative pressure values of 550–650 and 165–195 kPa, respectively, and a frame rate of 11–13 Hz. The highest line density was used with 12 pulses (20 µs pulse length) transmitted at a frequency of 2.0 MHz. The dosages for all 4 UCAs were adjusted to approximately the same microbubble concentration (1.2–3.0 × 10⁸ bubbles/ml) based on the maximum human dose allowed for Definity. Sonoporation was performed on a Logiq E9 ultrasound scanner with a C6 curvi-linear transducer (bandwidth1.0–6.0 MHz) modified to allow access to pulse parameters and acoustic output power values (ISPTA values) within the color Doppler pathway. In order to ensure consistent delivery of UCA agents short small diameter tubing (250 µm) was used with a total volume of 9.8 µl and delivery of UCA agents was monitored using continuous subharmonic imaging (SHI).
IV/IP Treatment Experimental Design
After tumors reached ~50 mm3 63 NSG mice were randomized into 3 control and 8 active treatment groups. Each of the active treatment groups were allocated 6 mice, while the control groups consisted of 5 mice per group. Treatments were performed once weekly for 6 weeks. One control group was treated with ultrasound, one control group received chemotherapy only (12.5 mg/kg Abraxane IV and 100 mg/kg gemcitabine IP, both 100 µl injections) and the third control group received ultrasound without the addition of a contrast agent and chemotherapy. Gemcitabine was dosed IP 30 min prior and Abraxane was dosed intravenously (IV) 15 min prior to sonoporation, respectively. The UCAs were diluted in saline for a total volume of 200 µl, which was infused IV over 5 min using an automatic infusion pump (VueJect, Bracco, Milan, Italy) following chemotherapy administration. The 8 treatment groups received IV/IP chemotherapy combined with one of the UCAs and one of the acoustic power settings as described above.
Doppler imaging
In this experiment, ultrasound imaging was performed weekly with a Vevo 2100 small animal ultrasound imaging system (Fujifilm VisualSonics Inc., Toronto, Ontario, Canada) using a broad bandwidth (13–24 MHz) MS-250 linear array transducer. The B-mode and Power Doppler imaging (PDI) settings were optimized per individual mouse to minimize artifacts and achieve maximum sensitivity starting with a pulse repetition frequency (PRF) of 2.0 kHz, a Doppler gain of 30–35 dB, sensitivity at 5 and priority at 40–50%. Tumor volumes and fractional vascularity (FV in %) were measured in 3D using the VEVO software (v1.6.0, Fujifilm VisualSonics) as the percentage of the tumor volume containing a flow signal.
IP Treatment Experimental Design
120 mice were randomized into 2 control and 8 active treatment groups after reaching volumes of ~250 mm3. Each of the active treatment groups were allocated 10 mice (i.e., 80 mice in total), while the control groups consisted of 15 mice for the vehicle (IP 200 µl 10% ETOH, 10% Cremphor in Saline) and IV group and 20 mice for the chemotherapy (30 mg/kg paclitaxel and 100 mg/kg gemcitabine IP) groups. Treatments were performed once weekly for 4 weeks. Treatments were initially planned for 5 weeks (as we expected faster growth as we started with larger tumors), however due to increased toxicity in the IP/IP group as compared to the IV/IP group and limited efficacy of the chemo control they were curtailed after 4 weeks of treatment. The 8 active treatment groups received 30 mg/kg paclitaxel IP and 100 mg/kg gemcitabine IP combined in conjunction with one of the four UCAs. All cohorts were treated once a week for 4 weeks. Paclitaxel was dosed intraperitoneally (IP) 2 h prior to sonoporation and gemcitabine was dosed IP 30 min prior to sonoporation. The UCAs were diluted for a total volume of 200 µl, which was infused IV over 10 min using an automatic infusion pump (model VS-20019 Vevo Infusion Pump; Fujifilm Visualsonics, Toronto, Canada) following chemotherapy administration. Sonoporation was induced using a Logiq E9 ultrasound scanner operating in the same high or a low acoustic power cohorts described above.
Doppler and Photoacoustic Imaging
3D PDI and photoacoustic imaging was performed on a Vevo 2100 LAZR scanner with an LZ250 probe (Fujifilm Visualsonics, Toronto, Canada) to determine PDI, hemoglobin signal (HbT), oxygenation levels in detected blood (SO2 Avg), and oxygenation levels over the entire tumor volume (SO2 Tot).Citation27 Depth, gain, and time gain compensation were optimized at the initial imaging time point and locked for the duration of the experiments. These measurements were obtained (as described previously) at baseline and once weekly for four weeks in subgroups consisting of 3 random mice from each group. Software utilized for this work was Vevo Lab (Vevo LAB v2.2.0, Fujifilm VisualSonics Inc., Toronto, Ontario, Canada).
Perfusion analysis
After all treatments, three representative mice per group (i.e., the mice from the photoacoustic subgroups) were selected for the analysis of perfusion and excluded from overall survival. Mice were infused with 100 µG of tomato lectin (Lectin from Lycopersicon esculentum, Sigma Aldrich, St. Lewis, Missouri, catalog # L0401-1 mg), 30 min prior to sacrifice via the tail vein to allow perfused vascular structures to be visualized on microscopy.Citation28 Organs (kidneys, liver) and tumor were removed and placed directly into 4% paraformaldehyde solution for overnight fixation at 4°C. The following day, cryoprotection was performed by transferring the tissues to a 15% sucrose solution (Sigma Aldrich, St. Lewis, Missouri, catalog # 57–50-1) in Phosphate Buffer Saline (PBS) until the tissue sinks (6–12 h) and then transferred into a 30% sucrose in PBS solution overnight or until the tissue sinks. Once the tissues were adequately preserved, they were embedded in Optimal Cutting Temperature (OCT) and sectioned using a cryostat for thin 10 µm sections and mounted. Slides were processed by rinsing in Tris buffer (0.1 M, pH 7.4) for 5 min, and blocked with 3% normal goat serum for 1 h. Slides were stained with primary antibody, Anti-Mouse CD31 (PECAM-1) (Dianova, Hamburg, Germany, catalog # DIA 310, dilution 1:3000), diluted in Tris buffer, and incubated overnight in darkness at room temperature. The following day the antibody was removed, slides were rinsed in Tris buffer, and secondary antibody, anti-rat Alexa Fluor 594 (Thermo Fisher, Waltham, Massachusetts, catalog # A11020, 4 µg/mL), for 2 h in darkness at room temperature. Once secondary was removed, a final rinse was performed and cover slipped with Vectashield with DAPI (Vector Labs, Burlingame, California, catalog # H1200). Slides were imaged utilizing a DM4 B microscope (Leica Microsystems, Wetzlar, Germany) in the green (470/40 nm excitation, 525/50 nm emission), red (560/40 nm excitation, 645/75 nm emission) and blue (350/50 nm excitation, 460/50 nm emission) filters at 20x magnification (x = 1920pixels/622.18 µm, y = 1440pixels/466.55 µm, 1 pixel ~ .1 µm2) and perfusion was assessed qualitatively.Citation28
Anesthesia
Similar to previously described work in mice, Citation29 mice were anesthetized using isoflurane titrated to effect (~.5–3%) and oxygen with a flow rate of .5–1 l/min for all procedures requiring anesthesia. For imaging mice were anesthetized for the duration of the imaging utilizing a chamber, and for infusion and ultrasound treatments they were anesthetized utilizing a nose cone.
Kaplan-Meier Survival Analysis
The remaining mice were followed for tumor volume growth and survival, until they reached the euthanasia criteria mandated by the IACUC. In this murine xenograft model of PDAC, the euthanasia criteria was either a tumor volume exceeding 1500 mm3 and/or significant distress displayed by the animal. Kaplan-Meier survival curves were generated for each treatment and control group.
Subharmonic Imaging
Above a certain acoustic pressure threshold (typically > 200 kPa), UCA microbubbles generate a marked subharmonic frequency component (at half the transmit frequency).Citation30,Citation31 The subharmonic generation is specific to the UCA and does not occur in tissue. We have previously demonstrated the utility of SHI (receiving at the subharmonic frequency) for depiction of PDAC.Citation30 SHI was performed at the end of the infusion to verify vascular access. SHI was implemented on the Logiq E9 system by transmitting 4 cycle pulses at 2.5 MHz and receiving at 1.25 MHz.Citation30 Of note, for the IV/IP experiment dosing was performed on the last day of treatment to maintain consistency of animal treatment prior to SHI.
Statistical Analysis
Due to the low number of animals in several experiments we initially performed Kolmogorov-Smirnov and Shapiro-Wilk tests in order to asses normalcy, unless otherwise stated for all groups normal distribution could not be rejected (p > .30). Comparisons were in general made relative to percentage fold change differences to chemotherapy-treated controls. In this manner, as many experiments as possible maintained the same control scheme. Statistical analyses were performed using GraphPad Prism 8.3.0 (GraphPad Software, La Jolla, CA, USA) using two-way paired t tests of the entire time series of each treatment group performed against chemotherapy-treated control with a p-value of less than 0.05 considered statistically significant. For Kaplan-Meier survival analysis we utilized Mantel-Cox, Logrank test for trend and Grehan-Breslow-Wilcoxon tests. For all graphs unless otherwise stated error bars represent standard deviation.
Results
In order to determine the most efficacious method for sonoporation in PDAC we investigated several different UCAs (.) We also investigate varying acoustic power as varying the power settings of ultrasound directly affects the forces exerted upon the UCAs, and thus the effects they have on surrounding tumor cells/vasculature as described in .Citation32
Exponential tumor growth phase and IV/IP chemotherapeutic treatment
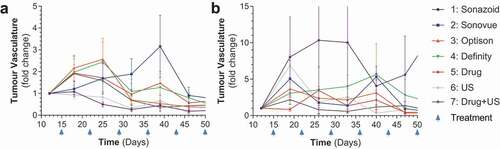
We initially investigated the efficacy of all four UCAs in mice that were treated IV with abraxane (albumin bound paclitaxel) and IP with gemcitabine prior to IV infusion of UCA’s and high and low ultrasound sonoporation (Supplementary Figure 1a,B, Supplementary Table 1). For all sonoporation work SHI was utilized to confirm the presence of UCAs within the tumor vasculature. IV treatment with paclitaxel and gemcitabine led to significant reductions in tumor growth (for low and high p = .0220 and p = .0162, respectively) (,B). This growth reduction was modulated in the low power ultrasound cohort receiving Sonazoid (p = .0152), and in 2 of the groups with high power ultrasound treatment (Sonazoid p = .0046 and Optison p = .0104) (-F). As tumors grew larger, there was a decreasing trend in vascularity, this is to be expected as PDAC tumors generally form hypovascularized and hypoxic cores.Citation10 This decreasing trend of tumor vasculature was ameliorated by both Sonazoid and Definity when treated with the high power modality (p values of .007 and .0141, respectively), however in the low power treatment group none of the UCAs caused an increase in tumor vasculature, and Sonazoid treatment caused a decrease in vasculature (p = .0056), although this appears to be due to this particular group having unusually high starting tumor vasculature (p = .0017) (-B, Supplementary Figure 2A,B). These results overall indicated that sonoporation was effective at increasing relative vascularization and drug efficacy in small tumors as they grew. Of note, there were no significant changes between drug treatment with ultrasound treatment (in the absence of a UCA agent) and drug treatment alone in any of the experiments across both high and low power modalities (). Due to the lack of size difference across groups survival analysis was not performed for these animals.
Figure 2. Tumor growth for IV treated mice: A,B) Comparison of all treatment arms across low and high ultrasound power respectively C-F) Comparison of total tumor volume for ultrasound alone vs individual ultrasound contrast agents (SonoVue + drug + US, Sonazoid+ drug + US, Optison+ drug + US and Definity+ drug + US, respectively) against chemotherapy split by high and low ultrasound power settings
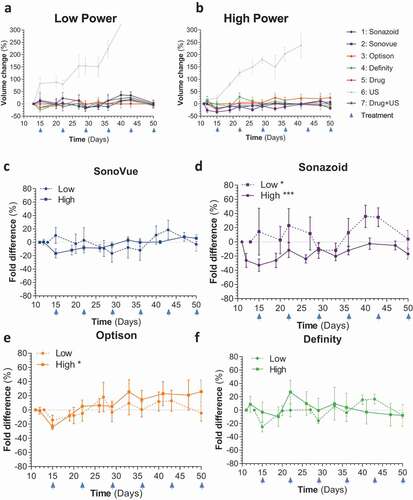
Figure 3. Tumor vascularity for IV treated mice: A-B) Comparison of all treatment groups as broken down by low and high ultrasound power by tumor vasculature % fold change
In smaller tumors chemotherapy tends to be more effective, which is what we observed. In order to have a less drastic effect of chemotherapy alone we started treatment at larger tumor sizes where therapy was expected to have a reduced effect as tumors would be in a linear phase of growth as opposed to exponential. Therefore, a second experiment with larger group sizes was conducted to confirm if there was any increase in efficacy as tumors grew larger and were at a more linear phase of growth.
Linear tumor growth phase and IP treatment of chemotherapeutic treatment
After inoculation, tumors were allowed to grow until they reached ~250 mm3 prior to being split into treatment arms. For this work chemotherapy drugs were all dosed IP as opposed to IV to decrease the amount of tail swelling/bruising prior to infusion as repeated IV injections prior to attempting to infuse the mice led to markedly increased infusion failure. In the initial work infusion was performed over 5 min and we unfortunately observed vascular damage in some mouse tail veins, which impeded consistency. In order to avoid such damage, we decreased the flow rate and increased the infusion time to 10 min for the second experiment. Drug dosing overall design (i.e., 1x weekly bolus dosing) was selected to achieve maximal drug concentration in the blood at the time of sonoporation, and dose timing was performed to approximate the dosing regimen in our previous clinical trial,Citation24 and with enough of a delay (specifically for gemcitabine) to allow us to reliably prepare the mice for UCA infusion. Mice in treatment arms were treated with paclitaxel IP at −120 min to allow for increased concentration of paclitaxel in plasma and tissues,Citation33 while gemcitabine dose timing was maintained at −30 min IP followed by 10 min of infusion of UCAs along with simultaneous targeted ultrasound at the site of the tumor (Supplementary Figure 3a, Supplementary Table 2). A subset of three mice from each arm were analyzed for oxygen and hemoglobin percentages in the blood and total accumulated levels across the entire tumor. After three cycles of treatment mice were treated with tomato lectin and sacrificed to detect the degree of infiltration of tomato lectinCitation28 within the tumor (Supplementary Figure 3b).
As expected, paclitaxel and gemcitabine caused a decrease in tumor growth (). This decrease in tumor growth was less dramatic as compared to the initial IV experiment, but these results are to be expected as larger tumors tend to be more resistant to therapeutics.Citation34,Citation35 This efficacy was bolstered by augmenting treatment with sonoporation; in particular, there appeared to be a more significant decrease in the high power sonoporation groups, as 2 out of 4 low power groups were statistically significantly different as compared to chemotherapy alone (SonoVue and Optison p = .027 and .0003, respectively); while all of the high-powered groups were significantly different (SonoVue, Sonazoid, Optison and Definity, p = .0008, .003, .0003 and .0012, respectively; -F). There was no statistically significant difference between total oxygen saturation in tumors treated solely with chemotherapy as compared to vehicle alone treated tumors (). While we were unable to compare the low power ultrasound group due to equipment malfunction, we found that in the high power group only Sonazoid caused a small but statistically significant increase in total oxygenation (p = .032) (-E). There was no statistically significant change between chemo and IP injections of vehicle control (IP 200 ul 10% ETOH, 10% Cremphor in Saline) for average SO2 values (Supplementary Figure 4a). High power sonoporation with Definity led to a statistically significant increase in average SO2 levels (p = .0495) (Supplementary Figure 4b-E).
Figure 4. Tumor volumes of IP treated mice: A) Tumor volumes of all mice normalized as percentage difference in fold change to the chemotherapy treated control B)Comparison of high vs low ultrasound power differences against chemotherapy C-F) Comparison of individual ultrasound contrast agents (SonoVue+ drug + US, Sonazoid+ drug + US, Optison+ drug + US and Definity+ drug + US, respectively) against chemotherapy split by high and low ultrasound power settings
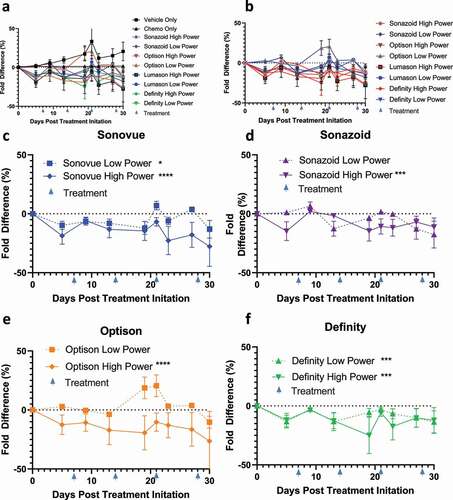
Figure 5. Measures of tumor vascularity: A-E) Comparison of vehicle and individual ultrasound contrast agents against chemotherapy % total O2 in tumors split by high power settings F) Comparison of tumor oxygenation at baseline prior to sonoporation with Sonazoid in the high acoustic power cohort and after sonoporation treatment has been completed (4 weeks later just prior to sacking). This image depicts an overall increase in oxygenation from 49% to 53% within the imaging plane (and from 41% to 54% within the entire tumor volume of this animal). G) Tumors were stained with CD31 (red) staining epithelial cells, and counterstained with tomato lectin (green indicating endothelial cells) and DAPI staining (blue demonstrating cellularity)
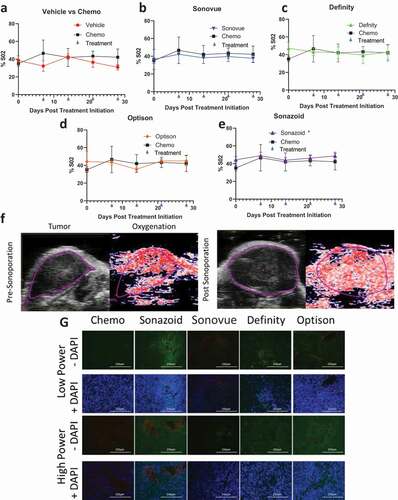
There were no statistically significant changes in average or total hemoglobin levels with the addition of ultrasound and UCAs although Sonazoid trended toward an increase in total hemoglobin (p = .057) (Supplementary Figures 5 and 6). These data indicate a potential pooling and/or leaking of blood in the Sonazoid treatment group, which could explain the increase in total oxygenation and trend toward increased total hemoglobin without an increase in the average values of these two markers of increased blood supply. Indeed, this also held true based on representative SO2 imaging of tumors treated with the UCA Sonazoid where tumors demonstrated an increase in total oxygenation after all four cycles of sonoporation treatment (4-weeks total between imaging) (). The potential increase in pooling of blood in the tumor was further supported by tomato lectin staining. Tumors were assessed for both endothelial cells as indicated by CD31 staining marked tumor vascularity, and permeability of the vasculature and tumor was assessed by the degree of tomato lectin staining in the tumors. Low tomato lectin staining indicated low permeability of the control chemo treated tumors (). Treatment with the UCAs demonstrated a qualitative increase in permeability with only one of the four UCAs with low ultrasound power (Sonazoid), and three of the four in the high power treatment arms (Sonazoid, Definity, Optison). Overall, these data indicate an increase in the permeabilization of the tumor with sonoporation, and this improvement appears most pronounced using the higher power ultrasound treatment with Sonazoid as the UCA.
While the increase in permeabilization matched our expectations, it did not coincide with an overall increase in survival (Supplementary Figure 7A-E). While these results were unexpected, it may have been due to the chemotherapy alone having little efficacy in this particular model as chemotherapy alone was insufficient to increase overall survival (Supplementary Figure 7A). Importantly sonoporation did not appear to significantly impact the toxicity of therapeutics, although IV/IP treatment of drugs in general was significantly better tolerated by the mice than IP/IP treatment (Supplementary Figure 8A-C, Supplementary Table 3). Overall results from both experiments indicated that higher power ultrasound treatment is more beneficial for sonoporation with chemotherapeutics for PDAC, leading to increased efficacy and increased vascularization ().
Table 2. Overall comparisons
The sum total of this work strongly indicate that Sonazoid in the high ultrasound power cohort across all treatment groups was the most consistent for providing improved changes (tumor growth reduction, increased oxygenation, increased tomato lectin staining, increased vascularization) across all experiments, and thus, warrants further investigation as the UCA for use in the phase II clinical trial.
Discussion
Even though the genetic events that drive pancreatic tumorigenesis have been well described and many PDAC tumors harbor “actionable” (i.e., targeted) somatic mutations, PDAC will soon become the 2nd leading cause of cancer-related deaths in the U.S.Citation36 An accepted reason why PDAC is so challenging to treat is the dense tumor microenvironment in which the tumor resides. This microenvironment does not only contain different cell types, but also an austere environment (e.g., hypoxia and low nutrient conditions).Citation37–39 Herein we investigated a novel strategy to circumvent these conditions by evaluating the efficacy of sonoporation with several different UCAs and two different ultrasound intensity levels to increase drug delivery to PDAC tumors. Overall, this work had the broader goal to help better define the optimal UCA to utilize for a phase II clinical trial for PDAC, and to help explore what ultrasound power regimen was appropriate for this work. Initial clinical work establishing the sonoporation efficacy in PDAC was performed using acoustic power of ~ 60 mW/cm2.Citation24 In these experiments, we attempted to explore this intensity level and with a low power setting (ISPTA ~ 60 mW/cm2) and a higher power setting (ISPTA ~ 200 mW/cm2). Second, the original work for PDAC utilized SonoVue (also known as Lumason) based on availability and, therefore, we compared the efficacy of SonoVue versus other commercially available UCAs (Optison, Sonazoid, and Definity) to establish if one of these could potentially prove more effective for subsequent trials. We found that multiple UCAs across both low and high power treatment groups led to increased permeabilization of the tumors as indicated by both tomato lectin staining and percent vascularity (). In particular, treatment with high power ultrasound utilizing Sonazoid as the UCA most consistently caused an increase in permeabilization across the different mouse experiments and the different parameters investigated as markers of permeability (). We will aim for these settings in patients as the increased permeabilization and the pooling/leaking is what we hypothesize allows the chemotherapy more access to the PDAC and thus, improves the therapeutic outcomes.
While the primary endpoint of determining UCAs that increased permeabilization was met, this increase in permeabilization did not lead to dramatically increased efficacy in the overall survival. This is likely due to one of two different factors: 1) drugs not being effective enough when dosed IP and too effective when dosed IV; and 2) that this model may not accurately represent the fibrotic microenvironment found in PDAC. IP dosing of gemcitabine and paclitaxel led to no statistically significant change in overall survival (Supplementary Figure 7A), whereas IV dosing paclitaxel and IP dosing of gemcitabine lead to almost a complete inhibition of tumor growth (,B). Previously gemcitabine has been dosed at 100 mg/kg publications for pancreatic cancer, in some cases this produces almost complete control of tumor burden, Citation40 and in other cases, this produces almost no effect by itself.Citation41 Nab-paclitaxel has been previously utilized at 15 mg/kg for IV injections in pancreatic cancer, Citation42 and when we performed IP injections we increased dosage as IP dosing standardly leads to decreased absorption. The intent of the dosing used was to mimic our previous clinical trial work and to achieve high plasma concentration at the time of sonoporation to increase the ability of sonoporation to increase drug delivery during this time. While the scenarios are consistent with larger tumors being less susceptible to chemotherapeutics, they do not lend themselves well to potentiating efficacy of a drug combination solely through increasing delivery of the drug.
PDAC in general has been characterized by a fibrotic stroma, Citation9 and poor drug delivery.Citation8 While xenograft models of PDAC are expedient and help to decrease overall standard deviation, they do not perfectly mimic the extremely fibrotic tumor microenvironment commonly found in PDAC patients.Citation43,Citation44 They do, however, allow treatment effects, such as the vascular permeabilization associated with sonoporation, to be elucidated.Citation16,Citation17 The results from this and other pre-clinical studies indicate that UCAs weaken endothelial cell junctions, increase fenestration sizes, and can generate minute resealing pores in cells all of which can facilitate chemotherapy to penetrate deeper into the PDAC.Citation16,Citation21,Citation22,Citation45 Drug delivery may also be facilitated by blood pooling in tumor tissue through forcing larger gaps between endothelial cells, potentially allowing for prolonged and direct exposure of tumor tissue to drug without the normal endothelial cell barrier. Nonetheless, the imperfect mimicry of the PDAC microenvironment may explain why we failed to see the drastic improvement in response which has already been demonstrated in PDAC patients with sonoporation augmentation.Citation23,Citation24 Previous work using an orthotopic model of PDAC demonstrated that sonoporation significantly augmented gemcitabine therapy, Citation22 which also points toward various models of PDAC responding differently to sonoporation augmented therapy. Another potential alternative would be to attempt to utilize the same starting tumor volume as our first experiment, while reducing the amount of drug administered.
In conclusion, these studies have demonstrated that from two different acoustic power settings and four different UCAs Sonazoid activated by ultrasound at ISPTA ~ 200 mW/cm2 is the most effective UCA and acoustic settings combination for sonoporation in a murine model of PDAC. We hope that these findings will lay the groundwork for the implementation of a multi-disciplinary therapeutic trial using sonoporation to augment chemotherapy in patients with pancreatic cancer.
Supplemental Material
Download Zip (1.5 MB)Acknowledgments
This project was supported by NIH R01 CA199646. We thank GE Healthcare, Oslo, Norway and Lantheus Medical Imaging, N Billerica, MA, USA for supplying Sonazoid and Optison as well as Definity, respectively.
Supplementary material
Supplemental data for this article can be accessed on the publisher’s website.
Additional information
Funding
References
- Siegel RL, Miller KD, Jemal A. Cancer statistics, 2018. CA Cancer J Clin. 2018;68(1):7–30. Epub 2018/ 01/10. doi: 10.3322/caac.21442. PubMed PMID: 29313949.
- Bilimoria KY, Bentrem DJ, Ko CY, Ritchey J, Stewart AK, Winchester DP, Talamonti MS. Validation of the 6th edition AJCC pancreatic cancer staging system: report from the national cancer database. Cancer. 2007;110(4):738–744. Epub 2007 June 21. doi: 10.1002/cncr.22852. PubMed PMID: 17580363.
- Hegewisch-Becker S, Aldaoud A, Wolf T, Krammer-Steiner B, Linde H, Scheiner-Sparna R, Hamm D, Janicke M, Marschner N, TP KG, et al. Results from the prospective German TPK clinical cohort study: treatment algorithms and survival of 1,174 patients with locally advanced, inoperable or metastatic pancreatic ductal adenocarcinoma. Int J Cancer. 2018;144(5):981–990. Epub 2018/ 07/15. doi: 10.1002/ijc.31751. PubMed PMID: 30006989.
- Kowalewski A, Szylberg L, Saganek M, Napiontek W, Antosik P, Grzanka D. Emerging strategies in BRCA-positive pancreatic cancer. J Cancer Res Clin Oncol. 2018;144(8):1503–1507. Epub 2018/ 05/20. doi: 10.1007/s00432-018-2666-9. PubMed PMID: 29777302.
- Jin WH, Hoffe SE, Shridhar R, Strom T, Venkat P, Springett GM, Hodul PJ, Pimiento JM, Meredith KL, Malafa MP, et al. Adjuvant radiation provides survival benefit for resected pancreatic adenocarcinomas of the tail. J Gastrointest Oncol. 2018;9(3):487–494. Epub 2018/ 07/13. doi: 10.21037/jgo.2018.02.02. PubMed PMID: 29998014; PMCID: PMC6006031.
- Abrams RA. Role of radiation therapy in the management of the patient with pancreatic cancer. Oncology (Williston Park). 1996;10(9 Suppl):13–17. Epub 1996/ 09/01. PubMed PMID: 8884802.
- Kayahara M, Funaki K, Tajima H, Takamura H, Ninomiya I, Kitagawa H, Ohta T. Surgical implication of micrometastasis for pancreatic cancer. Pancreas. 2010;39(6):884–888. Epub 2010/ 02/26. doi: 10.1097/MPA.0b013e3181ce6daa. PubMed PMID: 20182392.
- Olive KP, Jacobetz MA, Davidson CJ, Gopinathan A, McIntyre D, Honess D, Madhu B, Goldgraben MA, Caldwell ME, Allard D, et al. Inhibition of Hedgehog signaling enhances delivery of chemotherapy in a mouse model of pancreatic cancer. Science. 2009;324(5933):1457–1461. Epub 2009/ 05/23. doi: 10.1126/science.1171362. PubMed PMID: 19460966; PMCID: PMC2998180.
- Xie D, Xie K. Pancreatic cancer stromal biology and therapy. Genes Dis. 2015;2(2):133–143. Epub 2015/ 06/27. doi: 10.1016/j.gendis.2015.01.002. PubMed PMID: 26114155; PMCID: PMC4476547.
- Koong AC, Mehta VK, Le QT, Fisher GA, Terris DJ, Brown JM, Bastidas AJ, Vierra M. Pancreatic tumors show high levels of hypoxia. Int J Radiat Oncol Biol Phys. 2000;48(4):919–922. Epub 2000/ 11/10. doi: 10.1016/s0360-3016(00)00803-8. PubMed PMID: 11072146.
- Kamphorst JJ, Nofal M, Commisso C, Hackett SR, Lu W, Grabocka E, Vander Heiden MG, Miller G, Drebin JA, Bar-Sagi D, et al. Human pancreatic cancer tumors are nutrient poor and tumor cells actively scavenge extracellular protein. Cancer Res. 2015;75(3):544–553. Epub 2015/ 02/04. doi: 10.1158/0008-5472.CAN-14-2211. PubMed PMID: 25644265; PMCID: PMC4316379.
- Catenacci DV, Junttila MR, Karrison T, Bahary N, Horiba MN, Nattam SR, Marsh R, Wallace J, Kozloff M, Rajdev L, et al. Randomized phase Ib/II study of Gemcitabine plus placebo or vismodegib, a hedgehog pathway inhibitor, in patients with metastatic pancreatic cancer. J Clin Oncol. 2015;33(36):4284–4292. Epub 2015/ 11/04. doi: 10.1200/JCO.2015.62.8719. PubMed PMID: 26527777; PMCID: PMC4678179.
- Ramanathan RK, McDonough SL, Philip PA, Hingorani SR, Lacy J, Kortmansky JS, Thumar J, Chiorean EG, Shields AF, Behl D, et al. Phase IB/II randomized study of FOLFIRINOX plus pegylated recombinant human hyaluronidase versus FOLFIRINOX alone in patients with metastatic pancreatic adenocarcinoma: SWOG S1313. J Clin Oncol. 2019;37(13):1062–1069. Epub 2019/ 03/01. doi: 10.1200/JCO.18.01295. PubMed PMID: 30817250; PMCID: PMC6494359.
- 1Hingorani SR, Zheng L, Bullock AJ, Seery TE, Harris WP, Sigal DS, Braiteh F, Ritch PS, Zalupski MM, Bahary N, et al. HALO 202: randomized Phase II Study of PEGPH20 plus nab-paclitaxel/gemcitabine versus nab-paclitaxel/gemcitabine in patients with untreated, metastatic pancreatic ductal adenocarcinoma. J Clin Oncol. 2018;36(4):359–366. Epub 2017/ 12/13. doi: 10.1200/JCO.2017.74.9564. PubMed PMID: 29232172.
- Provenzano PP, Cuevas C, Chang AE, Goel VK, Von Hoff DD, Hingorani SR. Enzymatic targeting of the stroma ablates physical barriers to treatment of pancreatic ductal adenocarcinoma. Cancer Cell. 2012;21(3):418–429. Epub 2012/ 03/24. doi: 10.1016/j.ccr.2012.01.007. PubMed PMID: 22439937; PMCID: PMC3371414.
- Helfield B, Chen X, Watkins SC, Villanueva FS. Biophysical insight into mechanisms of sonoporation. Proc Natl Acad Sci U S A. 2016;113(36):9983–9988. Epub 2016/ 08/24. doi: 10.1073/pnas.1606915113. PubMed PMID: 27551081; PMCID: PMC5018802.
- Kooiman K, Roovers S, Langeveld SAG, Kleven RT, Dewitte H, O’Reilly MA, Escoffre JM, Bouakaz A, Verweij MD, Hynynen K, et al. Ultrasound-responsive cavitation nuclei for therapy and drug Delivery. Ultrasound Med Biol. 2020;46(6):1296–1325. Epub 2020/ 03/14. doi: 10.1016/j.ultrasmedbio.2020.01.002. PubMed PMID: 32165014; PMCID: PMC7189181.
- Bouakaz A, de Jong N. WFUMB safety symposium on echo-contrast agents: nature and types of ultrasound contrast agents. Ultrasound Med Biol. 2007;33(2):187–196. Epub 2007/ 01/16. doi: 10.1016/j.ultrasmedbio.2006.07.008. PubMed PMID: 17223253.
- Lyshchik A. Specialty Imaging: fundamentals of CEUS. Amsterdam, The Netherlands: Elsevier; 2019.
- Bjanes T, Kotopoulis S, Murvold ET, Kamceva T, Gjertsen BT, Gilja OH, Schjott J, Riedel B, McCormack E. Ultrasound- and microbubble-assisted gemcitabine delivery to pancreatic cancer cells. Pharmaceutics. 2020;12(2):141. Epub 2020/ 02/13. doi: 10.3390/pharmaceutics12020141. PubMed PMID: 32046005; PMCID: PMC7076495
- Bressand D, Novell A, Girault A, Raoul W, Fromont-Hankard G, Escoffre JM, Lecomte T, Bouakaz A. Enhancing Nab-Paclitaxel delivery using microbubble-assisted ultrasound in a pancreatic cancer model. Mol Pharm. 2019;16(9):3814–3822. Epub 2019/ 07/30. doi: 10.1021/acs.molpharmaceut.9b00416. PubMed PMID: 31356090.
- Kotopoulis S, Delalande A, Popa M, Mamaeva V, Dimcevski G, Gilja OH, Postema M, Gjertsen BT, McCormack E. Sonoporation-enhanced chemotherapy significantly reduces primary tumour burden in an orthotopic pancreatic cancer xenograft. Mol Imaging Biol. 2014;16(1):53–62. Epub 2013/ 07/24. doi: 10.1007/s11307-013-0672-5. PubMed PMID: 23877869.
- Dimcevski G, Kotopoulis S, Bjanes T, Hoem D, Schjott J, Gjertsen BT, Biermann M, Molven A, Sorbye H, McCormack E, et al. A human clinical trial using ultrasound and microbubbles to enhance gemcitabine treatment of inoperable pancreatic cancer. J Control Release. 2016;243:172–181. Epub 2016/ 11/05. doi: 10.1016/j.jconrel.2016.10.007. PubMed PMID: 27744037.
- Kotopoulis S, Dimcevski G, Gilja OH, Hoem D, Postema M. Treatment of human pancreatic cancer using combined ultrasound, microbubbles, and gemcitabine: a clinical case study. Med Phys. 2013;40(7):072902. Epub 2013/ 07/05. doi: 10.1118/1.4808149. PubMed PMID: 23822453.
- Qin J, Wang TY, Willmann JK Sonoporation: applications for Cancer Therapy. Adv Exp Med Biol. 2016;880:263–291. Epub 2015/ 10/22. doi: 10.1007/978-3-319-22536-4_15. PubMed PMID: 26486343.
- Shpak O, Verweij M, de Jong N, Versluis M. Droplets, bubbles and ultrasound interactions. Adv Exp Med Biol. 2016;880:157–174. Epub 2015/ 10/22. doi: 10.1007/978-3-319-22536-4_9. PubMed PMID: 26486337.
- Eisenbrey JR, Merton DA, Marshall A, Liu JB, Fox TB, Sridharan A, Forsberg F. Comparison of photoacoustically derived hemoglobin and oxygenation measurements with contrast-enhanced ultrasound estimated vascularity and immunohistochemical staining in a breast cancer model. Ultrason Imaging. 2015;37(1):42–52. Epub 2014/ 03/22. doi: 10.1177/0161734614527435. PubMed PMID: 24652195.
- Robertson RT, Levine ST, Haynes SM, Gutierrez P, Baratta JL, Tan Z, Longmuir KJ. Use of labeled tomato lectin for imaging vasculature structures. Histochem Cell Biol. 2015;143(2):225–234. Epub 2014/ 12/24. doi: 10.1007/s00418-014-1301-3. PubMed PMID: 25534591.
- Loveless ME, Li X, Huamani J, Lyshchik A, Dawant B, Hallahan D, Gore JC, Yankeelov TE. A method for assessing the microvasculature in a murine tumor model using contrast-enhanced ultrasonography. J Ultrasound Med. 2008;27(12):1699–1709. Epub 2008/ 11/22. doi: 10.7863/jum.2008.27.12.1699. PubMed PMID: 19022995; PMCID: PMC2649799.
- Forsberg F, Stanczak M, Lyshchik A, Loren D, O’Kane P, Siddiqui A, Kowalski TE, Miller C, Fox T, Liu JB, et al. Subharmonic and endoscopic contrast imaging of pancreatic masses: a pilot study. J Ultrasound Med. 2018;37(1):123–129. Epub 2017/ 07/07. doi: 10.1002/jum.14310. PubMed PMID: 28681437; PMCID: PMC5752617.
- Calliada F, Campani R, Bottinelli O, Bozzini A, Sommaruga MG. Ultrasound contrast agents: basic principles. Eur J Radiol. 1998;27(Suppl 2):S157–60. Epub 1998/ 07/04. doi: 10.1016/s0720-048x(98)00057-6. PubMed PMID: 9652516.
- Palekar-Shanbhag P, Chogale MM, Jog SV, Gaikwad SS. Microbubbles and their applications in pharmaceutical targeting. Curr Drug Deliv. 2013;10(4):363–373. Epub 2013/ 01/31. doi: 10.2174/1567201811310040001. PubMed PMID: 23360247.
- Li J, Tang J, Li Y, Yu J, Zhang B, Yu C. Pharmacokinetic profile of paclitaxel in the plasma, lung, and diaphragm following intravenous or intrapleural administration in rats. Thorac Cancer. 2015;6(1):43–48. Epub 2015/ 08/15. doi: 10.1111/1759-7714.12139. PubMed PMID: 26273334; PMCID: PMC4448465.
- Li D, Hu B, Zhou Y, Wan T, Si X. Impact of tumor size on survival of patients with resected pancreatic ductal adenocarcinoma: a systematic review and meta-analysis. BMC Cancer. 2018;18(1):985. Epub 2018/ 10/18. doi: 10.1186/s12885-018-4901-9. PubMed PMID: 30326871; PMCID: PMC6192226.
- Zhan W, Gedroyc W, Xu XY. The effect of tumour size on drug transport and uptake in 3-D tumour models reconstructed from magnetic resonance images. PLoS One. 2017;12(2):e0172276. Epub 2017/ 02/18. doi: 10.1371/journal.pone.0172276. PubMed PMID: 28212385; PMCID: PMC5315397.
- Pishvaian MJ, Blais EM, Brody JR, Lyons E, DeArbeloa P, Hendifar A, Mikhail S, Chung V, Sahai V, Sohal DPS, et al. Overall survival in patients with pancreatic cancer receiving matched therapies following molecular profiling: a retrospective analysis of the know your tumor registry trial. Lancet Oncol. 2020;21(4):508–518. Epub 2020/ 03/07. doi: 10.1016/S1470-2045(20)30074-7. PubMed PMID: 32135080.
- Pishvaian MJ, Brody JR Therapeutic Implications of molecular subtyping for pancreatic cancer. Oncology (Williston Park). 2017;31(3):159–66, 68. Epub 2017/ 03/17. PubMed PMID: 28299752.
- Zarei M, Lal S, Parker SJ, Nevler A, Vaziri-Gohar A, Dukleska K, Mambelli-Lisboa NC, Moffat C, Blanco FF, Chand SN, et al. Posttranscriptional Upregulation of IDH1 by HuR establishes a powerful survival phenotype in pancreatic cancer cells. Cancer Res. 2017;77(16):4460–4471. Epub 2017/ 06/28. doi: 10.1158/0008-5472.CAN-17-0015. PubMed PMID: 28652247.
- Blanco FF, Jimbo M, Wulfkuhle J, Gallagher I, Deng J, Enyenihi L, Meisner-Kober N, Londin E, Rigoutsos I, Sawicki JA, et al. The mRNA-binding protein HuR promotes hypoxia-induced chemoresistance through posttranscriptional regulation of the proto-oncogene PIM1 in pancreatic cancer cells. Oncogene. 2016;35(19):2529–2541. Epub 2015/ 09/22. doi: 10.1038/onc.2015.325. PubMed PMID: 26387536..
- Hou J, Wang L. FKBP5 as a selection biomarker for gemcitabine and Akt inhibitors in treatment of pancreatic cancer. PLoS One. 2012;7(5):e36252. Epub 2012/ 05/17. doi: 10.1371/journal.pone.0036252. PubMed PMID: 22590527; PMCID: PMC3348935.
- Morgan M, El Shaikh MA, Abu-Isa E, Davis MA, Lawrence TS. Radiosensitization by gemcitabine fixed-dose-rate infusion versus bolus injection in a pancreatic cancer model. Transl Oncol. 2008;1(1):44–49. Epub 2008/ 07/09. doi: 10.1593/tlo.07118. PubMed PMID: 18607504; PMCID: PMC2510760.
- Krzykawska-Serda M, Agha MS, Ho JC, Ware MJ, Law JJ, Newton JM, Nguyen L, Curley SA, Corr SJ. Chemotherapy and radiofrequency-induced mild hyperthermia combined treatment of orthotopic pancreatic ductal adenocarcinoma xenografts. Transl Oncol. 2018;11(3):664–671. Epub 2018/ 04/06. doi: 10.1016/j.tranon.2018.02.023. PubMed PMID: 29621664; PMCID: PMC6054595.
- Majumder K, Arora N, Modi S, Chugh R, Nomura A, Giri B, Dawra R, Ramakrishnan S, Banerjee S, Saluja A, et al. Novel Immunocompetent mouse model of pancreatic cancer with robust stroma: a valuable tool for preclinical evaluation of new therapies. J Gastrointest Surg. 2016;20(1):53–65. discussion Epub 2015/ 11/20. doi: 10.1007/s11605-015-2985-y. PubMed PMID: 26582596; PMCID: PMC5724755.
- Farr N, Wang YN, D’Andrea S, Gravelle KM, Hwang JH, Lee D. Noninvasive characterization of pancreatic tumor mouse models using magnetic resonance imaging. Cancer Med. 2017;6(5):1082–1090. Epub 2017/ 04/09. doi: 10.1002/cam4.1062. PubMed PMID: 28390098; PMCID: PMC5430104.
- Yuan F, Dellian M, Fukumura D, Leunig M, Berk DA, Torchilin VP, Jain RK Vascular permeability in a human tumor xenograft: molecular size dependence and cutoff size. Cancer Res. 1995;55(17):3752–3756. Epub 1995/ 09/01. PubMed PMID: 7641188.