
ABSTRACT
Stearoyl-CoA-desaturase 1 (SCD1) deficiency mediates apoptosis in colorectal cancer cells by promoting ceramide de novo synthesis. The mechanisms underlying the cross-talk between SCD1 and ceramide synthesis have not been explored. We treated colorectal cancer cells with an SCD1 inhibitor and examined the effects on gene expression, cell growth, and cellular lipid contents. The main effect of SCD1 inhibition on the fatty acid contents of colorectal cancer cells was a decrease in monounsaturated fatty acids (MUFAs). RNA sequencing (RNA-seq) showed that the most intense alteration of gene expression after SCD1 inhibition occurred in the NF-κB signaling pathway. Further experiments revealed that SCD1 inhibition resulted in increased levels of phosphorylated NF-κB p65 and increased nuclear translocation of NF-κB p65. Treatment with an NF-κB inhibitor eliminated several effects of SCD1 inhibition, mainly including overexpression of serine palmitoyltransferase1 (SPT1), elevation of dihydroceramide contents, and suppression of cell growth. Furthermore, treatment with supplemental oleate counteracted the SCD1-induced NF-κB activation and downstream effects. In summary, our data demonstrate that the NF-κB pathway plays a role in SCD1 deficiency-induced ceramide de novo synthesis in colorectal cancer cells, and that reduced MUFA levels contribute to the course.
Introduction
A key hallmark of cancer cells is their remarkable tendency to reprogram their metabolic capability.Citation1 Several lines of experimental, clinical, and epidemiological evidence highlight the relevance of stearoyl-CoA-desaturase 1 (SCD1) as a key factor in the reprogramming of metabolic and signal transduction events that lead to cancer development.Citation2 SCD1 is a critical enzyme of lipid synthesis that introduces a cis double bond in the Δ-9 position in its substrates, thereby converting palmitic acid (16:0) and stearic acid (18:0) to palmitoleic acid (16:1n7) and oleic acid (18:1n7), respectively.Citation3,Citation4 Aberrant SCD1 activity strongly promotes the conversion of saturated fatty acid (SFA) substrates into monounsaturated fatty acids (MUFAs). High levels of SCD1 and MUFAs are both metabolic signatures of cancers cells.Citation5–7 Furthermore, reduction of SCD1 activity can suppress cancer cell proliferation and induce apoptosis.Citation8,Citation9 In line with these findings, we previously showed that SCD1 levels were high in colorectal cancer tissues in comparison with those in healthy tissues. Blockage of SCD1 stopped colorectal tumor growth, which could be counteracted by supplemental oleate, a representative MUFA.Citation10 A few studies have investigated mechanisms by which SCD1 inhibition might block cancer progression. For example, impairment of SCD1 could promote AMP-activated protein kinase (AMPK) activation, leading to a decrease in Akt phosphorylation and downregulation of the Wnt/β–catenin signaling pathway.Citation11–13 In addition, we previously reported that SCD1 blockage induced apoptosis along with ceramide production in colorectal cancer cells.Citation10 Ceramide is the neutral lipid building block of sphingolipids, which have broad effects on signal transduction and the regulation of cell function. Chief among these effects is the potentiation of signaling cascades that lead to cell death.Citation14 De novo ceramide synthesis is initiated by serine palmitoyl-transferase (SPT), which is rate limiting for sphingolipid synthesis and mainly consists of two different subunits (SPT1 and SPT2) in mammals.Citation15 The sphingoid base produced by SPT is acylated by ceramide synthases 1–6 (CerS1–6) to produce dihydroceramides.Citation14–16 A desaturase step catalyzed by dihydroceramide desaturase completes the ceramide synthesis by the addition of a 4, 5-trans double bond. Several elaborate studies have indicated that ceramide synthesis pathways are relevant to the regulation of responses in cancer cells. Dihydroceramide and ceramide are both produced via the ceramide de novo synthesis pathway. Ceramide has been widely studied for its function in promoting apoptosis, whereas dihydroceramide is considered to be an inactive precursor of ceramide.Citation17–19 Recent studies suggest, however, that dihydroceramides are actively involved in the cell cycle, apoptosis, and autophagy.Citation20
In a previous study, we examined ceramide levels and cell proliferation in cancer cells treated with an SCD1 inhibitor. Although the basal levels of SCD1 enzymatic activity were similar between Colo205 colon cancer cells and SKOV3 ovarian cancer cells, SCD1 inhibition induced ceramide synthesis and apoptosis in the Colo205 cells but not in the SKOV3 cells.Citation10 The reason for the difference in responses to SCD1 inhibition remains unknown. SKOV3 cells have been shown to be resistant to SCD1 inhibition.Citation21 It is reasonable to ask if obstruction of ceramide synthesis is the cause of that resistance.
In recent years, a few correlative studies reported that ceramide de novo biosynthesis was related to the NF-κB signaling pathway. In myotubes, LPS increased mRNA levels of critical enzymes involved in ceramide biosynthesis, whereas in cells expressing kinase-dead IKKβ, which prevents activation of NF-κB signaling, the levels of these transcripts were markedly reduced.Citation22 In macrophages, pharmacological inhibition of NF-κB prevented LPS-induced upregulation of SPT2, whereas transfection with the p65 subunit of NF-κB upregulated SPT2 and increased cellular ceramide levels.Citation23 Although distinct signaling pathways that activate ceramide biosynthesis have been investigated in normal cells, the reasons for increased ceramide synthesis in cancer cells are not clear.
To investigate the underlying signaling changes that induce ceramide de novo synthesis in SCD1-deficient cells, we examined the effects of the SCD1 inhibitor A939572 (A939) on intracellular signaling in cancer cells using RNA sequencing (RNA-seq). The results revealed that the NF-κB signaling pathway was greatly altered in Colo205 cells, but not in SKOV3 cells. These results suggested that NF-κB might be a key factor in SCD1 deficiency-induced ceramide synthesis. Our work is important to depict the cross-talk between the SCD1-mediated lipid pathway and the endo-ceramide biosynthesis pathway in order to shed light on the anticancer mechanism of SCD1 inhibition. It may also open a new window of opportunity for the development of SCD blockers as an alternative treatment for colorectal cancer.
Materials and methods
Chemicals
A939572 was purchased from Abcam (Shanghai, China). Oleate (OA) and palmitate (PA) were obtained from Sangon (Shanghai, China). Internal standards of ceramides and fatty acids were purchased from Avanti (Alabaster, USA). Pyrrolidinedithiocarbamic acid (PDTC), bovine serum albumin (BSA), and other chemicals were purchased from Sigma-Aldrich (Shanghai, China).
Cell culture
Colo205 cells were obtained from ATCC (Rockville, USA) and cultured in Dulbecco’s modified essential medium (DMEM) (Invitrogen, Shanghai, China) supplemented with 10% fetal bovine serum (FBS) (Invitrogen). SKOV3 cells were kindly provided by Dr. Y.B. Mao and cultured in RPMI-1640 medium with 10% FBS at 37°C under 5% CO2.
RNA isolation and real-time quantitative PCR (Q-PCR)
RNA isolation, reverse transcription, and Q-PCR were conducted as previously described.Citation24,Citation25 Briefly, 1 μg total RNA extracted from cells was used to synthesize cDNA. Then, Q-PCR was performed in a 7300 real-time PCR system (Applied Biosystems, CA, USA) using SYBR Premix Ex Taq ™ II TliRnaseH Plus (Takara, Dalian, China). The mRNA expression levels were normalized according to ribosomal RNAs and the housekeeping gene GAPDH. The primers for the target genes are listed in .
Table 1. Primers used in Q-PCR reactions
RNA-seq library preparation
Oligo (dT) magnetic beads were used to select mRNAs by hybridization with DNA probes. The DNA/RNA hybrid strand was then digested, followed by DNase I reaction to remove the DNA probe. The target RNA was then purified, fragmented, and reverse-transcribed to create double-stranded cDNA (dscDNA) using N6 random primers. The dscDNA had a phosphate at the 5ʹ end and a sticky ‘A’ overhang at the 3ʹ end, which was used to ligate it to an adaptor. Two specific primers were then used to amplify the ligation product. The PCR product was then denatured by heat, and the single-stranded DNA was cyclized using a splint oligo and DNA ligase.
High-throughput sequencing and data analysis
The prepared DNA fragments were sequenced using BGISEQ500RNA-Seq with three biological replicates for each cell type and condition. The expression levels of genes were determined using the fragments per kilobase of exon per million fragments mapped (FPKM) method.Citation26 Differentially expressed genes (DEGs) between groups were screened using the NOISeq method.Citation27 For functional classification, all DEGs were mapped to the Kyoto Encyclopedia of Genes and Genomes (KEGG) resource (http://www.genome.jp/kegg/).
Small-interfering RNA (siRNA)
Gene silencing was achieved using siRNA duplex oligonucleotides against the coding sequences of human SCD1 and SPT1 cDNAs (Sangon, Shanghai, China). Two target sequences in SCD1 were used: 5′-AAU GAU CAG AAA GAG CCG UAG-3′ (siRNA-1) and 5′-AAA UCG UCU CCA ACU UAU CUC-3′ (siRNA-2). Three target sequences in SPT1 were used: 5′- CGUAGUGACAUUAAGUUAUUU-3′ (siRNA-1), 5′- GCAGCAGCUUUAGCAUCUCUA-3′ (siRNA-2), and 5′- GCAUGAACAGAAGUAUUGCAU-3′ (siRNA-3). Colo205 cells were transfected with SCD1siRNA (60 pM) or SPT1siRNA (10 nM) using oligofectamine Transfection Reagent (0.3%, v/v; Life Technologies) according to the manufacturer′s instructions. Fresh medium was added 5 h after transfection. The cells were incubated for an additional 72 h after SCD1siRNA transfection and an additional 32 h after SPT1siRNA transfection. Commercial non-targeting siRNA served as an experimental control. The efficiency of gene downregulation by siRNA was demonstrated by western blot.
Lipid extraction and analysis
Lipids were extracted from cells as described previously.Citation28 Briefly, 106 cells were ultrasonicated in a methanol/water mixture (vol/vol, 1/1, 1 ml) containing two internal standards: C17:0 ceramide (100 pmol, internal standard for ceramides) and C17:0 margaric acid (100 pmol, internal standard for fatty acids). The homogenate was extracted with 4 ml chloroform with vortexing for 1 min. The lipid layer was separated from the aqueous layer by centrifugation at 3,000 × g for 10 min, transferred into a clean 10 ml V-bottom glass tube, and dried under nitrogen flow (N2). Then, 1 ml chloroform was added, the dried spot was reconstituted, and solid-phase extraction was performed using a methanol/chloroform mixture (vol/vol, 1/9). The elution containing ceramides and free fatty acids was dried under N2 and reconstituted with 100 µl methanol/chloroform (v/v, 75/25). Then, 10 μl of the elution was used for detection using the 3200 Q TrapLC-MS/MS system (Applied Biosystems, USA) coupled with the 1100-LC system (Agilent, China). The constant mobile phase for free fatty acids consisted of 5 mM ammonium acetate in acetonitrile (solvent A, 65%) and 5 mM ammonium acetate in 2-propanol (solvent B, 35%). Ion detection was monitored in electrospray ionization (ESI) mode. The mobile phase for ceramides consisted of methanol and ultra-pure water (pH 7.4). The gradient elution was as follows: 85% methanol was kept for the first 3 min, followed by a linear gradient from 85% to 100% methanol for 2 min; then, 100% methanol was continued for 15 min. The elution condition was finally returned to 85% methanol at a flow rate of 0.7 ml/min. The column temperature was maintained at 40°C. Ion detection was monitored in APCI+-MRM mode. The Q1/Q3 ion pairs were detected at 254.7/236.9 for C16:0 fatty acids (FA), 269.0/250.9 for C17:0 FA, 252.9/234.9 for C16:1 FA, 283.1/265.0 for C18:0 FA, 280.9/262.9 for C18:1 FA, 520.4/264.2 for C16:0 ceramide (Cer), 534.3/264.2 for C17:0 Cer, 548.4/264.2 for C18:0 Cer, 576.4/264.2 for C20:0 Cer, 604.5/264.2 for C22:0 Cer, and 632.4/264.2 for C24:0 Cer.
Preparation of fatty acid-BSA complexes
A fatty acid-BSA complex solution was prepared as described previously.Citation29 Briefly, fatty acid solution was added dropwise into 10% fatty acids-free BSA to a volume ratio of 1/10 at 55°C. The mixture was vortexed for 10 s, incubated at 55°C for additional 10 min, and sterile filtered before use.
Proliferation assay
The effects of A939, PDTC, and oleate-BSA on cell viability were measured using the Cell Counting Kit-8 (CCK8) (Dojindo Molecular Technologies, Shanghai, China) according to the manufacturer’s instructions. Cells (3,000 cells per well) were seeded on a 96-well plate and treated with drug candidates. After 48 h of culture, 10 μl tetrazolium reagent provided by the kit was added to each well, and the plate was incubated at 37°C for 1 h. Absorbance was then measured at a wavelength of 450 nm using a microplate reader (Beckman, CA, USA). All experiments were performed in triplicate.
Nuclear and cytosolic protein extraction
Colo205 cells were washed in cold PBS and centrifuged at 500 × g at 4°C for 2–3 min. The supernatant was removed, leaving the cell pellet as dry as possible. Then, nuclear and cytosolic protein extraction were performed using NE-PER Nuclear and Cytoplasmic Extraction Reagents (Thermo Scientific, Shanghai, China). Briefly, cold CER © was added to the cell pellet. The tube was vortexed to fully suspend the cell pellet and incubated on ice for 10 min. Cold CER © was added to the tube, and the tube was vortexed on the highest setting and incubated on ice for 1 min. The tube was vortexed again and centrifuged at 16,000 × g for 5 min, after which the supernatant was saved as the cytoplasmic extract. The insoluble (pellet) fraction was suspended in cold NER and vortexed on the highest setting. The sample was then placed on ice and vortexed for 15 s every 10 min, for a total for 40 min. The sample was then centrifuged at 16,000 × g for 10 min, after which the supernatant was saved as the nuclear extract.
Western blot
Cell protein extractions were separated by 10–12% SDS/PAGE and then transferred onto nitrocellulose membranes (Bio-rad, CA, USA). The membranes were blocked with 10% nonfat milk, incubated at 4°C overnight with primary antibodies against phospho-NF-κBp65, NF-κB p65, Histone H3 (all Cell Signaling Technology, Shanghai, China), SCD1, SPT1 (both Sigma-Aldrich, Shanghai, China), and β-actin (Proteintech, Wuhan, China). Secondary antibodies (Multisciences, Hangzhou, China) were applied in accordance with the primary antibodies and incubated at room temperature for 1 h. After washing with 1 × PBS, protein bands were visualized using an Electrochemiluminescence Plus kit (Millipore, MA, USA) and quantified using the Quantity One Software (Bio-Rad).
Statistical analysis
Data values were expressed as the mean ± standard error. Differences between groups were evaluated by Student’s t-test or one-way ANOVA followed by Bonferroni comparisons of all pairs. Statistical analysis was performed using the GraphPad Prism Software (GraphPad Software, CA, USA). P < .05 was used as the threshold for significance.
Results
Variation in free fatty acid contents after A939 treatment in different cancer cells
The intracellular fatty acid contents of cancer cells with different sensitivities to an SCD1 inhibitor were measured by HPLC-MS/MS. Our previous study revealed that the SCD1 inhibitor A939 blocked SCD1 activity in Colo205 and SKOV3 cells in a dose-dependent manner. Furthermore, A939 exhibited dose-dependent anti-proliferation effects on Colo205 cells. Our previous results indicated that 0.2 µM was the appropriate dose of A939 for SCD1 inhibition in Colo205 and SKOV3 cells.Citation10
The total MUFA content of Colo205 cells constantly decreased from 0 h to 48 h after A939 treatment ()), whereas that of SKOV3 cells increased ()). By contrast, the total SFA content hardly changed in Colo205 cells after A939 treatment ()), although it increased slightly in SKOV3 cells ()). These results showed that the effects of the SCD1 inhibitor on fatty acids in the two different types of cancer cells were entirely different. To test the effects of fatty acids on SCD1-inhibited Colo205 cells, we treated the cells with 10 μM oleate (a MUFA) or palmitate (an SFA) after SCD1 inhibition by A939. The results showed that A939-induced inhibition of cell proliferation was reversed by oleate ()), but not by palmitate ()).
Figure 1. Variation in free fatty acid contents after A939 treatment. (a-b) The effects of A939 (0.2 μM) treatment for 12 h and 48 h on the MUFA (a) and SFA (b) contents of Colo205 cells. (c-d) The effects of A939 (0.2 μM) treatment for 12 h and 48 h on the MUFA (c) and SFA (d) contents of SKOV3 cells. (e-f) The effects of oleate (OA, 10 μM) (e) and palmitate (PA, 10 μM) (f) on A939-induced inhibition of cell proliferation 48 h after administration to Colo205 cells. *P < .05, **P < .01, ***P < .001 vs. vehicle group, Student’s t-test, n = 6
SCD1 deficiency activated the NF-κB signaling pathway in Colo205 cells
To examine the changes in intracellular signaling pathways after SCD1 inhibition in Colo205 and SKOV3 cells, we performed comparative gene expression profiling by RNA-seq followed by pathway enrichment analysis of DEGs based on the KEGG database.Citation30 In the Colo205 cells, the pathways with the most DEG enrichment were signal transduction pathways ()). Of the top 20 pathways enriched with DEGs, the NF-κB signaling pathway showed the greatest enrichment (29 DEGs, )), suggesting that NF-κB might contribute to the effects of SCD1 deficiency. The SKOV3 cells showed similarly strong enrichment of DEGs in signal transduction pathways ()), but the NF-κB signaling pathway was not the most highly enriched pathway and had fewer DEGs (9) and a much smaller Rich Factor than it did in the Colo205 cells () and 3(b,c)).
Figure 2. RNA-seq revealed gene expression after A939 treatment in Colo205 cells. (a) KEGG classification of differentially expressed genes (DEGs) 48 h after administration of A939. The x-axis shows the mean number of DEGs. The y-axis shows the second KEGG pathway terms. All second pathway terms were grouped in top pathway terms indicated by different colors. (b) Number of DEGS in the most highly enriched pathways. (c) Statistics of signal transduction pathway enrichment of DEGs. (d) Statistics of lipid metabolism pathway enrichment of DEGs. The Rich Factor is the ratio of DEG numbers annotated with a pathway term to all gene numbers annotated with the same pathway term. A greater Rich Factor means greater alteration of a pathway after SCD1 inhibition. The Q value is a corrected p value ranging from 0 to 1. A smaller Q value means greater alteration of a pathway after SCD1 inhibition
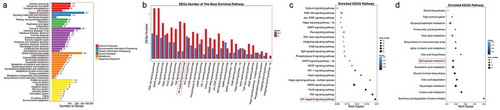
Figure 3. RNA-seq revealed gene expression after A939 treatment in SKOV3 cells. (a) KEGG classification of DEGs 48 h after administration of A939. The x-axis shows the mean number of DEGs. The y-axis shows the second KEGG pathway terms. All second pathway terms were grouped in top pathway terms indicated by different colors. (b) Number of DEGS in the most highly enriched pathways. (c) Statistics of signal transduction pathway enrichment of DEGs. (d) Statistics of lipid metabolism pathway enrichment of DEGs. The Rich Factor is the ratio of DEG numbers annotated with a pathway term to all gene numbers annotated with the same pathway term. A greater Rich Factor means greater alteration of a pathway after SCD1 inhibition. The Q value is a corrected p value ranging from 0 to 1. A smaller Q value means greater alteration of a pathway after SCD1 inhibition
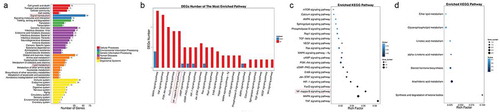
SCD1 is not only a main regulator of cellular fatty acid composition but also a major player in the modulation of lipid synthesis. Therefore, we analyzed DEG enrichment in lipid metabolism pathways.Citation9,Citation12 We found that sphingolipid metabolism was greatly enriched with DEGs in the Colo205 cells ()) but not in the SKOV3 cells ()). Because ceramide is an important member of the sphingolipid class, these results further confirmed our previous report that endo-lipid messenger ceramides play a critical role in the modulation of tumor fate by SCD1 inhibition.
On the basis of the RNA-seq results, we hypothesized that the NF-κB pathway might play a role in the effects of SCD1 deficiency in Colo205 cells. To investigate the possible mechanism, we detected NF-κB activity, which is usually evaluated by measuring the phosphorylation level of the NF-κB p65 protein. We added 0.2 μM A939 to the culture medium of Colo205 cells and collected cells at 0 h, 0.5 h, 1 h, 2 h, 4 h, and 6 h after treatment. We extracted the total proteins from the cells and measured the levels of phosphorylated NF-κB p65 by western blot. The results indicated that A939 increased the level of phosphorylated NF-κB p65 in Colo205 cells from 0.5 h to 2 h after treatment ()). We applied RNA interference to confirm the crosstalk between SCD1 blockage and NF-κB signaling. Transfection with the siRNA inhibited SCD1 protein expression and increased the levels of phosphorylated NF-κB p65 in Colo205 cells ()). To determine if SCD1 inhibition also induces nuclear translocation of NF-κB p65, we incubated Colo205 cells with 0.2 μM A939 for 0.5 h and analyzed the nuclear and cytosolic fractions by western blot. A939 greatly increased the levels of total NF-κB p65 and pNF-κB p65 in the nucleus ()). In the cytosol, the levels of total NF-κB p65 and pNF-κB p65 were correspondingly decreased ()). These result suggested that newly phosphorylated NF-κB p65 was translocated to the nucleus and activated for transcription following A939 treatment.
Figure 4. The effects of A939 on the NF-κB signaling pathway in Colo205 cells. (a) A939 (0.2 μM) induced phosphorylation of NF-κB p65 in Colo205 cells, evaluated by western blot and densitometric quantification. Cells were incubated with A939 for the indicated number of hours. (b-c) SCD1 siRNA transfection induced phosphorylation of NF-κB p65 in Colo205 cells. The protein levels of SCD1 were reduced after the cells were treated with SCD1 siRNA (10 nM) for 48 h, as shown by densitometric quantification (b). The levels of phosphorylated NF-κB p65 were increased after siRNA transfection, as shown by densitometric quantification (c). (d) A939 induced nuclear translocation of NF-κB p65. Colo205 cells were collected 0.5 h after A939 (0.2 μM) treatment. Nuclear and cytosolic fractions were analyzed by western blot. Relative levels of pNF-κB p65 and total NF-κB p65 were normalized to Histone H3 or β-actin. (e) A939 (0.2 μM) induced mRNA expression of inflammatory cytokines in Colo205 cells, as detected by Q-PCR. Cells were incubated with A939 for 48 h. (f) A939 (0.2 μM) did not induce phosphorylation of NF-κB p65 in SKOV3 cells, as evaluated by western blot and densitometric quantification. Cells were incubated with A939 for the indicated number of hours. (g) The mRNA expression levels of inflammatory cytokines in SKOV3 cells after A939 (0.2 μM) treatment for 48 h, as detected by Q-PCR.*P < .05, **P < .01, ***P < .001 vs. vehicle group, Student’s t-test, n = 6
To further investigate the activation of NF-κB, we detected the mRNA levels of inflammatory cytokines involved in the NF-κB signaling pathway by Q-PCR in Colo205 and SKOV3 cells after A939 treatment for 48 h. The NF-κB target genes TNF-α, IL-1β, and IL-8 were significantly upregulated in Colo205 cells after A939 treatment ()), indicating that SCD1 deficiency activated the NF-κB signaling pathway in these cells. By contrast, in SKOV3 cells, the levels of phosphorylated NF-κB p65 were not increased after A939 treatment ()). Although the NF-κB target genes in SKOV3 cells were slightly upregulated, the degree of upregulation was much less than that in Colo205 cells ()), indicating that the NF-κB signaling pathway was not activated by A939 in SKOV3 cells. As our previous work showed that SCD1 inhibition promoted apoptosis in Colo205, but not in SKOV3 cells,Citation10 this provided additional evidence that NF-κB was involved in the apoptosis of cancer cells.
SCD1 deficiency induced ceramide de novo synthesis by upregulating SPT1 and CerS6
Blockage of SCD1 suppresses cell proliferation via effects on cellular ceramide synthesis.Citation10 We examined the effects of SCD1 on endo-ceramides in Colo205 cells by HPLC-MS/MS analysis. The levels of C16:0 ceramide, C18:0 ceramide, C 20:0 ceramide, C22:0 ceramide, and C24:0 ceramide were increased 48 h after A939 treatment, indicating that A939 specifically enhanced the levels of dihydroceramides (). Dihydroceramides, as well as ceramide, are generated via the ceramide de novo synthesis pathway. Previously, we showed that blocking the ceramide de novo synthesis pathway with a SPT inhibitor eliminated endo-ceramide production.Citation10 To determine which subunit of SPT mediates that effect and investigate if other enzymes contribute to ceramide de novo biosynthesis after SCD1 inhibition, we measured the effects of A939 on the transcription levels of enzymes related to ceramide synthesis by Q-PCR. The results revealed that mRNA expression of SPT1 and CerS6 were strongly increased in Colo205 cells 48 h after A939 treatment ()), whereas the expression of CerS1–5 was not induced significantly (Supplementary Figure 1). Western blot analysis showed that the protein levels of SPT1 and CerS6 were consistent with the changes in mRNA levels (–d)). CerS6 specifically synthesizes C16:0 ceramide,Citation31 whereas SPT provides substrate to all CerS enzymes to generate all the physiologic ceramides. We therefore hypothesized that SPT1 was more important than CerS6 for the dihydroceramide accumulation observed in our experiments, because the A939 treatment increased the levels of dihydroceramide species ranging from C16:0 to C24:0. We applied RNA interference to determine if SPT1 silencing would protect the cells from the anti-proliferative effect of A939. We transfected Colo205 cells with SPT1 siRNA (10 nM) for 6 h and then incubated them with 0.2 μM A939 for another 24 h. The results showed that the siRNA inhibited the protein expression of SPT1 and reversed the antiproliferative effect of A939 ()).
Figure 5. PDTC preconditioning reversed A939-induced overexpression of dihydroceramide and inhibition of cell proliferation in Colo205 cells. (a-f) The effect of A939 (0.2 μM) with/without PDTC (30 μM) on the contents of dihydroceramides with various fatty acyl chains. Cells were harvested 48 h after A939 administration. C16:0 ceramide (a), C18:0 ceramide (b), C20:0 ceramide (c), C22:0 ceramide (d), and C24:0 ceramide (e). (f) The effect of A939 (0.2 μM) with/without PDTC on cell proliferation. **P < .01 ***P < .001 vs. vehicle group; ##P < .01, ###P < .001 vs. 0.2 μM A939 group, one-way ANOVA, n = 6
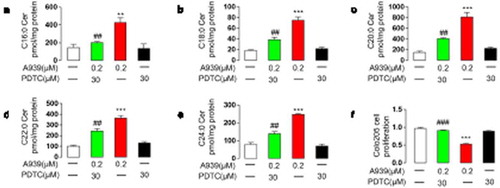
Figure 6. Effects of the NF-κB signaling pathway on A939-induced ceramide de novo synthesis in Colo205 cells. (a) The effects of A939 (0.2 μM) with/without PDTC (30 μM) on the mRNA expression of enzymes involved in ceramide de novo biosynthesis, as detected by Q-PCR. Cells were harvested 48 h after administration of A939. (b-d) The effects of A939 with/without PDTC on the protein levels of CerS6 and SPT1, as evaluated by western-blot. Cells were harvested 48 h after administration of A939 (b). Densitometric quantification (c-d). (e-f) Transfection with SPT1 siRNA affected the inhibition of cell proliferation induced by A939. The protein level of SPT1 was reduced after transfection with SPT1 siRNA2 (10 nM) for 6 h (e). SPT1 siRNA2 transfection reversed the antiproliferative effect of A939. Colo205 cells were co-incubated with 0.2 μM A939 for another 24 h after SPT1 siRNA (10 nM) transfection for 6 h (f). *P < .05, **P < .01, ***P < .001 vs. vehicle group; ##P < .01, ###P < .001 vs. 0.2 μM A939 group, one-way ANOVA, n = 6
The NF-κB signaling pathway plays a role in SCD1 deficiency-induced ceramide de novo synthesis
We used PDTC to determine if NF-κB activation was involved in the dihydroceramide accrual and antiproliferative effects caused by SCD1 inhibition. PDTC is a specific NF-κB inhibitor that is widely used in studies involving NF-κB signaling.Citation32,Citation33 We evaluated gene and protein expression levels by Q-PCR and western blot, respectively, and dihydroceramide contents by HPLC-MS/MS analysis. We also measured cell viability using CCK8. The results showed that 30 μM PDTC eliminated A939-induced overexpression of SPT1 and CerS6 (), elevation of dihydroceramide contents (), and antiproliferative effects ()) in Colo205 cells, suggesting that the NF-κB signaling pathway contributes the upregulation of ceramide de novo synthesis caused by SCD1 deficiency.
Reduced MUFA synthesis contributed to SCD1 inhibition-induced NF-κB activation
SCD1 inhibition decreased MUFA synthesis in Colo205 cells. We therefore asked if the effects of SCD1 inhibition on the NF-κB pathway were related to the reduced MUFA synthesis. To answer that question, we used oleate. First, we applied 30 μM oleate or control BSA to the medium of Colo205 cells and incubated the cells for 1 h. Then, we added 0.2 μM A939 and incubated the cells for another 48 h. The oleate reversed the A939-induced overexpression of SPT1 and CerS6 (), elevation of dihydroceramide contents (), and inhibition of proliferation ()). To determine if preconditioning with oleate could prevent intracellular signaling abnormalities induced by SCD1 inhibition, we incubated Colo205 cells with oleate or BSA for 10 min, 20 min, or 30 min and then with A939 for another 30 min. The oleate prevented A939-induced phosphorylation of NF-κB p65 ()), indicating that reduced MUFA synthesis was critical for NF-κB activation induced by SCD1 inhibition. Together, these results suggested that reduced MUFA levels contributed to the ceramide de novo biosynthesis induced by NF-κB activation.
Figure 7. Oleate preconditioning prevented A939-induced overexpression of ceramide biosynthetic enzymes in Colo205 cells. Oleate (OA) or control BSA was applied to the medium for 1 h before the cells were incubated with A939 for another 48 h. (a) The effect of A939 (0.2 μM) with OA (30 μM) or BSA on the mRNA expression of enzymes involved in ceramide de novo biosynthesis, as detected by Q-PCR. (b-d) The effect of A939 with OA or BSA on the expression of CerS6 and SPT1, as evaluated by western-blot (b) Densitometric quantification (c-d). *P < .05, **P < .01, ***P < .001 vs. vehicle group; ##P < .01, ###P < .001 vs. 0.2 μM A939 group, one-way ANOVA, n = 6
Figure 8. Oleate preconditioning prevented A939-induced overexpression of ceramide, inhibition of cell proliferation, and phosphorylation of NF-κB p65 in Colo205 cells. (a-e) The effect of A939 (0.2 μM) with oleate (OA) (30 μM) or BSA on the contents of endo-ceramides with various fatty acyl chains. OA or control BSA was applied to the medium for 1 h before the cells were incubated with A939 for another 48 h. C16:0 ceramide (a), C18:0 ceramide (b), C20:0 ceramide (c), C22:0 ceramide (d), and C24:0 ceramide (e). (f) The effect of A939 with OA or BSA on cell proliferation. Oleate or control BSA was applied to the medium for 1 h before the cells were incubated with A939 for another 48 h. (g-h) The effect of A939 with OA or BSA on A939-induced phosphorylation of NF-κB p65, as evaluated by western blot. Cells were incubated with oleate or control BSA for 10, 20, and 30 min before incubation with A939 for another 48 h (g). Densitometric quantification (h). **P < .01 ***P < .001 vs. vehicle group; #P < .05, ##P < .01, ###P < .001 vs. 0.2 μM A939 group, one-way ANOVA, n = 6.
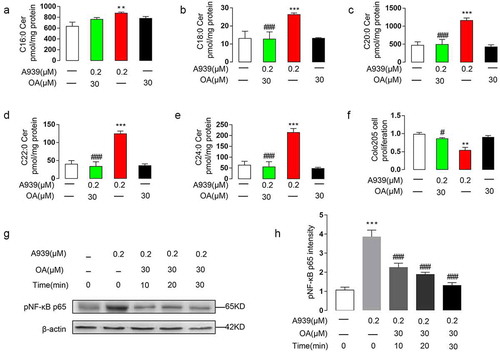
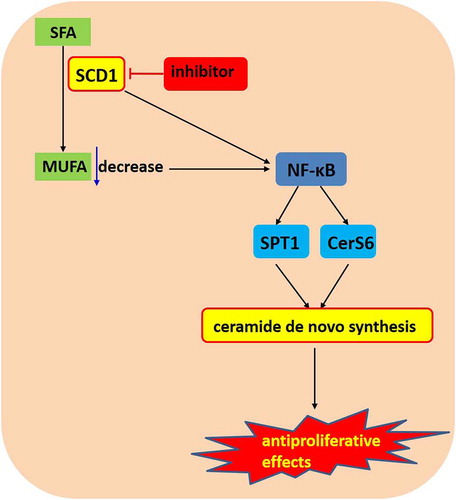
Figure 9. Signaling pathway and interactions downstream of SCD1 inhibitor treatment 20 in Colo205 cells
Discussion
There is growing evidence that SCD1 inhibition can suppress cell growth and induce apoptosis in various human cancers.Citation8 The mechanism by which SCD1 inhibition blocks cancer progression has therefore attracted attention. Our previous study demonstrated that SCD1 deficiency in colon cancer cells promoted apoptosis attributed to mitochondria dysfunction, upregulation of reactive oxygen species, alteration of mitochondrial transmembrane potential, and translocation of the mitochondrial protein cytochrome C, all of which were mediated by ceramide biosynthesis.Citation10 The mechanisms by which SCD1 regulates ceramide production are still unknown, however.
To investigate the possible link between SCD1 deficiency and ceramide synthesis, we performed RNA-seq using two cancer cell lines after A939 treatment. In Colo205 cells, the pathways with the most DEGs after A939 treatment were signal transduction pathways. Among them, the NF-κB signaling pathway had the greatest enrichment of DEGs, suggesting that the underlying signaling changes were relevant to NF-κB. Therefore, we detected the activity of NF-κB and systematically evaluated the role of NF-κB in ceramide synthesis induced by A939 using an NF-κB inhibitor. The results suggested that NF-κB plays a role in the effects of SCD1 deficiency. First, gene silencing or pharmacological inhibition of SCD1 increased phosphorylation of NF-κB p65 and induced its translocation into the nucleus. Second, blockage of SCD1 upregulated the mRNA levels of inflammatory cytokines downstream of the NF-κB signaling pathway. Third, the NF-κB inhibitor eliminated the A939-induced overexpression of CerS6 and SPT1, elevation of dihydroceramide contents, and inhibition of cell proliferation. Finally, in the A939-resistant ovarian cancer cell line SKOV3, NF-κB was not activated by A939. To date, few studies have reported on the relationship between SCD1 and NF-κB. Previous work demonstrated that inhibition of SCD1 could inactivate the NF-κB pathway and impair ovarian cancer cell stemness after 6 days.Citation34 We evaluated the activity of NF-κB for 48 h after SCD1 inhibition in Colo205 cells and found that it was activated from 0.5 h to 2 h after A939 treatment. Our results and the previous results are incomparable, because the tumor cells and the detection times were entirely different. Because the early activation of NF-κB induced ceramide de novo synthesis and suppressed cell proliferation, there was no need for any further detection in Colo205 cells.
Several studies have linked the NF-κB signaling pathway to the regulation of ceramide synthesis. In myotubes, LPS increased RNA levels of critical enzymes involved in ceramide biosynthesis in response to IKKβ, which can activate NF-κB signaling by phosphorylating inhibitors of NF-κB.Citation22 Additionally, in macrophages, inflammatory stimuli upregulated SPT2 and increased cellular ceramide levels via NF-κB.Citation23 These results were generated in normal cells, however, and the activation of NF-κB was not observed directly. The reasons for increased ceramide in cancer cells are still not clear.
NF-κB signaling is a major upstream pathway in cellular apoptosis. Activated NF-κB promotes or suppresses cellular apoptosis, depending on the stimulation conditions.Citation35,Citation36 Constitutive activation of the NF-κB pathway is evident in most tumor cell lines. Aberrant NF-κB activity was found in a number of cancer types, including pancreatic cancer, prostate cancer, gastric carcinoma, renal cancer, Hodgkin’s lymphoma, multiple myeloma, leukemia, and breast cancer.Citation37 Paradoxically, some reports demonstrated that NF-κB was able to promote apoptosis in cancer cells. For example, one study showed that induction of p53 caused NF-κB activation that correlated with the ability of p53 to induce apoptosis in Saos-2 cells, whereas inhibition or loss of NF-κB activity could abrogate p53-induced apoptosis.Citation38 In addition, apoptosis in 293 T cells caused by serum deprivation was associated with NF-κB activation.Citation39 Similarly, our results revealed an unexpected pro-apoptotic activity after SCD1 blockage in colon cancer cells. Thus, along with a few other studies, our results provide a contrast to the large body of research demonstrating pro-survival effects of NF-κB in cancer cells, showing that NF-κB activation is a double-edged sword to the fate of tumor cells.
We found that the effects of SCD1 inhibition on fatty acids were not the same in different types of cancer cells. In Colo205 cells, although the absolute MUFA contents were much less than the absolute SFA contents, SCD1 inhibition caused a greater change in the MUFA contents than in the SFA contents. That suggested that the main effect of SCD1 inhibition on fatty acids in Colo205 cells was suppression of MUFA synthesis. On the other hand, SCD1 inhibition caused the SFA contents of SKOV3 cells to increase, but the change did not affect cell proliferation. Therefore, we hypothesized that the decrease in MUFAs, but not the increase in SFAs, might be involved in the antiproliferative course in cancer cells after SCD1 inhibition. Proliferation assays showed that oleate could reverse the inhibition of cell proliferation, whereas palmitate could not, which confirmed our hypothesis. MUFAs are more preferred substrates than SFAs for lipid biosynthesis.Citation40 Constitutively activated SCD1 produced abundant MUFAs as substrates for the biosynthesis of phospholipids needed for the unremitting membrane biogenesis in rapidly replicating cells. Selective starvation of cancer cells can selectively inhibit cancer cell proliferation, thus delaying or suppressing tumor growth.Citation41 SCD1 inhibition starved the Colo205 cells of MUFAs, inhibiting proliferation. We used oleate to demonstrate that reduced MUFA levels were involved in NF-κB activation in Colo205 cells. By contrast, in SKOV3 cells, total MUFA levels were not decreased by SCD1 inhibition, so cell proliferation was not affected and NF-κB was not activated, which might explain why SKOV3 cells showed an opposite response to SCD1 deficiency compared with Colo205 cells.
According to our RNA-seq results, other pathways were also highly activated by SCD1 inhibition in Colo205 cells, such as the TNF signaling pathway, the FoxO signaling pathway, and the MAPK signaling pathway. Because PDTC did not eliminate A939-induced changes completely, we hypothesized that the A939-induced changes were partly dependent on the NF-κB signaling pathway. We will explore whether other pathways are involved in the effects of SCD1 inhibition in future studies.
In summary, we investigated the linkage between cellular SCD1 deficiency and ceramide de novo synthesis. The results revealed that NF-κB was involved in the effects of SCD1 inhibition, including dihydroceramide accumulation and suppression of cancer cell proliferation via the upregulation of SPT1 and CerS6. Furthermore, reduced MUFA synthesis contributed to these effects (). Our findings indicated that the NF-κB pathway might play a role in SCD1 deficiency-induced ceramide de novo synthesis, shedding light on the anticancer mechanism of SCD1 inhibition.
Supplemental Material
Download MS Word (98.6 KB)Acknowledgments
We thank Mr. Wenliang Deng (Information & Network Services of Xiamen university) for computer technology support.
Supplementary material
Supplemental data for this article can be accessed on the publisher’s website.
Additional information
Funding
References
- Kalyanaraman B, Cheng G, Hardy M, Ouari O, Lopez M, Joseph J, Zielonka J, Dwinell MB. A review of the basics of mitochondrial bioenergetics, metabolism, and related signaling pathways in cancer cells: therapeutic targeting of tumor mitochondria with lipophilic cationic compounds. Redox Biol. 2018;14:316–327. doi:10.1016/j.redox.2017.09.020.
- Igal RA. Stearoyl CoA desaturase-1: new insights into a central regulator of cancer metabolism. Biochim Biophys Acta. 2016;1861:1865–1880. doi:10.1016/j.bbalip.2016.09.009.
- Landry F, Chan CC, Huang Z, Leclair G, Li CS, Oballa R, Zhang L, Bateman K. Plasma-based approach to measure target engagement for liver-targeting stearoyl-CoA desaturase 1 inhibitors. J Lipid Res. 2011;52:1494–1499. doi:10.1194/jlr.M013177.
- MacDonald ML, Singaraja RR, Bissada N, Ruddle P, Watts R, Karasinska JM, Gibson WT, Fievet C, Vance JE, Staels B, et al.. Absence of stearoyl-CoA desaturase-1 ameliorates features of the metabolic syndrome in LDLR-deficient mice. J Lipid Res. 2008;49:217–229. doi:10.1194/jlr.M700478-JLR200.
- Von Roemeling CA, Marlow LA, Radisky DC, Rohl A, Larsen HE, Wei J, Sasinowska H, Zhu H, Drake R, Sasinowski M, et al.. Functional genomics identifies novel genes essential for clear cell renal cell carcinoma tumor cell proliferation and migration. Oncotarget. 2014;5:5320–5334. doi:10.18632/oncotarget.2097.
- Roongta UV, Pabalan JG, Wang X, Ryseck RP, Fargnoli J, Henley BJ, Yang WP, Zhu J, Madireddi MT, Lawrence RM, et al.. Cancer cell dependence on unsaturated fatty acids implicates stearoyl-CoA desaturase as a target for cancer therapy. Mol Cancer Res. 2011;9:1551–1561. doi:10.1158/1541-7786.Mcr-11-0126.
- Peck B, Schug ZT, Zhang Q, Dankworth B, Jones DT, Smethurst E, Patel R, Mason S, Jiang M, Saunders R, et al.. Inhibition of fatty acid desaturation is detrimental to cancer cell survival in metabolically compromised environments. Cancer Metab. 2016;4:6. doi:10.1186/s40170-016-0146-8.
- Hao M, Mukherjee S, Sun Y, Maxfield FR. Effects of cholesterol depletion and increased lipid unsaturation on the properties of endocytic membranes. J Biol Chem. 2004;279:14171–14178. doi:10.1074/jbc.M309793200.
- Scaglia N, Igal RA. Stearoyl-CoA desaturase is involved in the control of proliferation, anchorage-independent growth, and survival in human transformed cells. J Biol Chem. 2005;280:25339–25349. doi:10.1074/jbc.M501159200.
- Chen L, Ren J, Yang L, Li Y, Fu J, Li Y, Tian Y, Qiu F, Liu Z, Qiu Y. Stearoyl-CoA desaturase-1 mediated cell apoptosis in colorectal cancer by promoting ceramide synthesis. Sci Rep. 2016;6:19665. doi:10.1038/srep19665.
- Scaglia N, Chisholm JW, Igal RA. Inhibition of stearoylCoA desaturase-1 inactivates acetyl-CoA carboxylase and impairs proliferation in cancer cells: role of AMPK. PloS One. 2009;4:e6812. doi:10.1371/journal.pone.0006812.
- Scaglia N, Igal RA. Inhibition of Stearoyl-CoA Desaturase 1 expression in human lung adenocarcinoma cells impairs tumorigenesis. Int J Oncol. 2008;33:839–850. doi:10.3892/ijo_00000072.
- Lin SY, Xia W, Wang JC, Kwong KY, Spohn B, Wen Y, Pestell RG, Hung MC. Beta-catenin, a novel prognostic marker for breast cancer: its roles in cyclin D1 expression and cancer progression. Proc Natl Acad Sci U S A. 2000;97:4262–4266. doi:10.1073/pnas.060025397.
- Morad SA, Cabot MC. Ceramide-orchestrated signalling in cancer cells. Nat Rev Cancer. 2013;13:51–65. doi:10.1038/nrc3398.
- Weiss B, Stoffel W. Human and murine serine-palmitoyl-CoA transferase–cloning, expression and characterization of the key enzyme in sphingolipid synthesis. Eur J Biochem. 1997;249:239–247. doi:10.1111/j.1432-1033.1997.00239.x.
- Levy M, Futerman AH. Mammalian ceramide synthases. IUBMB Life. 2010;62:347–356. doi:10.1002/iub.319.
- Hannun YA, Obeid LM. Ceramide: an intracellular signal for apoptosis. Trends Biochem Sci. 1995;20:73–77. doi:10.1016/s0968-0004(00)88961-6.
- Zheng QY, Jin FS, Yao C, Zhang T, Zhang GH, Ai X. Ursolic acid-induced AMP-activated protein kinase (AMPK) activation contributes to growth inhibition and apoptosis in human bladder cancer T24 cells. Biochem Biophys Res Commun. 2012;419:741–747. doi:10.1016/j.bbrc.2012.02.093.
- Ji C, Yang B, Yang YL, He SH, Miao DS, He L, Bi ZG. Exogenous cell-permeable C6 ceramide sensitizes multiple cancer cell lines to Doxorubicin-induced apoptosis by promoting AMPK activation and mTORC1 inhibition. Oncogene. 2010;29:6557–6568. doi:10.1038/onc.2010.379.
- Li FF, Liu N, Liu W, Li M, Zhang F, Dong Z, Zhang JL, Sun H. Role of dihydroceramides in the progression of acute-on-chronic liver failure in rats. Chin Med J (Engl). 2020;133:198–204. doi:10.1097/cm9.0000000000000601.
- Mason P, Liang B, Li L, Fremgen T, Murphy E, Quinn A, Madden SL, Biemann HP, Wang B, Cohen A, et al. SCD1 inhibition causes cancer cell death by depleting mono-unsaturated fatty acids. PloS One. 2012;7:e33823. doi:10.1371/journal.pone.0033823.
- Holland WL, Bikman BT, Wang LP, Yuguang G, Sargent KM, Bulchand S, Knotts TA, Shui G, Clegg DJ, Wenk MR, et al. Lipid-induced insulin resistance mediated by the proinflammatory receptor TLR4 requires saturated fatty acid-induced ceramide biosynthesis in mice. J Clin Invest. 2011;121:1858–1870. doi:10.1172/jci43378.
- Chang ZQ, Lee SY, Kim HJ, Kim JR, Kim SJ, Hong IK, Oh BC, Choi CS, Goldberg IJ, Park TS. Endotoxin activates de novo sphingolipid biosynthesis via nuclear factor kappa B-mediated upregulation of Sptlc2. Prostaglandins Other Lipid Mediat. 2011;94:44–52. doi:10.1016/j.prostaglandins.2010.12.003.
- Sadowski MC, Pouwer RH, Gunter JH, Lubik AA, Quinn RJ, Nelson CC. The fatty acid synthase inhibitor triclosan: repurposing an anti-microbial agent for targeting prostate cancer. Oncotarget. 2014;5:9362–9381. doi:10.18632/oncotarget.2433.
- Peter A, Weigert C, Staiger H, Machicao F, Schick F, Machann J, Stefan N, Thamer C, Häring HU, Schleicher E. Individual stearoyl-coa desaturase 1 expression modulates endoplasmic reticulum stress and inflammation in human myotubes and is associated with skeletal muscle lipid storage and insulin sensitivity in vivo. Diabetes. 2009;58:1757–1765. doi:10.2337/db09-0188.
- Mortazavi A, Williams BA, McCue K, Schaeffer L, Wold B. Mapping and quantifying mammalian transcriptomes by RNA-Seq. Nat Methods. 2008;5:621–628. doi:10.1038/nmeth.1226.
- Tarazona S, Garcia-Alcalde F, Dopazo J, Ferrer A, Conesa A. Differential expression in RNA-seq: a matter of depth. Genome Res. 2011;21:2213–2223. doi:10.1101/gr.124321.111.
- Bligh EG, Dyer WJ. A rapid method of total lipid extraction and purification. Can J Biochem Physiol. 1959;37:911–917. doi:10.1139/o59-099.
- Cousin SP, Hügl SR, Wrede CE, Kajio H, Myers MG Jr., Rhodes CJ. Free fatty acid-induced inhibition of glucose and insulin-like growth factor I-induced deoxyribonucleic acid synthesis in the pancreatic beta-cell line INS-1. Endocrinology. 2001;142:229–240. doi:10.1210/endo.142.1.7863.
- Robinson MD, Oshlack A. A scaling normalization method for differential expression analysis of RNA-seq data. Genome Biol. 2010;11:R25. doi:10.1186/gb-2010-11-3-r25.
- Turpin SM, Nicholls HT, Willmes DM, Mourier A, Brodesser S, Wunderlich CM, Mauer J, Xu E, Hammerschmidt P, Brönneke HS, et al. Obesity-induced CerS6-dependent C16:0 ceramide production promotes weight gain and glucose intolerance. Cell Metab. 2014;20:678–686. doi:10.1016/j.cmet.2014.08.002.
- Cai L, Wang Z, Meyer JM, Ji A, van der Westhuyzen DR. Macrophage SR-BI regulates LPS-induced pro-inflammatory signaling in mice and isolated macrophages. J Lipid Res. 2012;53:1472–1481. doi:10.1194/jlr.M023234.
- Francioli C, Wang X, Parapanov R, Abdelnour E, Lugrin J, Gronchi F, Perentes J, Eckert P, Ris HB, Piquilloud L, et al. Pyrrolidine dithiocarbamate administered during ex-vivo lung perfusion promotes rehabilitation of injured donor rat lungs obtained after prolonged warm ischemia. PloS One. 2017;12:e0173916. doi:10.1371/journal.pone.0173916.
- Li J, Condello S, Thomes-Pepin J, Ma X, Xia Y, Hurley TD, Matei D, Cheng J-X. Lipid desaturation is a metabolic marker and therapeutic target of ovarian cancer stem cells. Cell Stem Cell. 2017;20:303–314. doi:10.1016/j.stem.2016.11.004.
- Oh SR, Sul OJ, Kim YY, Kim HJ, Yu R, Suh JH, Choi HS. Saturated fatty acids enhance osteoclast survival. J Lipid Res. 2010;51:892–899. doi:10.1194/jlr.M800626.
- Qi R, Huang J, Wang Q, Liu H, Wang R, Wang J, Yang F. MicroRNA-224-5p regulates adipocyte apoptosis induced by TNFα via controlling NF-κB activation. J Cell Physiol. 2018;233:1236–1246. doi:10.1002/jcp.25992.
- Fouani L, Kovacevic Z, Richardson DR. Targeting oncogenic nuclear factor Kappa B signaling with redox-active agents for cancer treatment. Antioxid Redox Signal. 2018;30:1096–1123. doi:10.1089/ars.2017.7387.
- Ryan KM, Ernst MK, Rice NR, Vousden KH. Role of NF-kappaB in p53-mediated programmed cell death. Nature. 2000;404:892–897. doi:10.1038/35009130.
- Grimm S, Bauer MK, Baeuerle PA, Schulze-Osthoff K. Bcl-2 down-regulates the activity of transcription factor NF-KB induced upon apoptosis. J Cell Biol. 1996;134:13–23. doi:10.1083/jcb.134.1.13.
- Li LO, Klett EL, Coleman RA. Acyl-CoA synthesis, lipid metabolism and lipotoxicity. Biochim Biophys Acta. 2010;1801:246–251. doi:10.1016/j.bbalip.2009.09.024.
- Kalyanaraman B. Teaching the basics of cancer metabolism: developing antitumor strategies by exploiting the differences between normal and cancer cell metabolism. Redox Biol. 2017;12:833–842. doi:10.1016/j.redox.2017.04.018.