
ABSTRACT
Monoclonal gammopathy of undetermined significance (MGUS) represents the pre-clinical stage of Multiple Myeloma (MM) with the 5% of MGUS progresses to MM. Although the progression from MGUS to MM has not been completely characterized, it is possible to monitor the DNA modifications of patients diagnosed with MGUS to detect early specific genomic abnormalities, including copy number variations (CNV). The CNVs of chromosome 1q and chromosome 13q are associated with a worse prognosis in MM.
In the present study, we showed that it is possible to monitor the 1q21 gain and 13q deletion frequencies in gDNA using digital PCR. The CNV analysis of three cell lines with a well-characterized cytogenetic profile were compared with measures performed by a real-time PCR approach and with a digital PCR approach. Then, we analyzed CNVs in CD138+ plasma cells isolated from bone marrow of MGUS and MM patients.
Our results show that digital PCR and targeted DNA monitoring represent a specific and accurate technique for the early detection of specific genomic abnormalities both in MM and in MGUS patients.
Our results could represent a remarkable advancement in MM and MGUS diagnosis and in CNV analysis for the evaluation of the risk of progression from MGUS to MM.
KEYWORDS:
Introduction
Multiple myeloma (MM) is a tumor of terminally differentiated B-lymphocytes, also indicated as plasma cells. MM is the second most common hematologic malignancy and one of the leading causes of death in the field of hematology,Citation1 often due to end organ damageCitation2,Citation3 and infections.Citation4,Citation5 MM represents the final stage in a continuum of plasma cell dyscrasias and is consistently preceded by a premalignant phase termed Monoclonal Gammopathy of Undetermined Significance (MGUS).Citation6,Citation7 The molecular abnormalities underlying three distinct steps of myeloma development are: (1) transformation of normal plasma cells to MGUS, (2) progression of MGUS to MM, and (3) the final evolution to extramedullary diseases (EMDs).Citation8–10 The very first phase in the progression from MGUS to MM is a central node into the pathogenesis of MM, because it represents the transition from a nonmalignant condition to an oncologic state. The rate of patients that progress from MGUS to MM is approximately 1%/year.Citation6,Citation11 This progression appears to be principally driven via branching clonal evolution wherein the spontaneous acquisition of new genetic abnormalities imparted a growth advantage to one subclone at the expense of others without any external selective pressure from treatment.Citation12,Citation13 The copy number variations (CNV) are one of the most prominent genomic perturbations in MM. A recent study created a model representing the chronology of copy number alterations (CNAs) in MM.Citation14,Citation15 In this timeline, chromosome 1q gains and 13q deletions are common cytogenetic aberrations in multiple myeloma (MM) that arise at an intermediate phase of MGUS-MM progression. The presence of these cytogenetic aberrations in newly diagnosed MM is almost 50% for 13q deletions and 1q gains. Particularly, chromosome 1q gains are associated with a worse outcome in MM. The presence of the 13q deletion has a deleterious effect on the prognosis due to its frequent association with the t(4;14) and del(17p) abnormalities.Citation12 These data suggest that the CNV analysis could be a predictive tool in the management of MGUS and in the evaluation of the risk of progression from MGUS to MM.Citation14,Citation16 Accurate and sensitive detection tools are needed to investigate the CNV, such as cytogenetics and fluorescent in situ hybridization (FISH). Real-time PCR (RT-PCR) has previously been used to quantitate CNVs by comparing the dose–response of a CNV to a copy invariant gene (as reference) but CNV assays used with the classical RT-PCR require stringent optimization, calibration, quality control, and a high amount of technical replicate to obtain precise CNV estimates. Here, we propose a new and different approach to identify CNV in MGUS and MM patients using the Digital PCR (dPCR), an end-point PCR method that provides a direct molecular count of the analyte and reference target DNA sequences.Citation17 Here, we present the validation of a dPCR protocol for the analysis of four different CNVs, targeting two different cytobands in chromosome 1q and chromosome 13q regions of MGUS and MM patients.
Results
DNA quantity assessment
In DNA extraction from myeloma cell lines, the starting number of cells were at least 500000 cells and the total yield of DNA ranking from 118 ng/µl to 355 ng/ µl, with a mean value of 203.6 ± 67.02 ng/ µl (mean ± SEM). In DNA extraction from CD138+ cells isolated from bone marrow, we had a dramatic decrease of the starting number of cells, with an average number of CD138+ cells of approximately 50000 cells. Consequently, the total yield of DNA in our samples is ranking from 12 ng/µl to 30 ng/µl, with a mean value of 23.02 ± 1.68 ng/µl (mean ± SEM).
CNV analysis in myeloma cell lines characterized by FISH and comparison between RT-PCR and dPCR
In order to investigate the accuracy of dPCR for CNV measurement, we used three myeloma cell lines with different CNV as a model of gene amplification. These cell lines had been previously characterized for 1q21 and 13q CNVs by FISH. We performed CNV analysis in 1q21 and 13q on RPMI 8226, U266, and JJN3 myeloma cell line by qPCR and dPCR. All the loci were successfully amplified by both techniques in all the three cell lines.
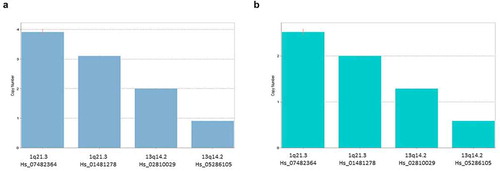
In RT-PCR, we found that results could vary depending on the calibrator sample chosen by the user. In fact, the Copy Call software for the RT-PCR requires at least one available sample with known copy number. Then, the software scales all the results on the basis of this calibrator. Analyzing our samples, we found that the results can be very different choosing one sample or another as the calibrator. Indeed, the same samples could be called to have different CNV profiles simply by changing the calibrator sample (). This can lead to invalid results. In addition, using a starting amount of DNA less than 25 ng, RT-PCR gave us nonreliable results.
Figure 1. CopyCaller example of analysis of Copy Number Variants (CNVs) with a RT-PCR approach. In this approach, the way to calculates CNVs varies depending on the availability of a calibrator sample that has a known copy number for the target of interest. As shown in A and B panels, the results of our analysis for U266 MM cell line substantially changed copy numbers by using different calibrator samples. This represented a limitation in the use of RT-PCR technique applied to CNV analysis in our samples
In dPCR, we found that RPMI8226 did not present significant CNV; JJN3 and U266 showed gain in 1q21 regions and loss in 13q regions (). The results obtained from dPCR were quantitative and absolute, and do not need external calibrator. For each copy number analysis, the exact number of copies/microliter for target sequence (FAM) and reference sequence (VIC) is reported (). The reference is obtained by amplification of RNAse P gene. The ratio between these two data defines the loss or gain in the specific region; dPCR results are overlapping with results obtained by FISH characterization of the RPMI8226, JJN3, and U266 cell lines.Citation18–21
Figure 2. QuantStudio 3D Analysis Suite software example of a chip analysis for Copy Number Variants (CNVs). (a) The chip view allowed to have a chip overview and set a data point above the threshold, which corresponded to the quality of the chip. The scatter plot showed a good separation between the negative and positive results The final analysis of data gave as a result the exact number of copy/uL of the target in the samples. CNV gain or deletion is determined by a ratio of the number of copies of target nucleic acid sequence (FAM) to the reference sequence (VIC) (b). CNV analysis in MM cell lines reveals the absence of both 1q21 and 13q alterations in RPMI8226, while JJN3 and U266 cells reveals gain in 1q21 regions and loss in 13q regions
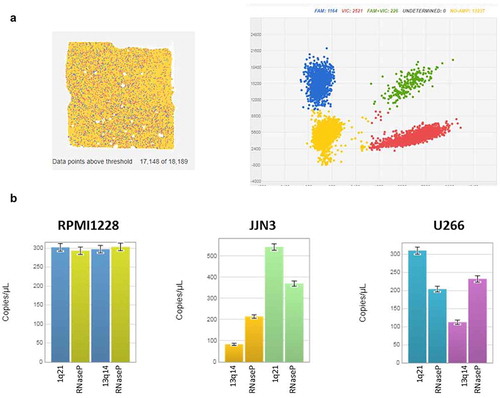
In addition, dPCR provided reliable results also for assays with only 10 ng. The dPCR enabled us to confirm the normal biallelic results in RPMI cell line; the gain in 1q21 regions in JJN3 and U266 and the loss in 13q regions in U266 and JJN3 cell lines are shown in .
CNV analysis in MGUS and MM patients
CNV in 1q21 and 13q were assessed using dPCR in 8 MGUS and 10 MM patients. We observed that only one MGUS patient presented gain of both 1q21 regions, while 7 MGUS samples did not present any alteration in the analyzed regions. Among MM patients, five samples did not present alteration within the analyzed regions. Gain in 1q21 regions was present in three samples, whereas four samples presented loss in 13q regions ().
Table 1. Clinical characteristics of patients with Multiple Myeloma (MM)
Table 2. Digital PCR results for 13q deletion and 1q gain in CD138+ plasma cells from 8 monoclonal gammopathy of undetermined significance (MGUS) and 10 Myeloma Multiple (MM) patients
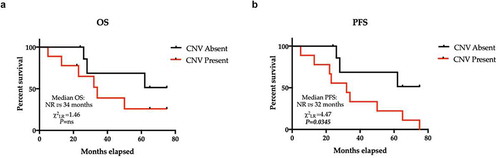
We then evaluated the relationship between the presence and distribution of 1q21 and 13q CNVs and the overall survival (OS) and progression-free survival (PFS) in the analyzed patients’ sample. Notably, OS and PFS were shorter in patients with the analyzed CNVs than in patients without the studied molecular alterations, with a statistically significant difference only for PFS (P = .0345). Median OS and PFS were 34 months and 32 months, respectively, whereas median OS and PFS in patients without alterations were not reached ().
Figure 3. Kaplan-Meier estimator of OS and PFS across the entire cohort recoded into subgroups identified by the presence or absence of CNVs. (a) The median OS estimated in subjects without CNVs was not reached, whereas in subjects with CNVs, the median OS was 34 months. P ns (not significant). The median PFS estimated in subjects without CNV was not reached, whereas in subjects with CNVs, the median OS was 32 months (HR = 3.45, 95% CI 1.09–10.9, χ2LR = 4.47; P = .00345). Hazard Ratio – HR; CNVs – Copy Number Variants
Next with the aim to further validate the clinical significance of analyzed CNV, we interrogated a public dataset of 718 out of 1154 newly diagnosed MM (NDMM) patients enrolled in the the Multiple Myeloma Research Foundation (MMRF) CoMMpass trial NCT01454297 for which the 1q21 and 13q14 CNVs data assessed by SeqFISH were available. The main demographic variables and treatment information for NDMM cohorts are summarized in Table S1.
Comparing two different cohorts, based on survival outcome (alive vs. dead for OS and progressed vs. ongoing for PFS) performing a supervised analysis based on 1q21, 13q14, and 13q34 CNV. Strikingly, these class boundaries identified significantly different clinical outcomes: remarkably, patients with either were 1q21, 13q14, or 13q34 CNV detected all experienced a shorter PFS and OS (). The response duration to treatment deemed significantly shorter in subject with detected 1q21 CNV (Hazard Ratio – HR 1.22; P = .0017 – ).
Table 3. CNV summary comparison between survival characteristics from 718 patients divided in CNV Detected vs. Not Detected from CoMMpass longitudinal, prospective observational study (release IA15). OS is overall survival and PFS is progression-free survival
These results confirm the importance of the possibility given by dPCR to monitor CNV evolution in MGUS and MM patients through a simple fast and absolute methodology.
Discussion
MM and its premalignant condition MGUS are characterized by a genomic complexity and heterogeneity. Tracing the clonal composition over the time requires many laboratory efforts, including a combination of whole-exome sequencing, copy number profiling, and cytogenetics.Citation22 Such approach may represent the key to predict the time of progression from MGUS to MM, but in the routine clinical practice, this represents an unmet challenge. One of the major limitations in the assessment of genetic profile and risk in MGUS and MM patients lies in the low number of plasma cells isolated from bone marrow samples, associated with a very low yield of DNA, which makes difficult to perform FISH- or DNA-based assays, as real-time RT-PCR, microarray or multiplex ligation-dependent probe amplification (MLPA).Citation23 CNVs represent a crucial event in the progression from MGUS to MM and in the malignancies of MM. Among the cytogenetic abnormalities in MM, 1q21 gain and 13q deletion frequency in newly diagnosed MM is almost 35–40% and 45–50%, respectively, and both alterations are associated with an adverse prognostic impact.Citation23
In the last years, it showed the evidence of the existence of patients with partial or global deletion of chromosome 13 having an event-free median survival of 21 months and an overall survival of 29 months, compared to 43 months and 50 months, respectively, of patients without these abnormalities.Citation24 Chromosome alterations of chromosome 1 have been identified more recently,Citation25 uncovering chromosome 1q21 gains to be a high-risk feature in MM, irrespective from the therapeutic approach.Citation26,Citation27 Moreover, since chromosome 1q gains and 13q deletions are common cytogenetic aberrations in MM that arise at an intermediate phase of MGUS-MM progression,Citation28 while considering the relevant incidence of these CNV,Citation6 we measured the 1q21 gain and 13q deletion frequencies in gDNA of three cell lines with a well cytogenetic profile characterized by FISH,Citation19,Citation29 comparing a RT-PCR approach with a dPCR approach. The previous characterization of genetic risk and R-ISS of MM patients by FISH allowed us to validate the results of the dPCR.
FISH represent the gold standard for genetic risk assessment for NDMMCitation17 while no analysis is often performed in MGUS patients, due to the cost and time that this technique required. Moreover, CNV identification is more challenging as the target DNA is more diluted or the tumor cells are poorly represented. Consequently, a tumor-associated CNV increase would be undetectable using conventional routinely approaches.Citation30 RT-PCR is the most used method for the detection of genetics and epigenetics alteration in clinical research.Citation31 However, due to the presence of samples with low amount of starting material, a major number of replicates are required in order to decrease the variability of each reaction and to increase the reproducibility of the results. The amount of DNA required for RT-PCR represented a huge limitation in our experimental settings, and this is the reason why we performed RT-PCR in myeloma cell lines but not in clinical samples from MGUS and MM patients. Another important limitation in RT-PCR is the need of a calibrator sample of CNV analysis that can heavily affect the final results in qPCR. In our study, we assessed CNV analysis using 3-MM cell lines with a well-known cytogenetics for the analyzed regionsCitation18–21 and we found a very huge discrepancy in results using qPCR, depending on the calibrator sample choice and the interpretation of data.
Digital PCR is a robust PCR technique that enables precise and accurate absolute quantitation of target molecules using both dilution and partition of the samples into numerous compartments and Poisson statistics.Citation32,Citation33 Usually, dPCR employs the same primer sets, fluorescent labels, and enzymatic reagents as for RT-PCR ,offering a highly precise and sensitive approach.Citation33 Several studies reported that dPCR is a very promising assay for CNV analysis in diluted samples.Citation30,Citation34 Particularly, the comparison between dPCR and RT-PCR for CNV analysis using the same gDNA template was reported to lead to similar results. A CNV ratio of 1.17 was significantly detected with only 0.6 ng of DNA as input, vs a significant ratio of 1.27 or more significant different in RT-PCR analysis. The ability of dPCR to detect incrementally smaller fold differences than RT-PCR demonstrates the potential of this method for future CNV clinical diagnostics.Citation30
In the present study, we measured the 1q21 gain and 13q deletion frequencies in gDNA of CD138+ plasma cells (PCs) isolated from bone marrow of MGUS and MM patients. Due to the yield of gDNA obtained from PCs, we were able to perform dPCR only RT-PCR, so we cannot compare results from these two techniques. However, the positive correlation between RT-PCR and dPCR results demonstrated that dPCR could successfully be applied to CNV analysis of CNV in myeloma cell lines and patient samples and offered advantages such as a low gDNA input and no need of replicates for each assay. In PCs DNA samples, dPCR allowed us to discriminate CNV ratio from 0.88 to 1.38 using RNase P as reference gene. Despite this study has a clear limitation due to the small sample size, we could confirm previous findings.Citation33–37 Moreover, envisioning a potential role of dPCR in MM risk stratification, we validated our results by in silico interrogation of CoMMpass Trial. Therefore, we could confirm that our findings are consistent with the compelling data generated by the statistically powered CoMMpass trial.
To date, an increasing number of manuscripts encourage the use of dPCR in cancer diseases, included hematological diseases.Citation33 Our results offer a first evidence of dPCR application for the study of genetic alterations occurring in MGUS and MM. The real advantage of dPCR will probably emerge in the next years with the consolidation of the concept of dPCR as a new diagnostic tool.
Further statistically powered clinical study are needed to provide deeper and robust corroboration of this proof of concept finding.
Materials and methods
Sample collection
Myeloma cell lines RPMI 8226, JJN3, and U266 were available in our cell repositories and were provided by ATCC. Patient bone marrow samples were obtained from 18 patients with diagnosed monoclonal gammopathies. Patients were classified as having MGUS (n = 8) or symptomatic MM (n = 10) according to the International Myeloma Working Group criteria.Citation38
CD138+ plasma cells were collected from patients diagnosed with MGUS or MM. Sampling of bone marrow consisted of aspiration followed by biopsy of the posterior iliac crest. Clinical laboratory testing included HLA typing for all patients. Chromosomal alterations (CA) were evaluated by the presence of del17p and/or the presence of t(14:4) or t(14:16) translocation by fluorescence in situ hybridization (FISH) analysis for all MM patients and were used to evaluate genetic risk and R-ISS. The genetic risk of our patients was defined as standard risk (absence of CA, 6/10 patients) or high risk (presence of CA, 4/10 patients). Revised Multiple Myeloma International Staging System (R-ISS) is a prognostic tool based on the combination of three parameters: ISS (International Staging System), Chomosomal Alteration (CA), and serum LDH level.Citation39,Citation40 In our cohort of patients, 1/10 were scored as R-ISS stage 1 (ISS stage I and standard-risk CA by iFISH and normal LDH), 6/10 were scored as R-ISS stage 2 (Not R-ISS stage I or III), and 3/10 were scored as R-ISS stage 3 (ISS stage III and either high-risk CA by iFISH or high LDH). The main demographic and clinical variables of MM cohorts are summarized in .
The study protocol was approved by the University of Bari Medical School Ethics Committee (study n° 5145) and conformed to the good clinical practice guidelines of the Italian Ministry of Health. Written informed consent was obtained from each subject in accordance with the Declaration of Helsinki.
Cell preparation and DNA extraction
Myeloma cell lines and bone marrow mononuclear cells were isolated by Ficoll-Paque Plus (GE Healthcare Life Sciences, Pittsburgh, PA, USA) density gradient centrifugation. Tumor plasma cells were purified from bone marrow by automated magnetic sorting using anti-CD138 microbeads (MACS; MiltenyiBiotec, Bergisch Gladbach, Germany), as previously described.Citation41–43 DNA was isolated from CD138+ plasma cells using QIAamp DNA Blood Midi Kit (Qiagen Srl, Hilden, Germany), following the manufacturer’s instructions, and DNA concentration was measured by Nanodrop (Thermo Scientific, Waltham, MA, USA).
Real-Time PCR (RT-PCR)
Individual CNV assays were performed by duplex Taqman real-time RT-PCR assays on myeloma cell line samples. For DNA detection, primers were designed to generate amplicons under 150 bp. The following TaqMan probes (Life Technologies, Carlsbad, CA, USA) with a 5ʹ fluorophore (6-carboxyfluorescein (6-FAM)) or 2′-chloro-7′phenyl-1,4-dichloro-6-carboxy-fluorescein (VIC)) and a 3ʹ non-fluorescent quencher (NFQ) were used to detect CN assays allocated in or close to 13q and 1q21 regions:
(a)Cytoband 13q14.2: Hs_02810029_cn
(b)Cytoband 13q14.2: Hs_05286105_cn
(c)Cytoband 1q21.3: Hs_01481278_cn
(d)Cytoband 1q21.3: Hs_07482364_cn
RNaseP (TaqMan copy number reference assay) was used as a reference gene. All primers and probes were supplied from Applied Biosystems (Life Technologies), and duplex qPCR assays were performed according to the TaqMan copy number assay protocol (Applied Biosystems). For each reaction, 30 ng of DNA were used (up to 4 µl) and all reactions were performed in triplicate wells and repeated twice. All data were further analyzed using the CopyCaller software version 2.0 (Applied Biosystems). The software generates raw copy values (RCVs) that represent a non-integer number of copies calculated, whereas predicted copy number (PCN) is defined as an integer number of copy determined by the algorithm (0, 1, 2 or 3+). We established a cutoff for the CNV value to classify gain or loss by RT-PCR: copy number gain is defined as PCN>2, whereas copy number loss is defined as PCN<2.
Digital PCR (dPCR)
dPCR reactions were performed using the QuantStudio 3D Digital PCR System (Applied Biosystems) according to the manufacturer’s protocol. Briefly, 16 µL of mastermix solution was prepared, and 14.5 µL was loaded onto the chip containing 8 µL of 2x QuantStudio 3D Digital PCR Master Mix v2, RNase P Reference Assay and relevant TaqMan® probes at 250 nM each (Applied Biosystems), 12 ng of gDNA template (up to 4 µL), and nuclease-free water.
The amount of gDNA to be loaded on the chip usually contains 200–2,000 copies/µL in the final dPCR reaction mix so that each reaction well in the chip receives, on average, 0.6–1.6 copies of the target sequence. Adjustment for input gDNA may be required depending on the copy number of the target of interest.
The reaction mix (15 µL out of 16 µL) was loaded onto the QuantStudio 3D digital PCR chips by using QuantStudio 3D digital PCR chip loader. The amplification conditions for all samples were: 96℃ × 10 min; 60℃ × 2 min; 98℃ × 30 s, 39 cycles; 60℃ × 2 min. The amplifications were performed in a ProflexTM 2x Flat PCR System. The chips were transferred to a QS3D Instrument for imaging. Data elaboration was executed using the cloud-based QuantStudio 3D Analysis Suite software (version 3.0.03) in the absolute quantification module maintaining automatic settings. For each run, at least one NTC was included. The quality threshold was set at the default value of 0.5, to define the accepted wells and ranged from 10,518 to 18,608 with a mean of 15,000.
In silico analysis
In silico analysis was performed from the CoMMpass study dataset: for further validation in a larger NDMM patient cohort, the public data set from the CoMMpass longitudinal, prospective observational study (release IA14) was interrogated, provided by the Multiple Myeloma Research Foundation and downloaded from https://research.mmrf.org. The public CoMMpass data set of the CNV data from 718 NDMM patients was analyzed and the cohort was stratified depending on the outcome (progression-free survival – PFS and overall survival – OS status). Expression profiles in patients who progressed or died were compared with those of patients who did not. The dataset interrogation and the relative clinical information analysis were generated as part of the Multiple Myeloma Research Foundation Personalized Medicine Initiative.
Statistical analysis
A chi-square test was used to determine survival curve analysis. Differences were considered to be statistically significant for values of p < .05. Analyses were carried out using GraphPad software.
Author contributions
F. S., C. C., and A.G. S. planned the research, coordinated the study, designed and performed most experiments, analyzed the respective data and drafted the manuscript. P. L. and P. P. participated in the design of the study and assisted in vitro experiments; A. V. and L. G. participated in the coordination of the study and assisted in manuscript preparation; A. G. and V. R. designed and supervised the research and drafted the manuscript; and all authors read and approved the final manuscript.
Acknowledgments
The authors acknowledge the Multiple Myeloma Research Foundation for providing an updated and comprehensive real-life MM dataset for the international scientific community. The in silico analysis and the relative clinical correlation were generated as part of the Multiple Myeloma Research Foundation Personalized Medicine Initiative (https://research.themmrf.org/rp/terms).
Disclosure Statement
No potential conflicts of interest were disclosed.
Additional information
Funding
References
- Furukawa Y, Kikuchi J. Molecular basis of clonal evolution in multiple myeloma. Int J Hematol. 2020;111:496–511. doi:10.1007/s12185-020-02829-6.
- Mohty M, Cavo M, Fink L, Gonzalez-mcquire S, Leleu H, Mateos MV, Raab MS, Schoen P, Yong K. Understanding mortality in multiple myeloma: findings of a European retrospective chart review. Eur J Haematol. 2019;103:107–115. doi:10.1111/ejh.13264.
- Bringhen S, Mateos MV, Zweegman S, Larocca A, Falcone AP, Oriol A, Rossi D, Cavalli M, Wijermans P, Ria R, et al. Age and organ damage correlate with poor survival in myeloma patients: meta-analysis of 1435 individual patient data from 4 randomized trials. Haematologica. 2013;98:980–987. doi:10.3324/haematol.2012.075051.
- Vacca A, Melaccio A, Sportelli A, Solimando AG, Dammacco F, Ria R. Subcutaneous immunoglobulins in patients with multiple myeloma and secondary hypogammaglobulinemia: a randomized trial. Clin Immunol. 2018;191:110–115. doi:10.1016/j.clim.2017.11.014.
- Blimark C, Holmberg E, Mellqvist UH, Landgren O, Bjorkholm M, Hultcrantz M, Kjellander C, Turesson I, Kristinsson SY. Multiple myeloma and infections: a population-based study on 9253 multiple myeloma patients. Haematologica. 2015;100:107–113. doi:10.3324/haematol.2014.107714.
- van Nieuwenhuijzen N, Spaan I, Raymakers R, Peperzak V. From MGUS to multiple myeloma, a paradigm for clonal evolution of premalignant cells. Cancer Res. 2018;78:2449–2456. doi:10.1158/0008-5472.CAN-17-3115.
- Pérez-Persona E, Mateo G, García-Sanz R, Mateos MV, De Las Heras N, De Coca AG, Hernández JM, Galende J, Martín-Nuñez G, Bárez A, et al. Risk of progression in smouldering myeloma and monoclonal gammopathies of unknown significance: comparative analysis of the evolution of monoclonal component and multiparameter flow cytometry of bone marrow plasma cells. Br J Haematol. 2010;148:110–114. doi:10.1111/j.1365-2141.2009.07929.x.
- Musto P, Pietrantuono G, Guariglia R, Villani O, Martorelli MC, D’Auria F, Zonno A, Lerose R. Salvage therapy with lenalidomide and dexamethasone in relapsed primary plasma cell leukemia. Leuk Res. 2008;32:1637–1638.
- Da Vià MC, Solimando AG, Garitano‐Trojaola A, Barrio S, Munawar U, Strifler S, Haertle L, Rhodes N, Teufel E, Vogt C, et al. CIC mutation as a molecular mechanism of acquired resistance to combined BRAF‐MEK inhibition in extramedullary multiple myeloma with central nervous system involvement. Oncologist. 2020;25:112–118. doi:10.1634/theoncologist.2019-0356.
- Frassanito MA, Desantis V, Di Marzo L, Craparotta I, Beltrame L, Marchini S, Annese T, Visino F, Arciuli M, Saltarella I, et al. Bone marrow fibroblasts overexpress miR-27b and miR-214 in step with multiple myeloma progression, dependent on tumour cell-derived exosomes. J Pathol. 2019;247:241–253. doi:10.1002/path.5187.
- Solimando AG, Da Vià MC, Cicco S, Leone P, Di Lernia G, Giannico D, Desantis V, Frassanito MA, Morizio A, Delgado Tascon J, et al. High-risk multiple myeloma: integrated clinical and omics approach dissects the neoplastic clone and the tumor microenvironment. J Clin Med. 2019;8:997. doi:10.3390/jcm8070997.
- Morgan GJ, Walker BA, Davies FE. The genetic architecture of multiple myeloma. Nat Rev Cancer. 2012;12:335–348. doi:10.1038/nrc3257.
- Bolli N, Avet-Loiseau H, Wedge DC, Van Loo P, Alexandrov LB, Martincorena I, Dawson KJ, Iorio F, Nik-Zainal S, Bignell GR, et al. Heterogeneity of genomic evolution and mutational profiles in multiple myeloma. Nat Commun. 2014;5:2997.
- Aktas Samur A, Minvielle S, Shammas M, Fulciniti M, Magrangeas F, Richardson PG, Moreau P, Attal M, Anderson KC, Parmigiani G, et al. Deciphering the chronology of copy number alterations in Multiple Myeloma. Blood Cancer J. 2019;9(4):39.
- Terragna C, Martello M, Durante S, Pantani L, Zamagni E, Tacchetti P, Brioli A, Perrone G, Zannetti BA, Borsi E, et al. High number of copy number alterations and over-expression of genes involved in the response mechanisms to genotoxic stress both characterize newly diagnosed Multiple Myeloma (MM) patients carrying amplified MDM4 and/or deleted p53. Blood. 2011;118: 3935–3935. doi:10.1182/blood.V118.21.3935.3935.
- Bustoros M, Mouhieddine TH, Detappe A, Ghobrial IM. Established and novel prognostic biomarkers in Multiple Myeloma. Am Soc Clin Oncol Educ B. 2017;37:548–560. doi:10.1200/EDBK_175175.
- Chillón MC, Jiménez C, García-Sanz R, Alcoceba M, Prieto I, García-Alvarez M, Antón A, Maldonado R, Hernández-Ruano M, González M, et al. Quantitative PCR: an alternative approach to detect common copy number alterations in multiple myeloma. Ann Hematol. 2017;96:1699–1705. doi:10.1007/s00277-017-3083-x.
- Fernando RC, de Carvalho F, Mazzotti DR, Evangelista AF, Braga WM, de Lourdes Chauffaille M, Leme AF, Colleoni GW. Multiple Myeloma Cell Lines and Primary Tumors Proteoma: Protein Biosynthesis and Immune System as Potential Therapeutic Targets. Genes Cancer. 2015;6:462.
- Quentmeier H, Pommerenke C, Dirks WG, Eberth S, Koeppel M, MacLeod RAF, Nagel S, Steube K, Uphoff CC, Drexler HG. panel: 100 cell lines for blood cancer studies. Sci Rep. 2019;9. DOI:10.1038/s41598-019-44491-x.
- Hanamura I. Gain/amplification of chromosome arm 1q21 in multiple myeloma. Cancers (Basel). 2021;13:1–16. doi:10.3390/cancers13020256.
- Fernando RC, de Carvalho F, Mazzotti DR, Evangelista AF, Tobias Braga WM, de L Chauffaille M, Paes Leme AF, Colleoni GWB. Multiple Myeloma Cell Lines and Primary Tumors Proteome: Protein Biosynthesis and Immune System as Potential Therapeutic Targets. Genes Cancer. 2015;6:462–471.
- Bolli N, Biancon G, Moarii M, Gimondi S, Li Y, de Philippis C, Maura F, Sathiaseelan V, Tai YT, Mudie L, et al. Analysis of the genomic landscape of multiple myeloma highlights novel prognostic markers and disease subgroups. Leukemia. 2018;32:2604–2616. doi:10.1038/s41375-018-0037-9.
- Saxe D, Seo EJ, Bergeron MB, Han JY. Recent advances in cytogenetic characterization of multiple myeloma. Int J Lab Hematol. 2019;41:5–14. doi:10.1111/ijlh.12882.
- Shaughnessy J, Tian E, Sawyer J, Bumm K, Landes R, Badros A, Morris C, Tricot G, Epstein J, Barlogie B. High incidence of chromosome 13 deletion in multiple myeloma detected by multiprobe interphase FISH. Blood. 2000. doi:10.1182/blood.V96.4.1505.
- Balcárková J, Urbánková H, Ščudla V, Holzerová M, Bačovský J, Indrák K, Jarošová M. Gain of chromosome arm 1q in patieznts in relapse and progression of multiple myeloma. Cancer Genet Cytogenet. 2009;192:68–72. https://www.cancergeneticsjournal.org/article/S0165-4608(09)00146-0/fulltext.
- An G, Xu Y, Shi L, Shizhen Z, Deng S, Xie Z, Sui W, Zhan F, Qiu L. Chromosome 1q21 gains confer inferior outcomes in multiple myeloma treated with bortezomib but copy number variation and percentage of plasma cells involved have no additional prognostic value. Haematologica. 2014;99:353–359. http://www.haematologica.org/content/99/2/353.long.
- Schmidt TM, Barwick BG, Joseph N, Heffner LT, Hofmeister CC, Bernal L, Dhodapkar MV, Gupta VA, Jaye DL, Wu J, et al. Gain of chromosome 1q is associated with early progression in multiple myeloma patients treated with lenalidomide, bortezomib, and dexamethasone. Blood Cancer J. 2019;9. https://pubmed.ncbi.nlm.nih.gov/31767829/.
- Morgan GJ, Walker BA, Davies FE. The genetic architecture of multiple myeloma. Nat Rev Cancer. 2012;12:335–348. http://www.nature.com/articles/nrc3257.
- Hanamura I, Stewart JP, Huang Y, Zhan F, Santra M, Sawyer JR, Hollmig K, Zangarri M, Pineda-Roman M, Van Rhee F, et al. Frequent gain of chromosome band 1q21 in plasma-cell dyscrasias detected by fluorescence in situ hybridization: incidence increases from MGUS to relapsed myeloma and is related to prognosis and disease progression following tandem stem-cell transplantatio. Blood. 2006;108:1724–1732. doi:10.1182/blood-2006-03-009910.
- Whale AS, Huggett JF, Cowen S, Speirs V, Shaw J, Ellison S, Foy CA, Scott DJ. Comparison of microfluidic digital PCR and conventional quantitative PCR for measuring copy number variation. Nucleic Acids Res. 2012;40:e82–e82. doi:10.1093/nar/gks203.
- Perkins G, Lu H, Garlan F, Taly V. 2017. Droplet-based digital PCR: application in cancer research. In: Advances in clinical chemistry. Academic Press Inc; p. 43–91.
- Kanagal-Shamanna R. Digital PCR: principles and applications.Methods Mol Biol. 2016;1392:43–50. doi:10.1007/978-1-4939-3360-0_5.
- Cilloni D, Petiti J, Rosso V, Andreani G, Dragani M, Fava C, Saglio G. Digital PCR in myeloid malignancies: ready to replace quantitative PCR? Int J Mol Sci. 2019;20. DOI:10.3390/ijms20092249.
- Weaver S, Dube S, Mir A, Qin J, Sun G, Ramakrishnan R, Jones RC, Livak KJ. Taking qPCR to a higher level: analysis of CNV reveals the power of high throughput qPCR to enhance quantitative resolution. Methods. 2010;50:271–276. doi:10.1016/j.ymeth.2010.01.003.
- López-Corral L, Sarasquete ME, Beà S, García-Sanz R, Mateos MV, Corchete LA, Sayagués JM, García EM, Bladé J, Oriol A, et al. SNP-based mapping arrays reveal high genomic complexity in monoclonal gammopathies, from MGUS to myeloma status. Leukemia. 2012;26:2521–2529. doi:10.1038/leu.2012.128.
- Elnenaei MO, Hamoudi RA, Swansbury J, Gruszka-Westwood AM, Brito-Babapulle V, Matutes E, Catovsky D. Delineation of the minimal region of loss at 13q14 in multiple myeloma. Genes Chromosom Cancer. 2003;36:99–106. doi:10.1002/gcc.10140.
- Rajan AM, Rajkumar SV. Interpretation of cytogenetic results in multiple myeloma for clinical practice. Blood Cancer J. 2015;5. DOI:10.1038/bcj.2015.92.
- Rajkumar SV, Dimopoulos MA, Palumbo A, Blade J, Merlini G, Mateos MV, Kumar S, Hillengass J, Kastritis E, Richardson P, et al. International Myeloma Working Group updated criteria for the diagnosis of multiple myeloma. Lancet Oncol. 2014;15:e538–48. doi:10.1016/S1470-2045(14)70442-5.
- Palumbo A, Avet-Loiseau H, Oliva S, Lokhorst HM, Goldschmidt H, Rosinol L, Richardson P, Caltagirone S, José Lahuerta J, Facon T, et al. Revised international staging system for multiple myeloma: a report from international myeloma working group. J Clin Oncol. 2015; 33:2863–2869.
- Greipp PR, Miguel JS, Dune BGM, Crowley JJ, Barlogie B, Bladé J, Boccadoro M, Child JA, Harousseau JL, Kyle RA, et al. International staging system for multiple myeloma. J Clin Oncol. 2005;23:3412–3420. doi:10.1200/JCO.2005.04.242.
- Solimando AG, Da Vià MC, Leone P, Borrelli P, Croci GA, Tabares P, Brandl A, Di Lernia G, Bianchi FP, Tafuri S, et al. Halting the vicious cycle within the multiple myeloma ecosystem: blocking JAM-A on bone marrow endothelial cells restores the angiogenic homeostasis and suppresses tumor progression. Haematologica. 2021 Jul 1;106(7):1943–1956. doi:10.3324/haematol.2019.239913
- Leone P, Di Lernia G, Solimando AG, Cicco S, Saltarella I, Lamanuzzi A, Ria R, Frassanito MA, Ponzoni M, Ditonno P, et al. Bone marrow endothelial cells sustain a tumor-specific CD8+ T cell subset with suppressive function in myeloma patients. Oncoimmunology. 2019;8. DOI:10.1080/2162402X.2018.1486949.
- Lamanuzzi A, Saltarella I, Desantis V, Frassanito MA, Leone P, Racanelli V, Nico B, Ribatti D, Ditonno P, Prete M, et al. Inhibition of mTOR complex 2 restrains tumor angiogenesis in multiple myeloma. Oncotarget. 2018. doi:10.18632/oncotarget.25003.