
ABSTRACT
PARP1 and Chk1 inhibitors have been shown to be synergistic in different cancer models in relatively short time treatment modes. However, the consequences of long-term/repeated treatments with the combinations in cancer models remain unclear. In this study, the synergistic cytotoxicity of their combinations in 8 tumor cell lines was confirmed in a 7-day exposure mode. Then, pancreatic Capan-1 cells were repeatedly treated with the PARP1 inhibitor olaparib, the Chk1 inhibitor rabusertib or their combination for 211–214 days, during which the changes in drug sensitivity were monitored at a 35-day interval. Unexpectedly, among the 3 treatment modes, the combination treatments resulted in the highest-grade resistance to Chk1 (~14.6 fold) and PARP1 (~420.2 fold) inhibitors, respectively. Consistently, G2/M arrest and apoptosis decreased significantly in the resulting resistant variants exposed to olaparib. All 3 resistant variants also unexpectedly obtained enhanced migratory and invasive capabilities. Moreover, the combination treatments resulted in increased migration and invasion than olaparib alone. The expression of 124 genes changed significantly in all the resistant variants. We further demonstrate that activating CXCL3-ERK1/2 signaling might contribute to the enhanced migratory capabilities rather than the acquired drug resistance. Our findings indicate that repeated treatments with the rabusertib/olaparib combination result in increased drug resistance and a more aggressive cell phenotype than those with either single agent, providing new clues for future clinical anticancer tests of PARP1 and Chk1 inhibitor combinations.
Introduction
Inhibition of poly(ADP-ribose) polymerase 1 (PARP1) was found to specifically kill BRCA1/2-deficient cancer cells in 2005.Citation1,Citation2 Since then, four PARP1 inhibitors, i.e., olaparib, rucaparib, niraparib and talazoparib, have been approved successively for monotherapy or maintenance in ovarian, breast and pancreatic cancer.Citation3–5 Most recently, olaparib has been reported to significantly prolong progression-free survival (PFS) in metastatic castration-resistant prostate cancer in a phase 3 trial.Citation6 More PARP1 inhibitors are at different stages in preclinical and clinical tests.Citation4,Citation7–15 Targeting PARP1 in homologous recombination repair (HRR) deficient cancers is highly attractive for anticancer drug development. However, even in patients with HRR-deficient cancer, PARP1 inhibitor monotherapy only results in a limited objective response rate (≤ 50% in most cases) and overall survival (undefined in most cases) though it achieves significant progression-free survival.Citation3–6 PARP1 inhibitor resistance has been reported in both preclinical and clinical studies.Citation3–5,Citation16–21 Currently, PARP1 inhibitors alone are primarily used in HRR-deficient cancers with relatively low incidence, further limiting their anticancer application.Citation4,Citation22 All of these factors drive continuous investigation of PARP1 inhibitor combination therapy.
Among other things, checkpoint kinase 1 (Chk1) inhibitors have been proposed to be promising candidates for PARP1 inhibitor combination therapy.Citation22–24 Mechanistically, inhibition of Chk1 impairs S and G2/M checkpoints, thus preventing DNA repair and increasing DNA damage, which might potentially enhance the therapeutic effects of PARP1 inhibitors.Citation22–24 In fact, several Chk1 inhibitors (e.g., rabusertib, MK-8776 and prexasertib) in combination with different PARP1 inhibitors (e.g., olaparib, talazoparib and rucaparib) showed significant synergistic anticancer effects in vitro and in vivo in various cancer models including pancreatic,Citation25 breast,Citation25–29 ovarian,Citation28,Citation30,Citation31 and gastricCitation32 cancer models. More interestingly, the above synergistic effects also occurred in an olaparib-resistant ovarian cancer PDX model.Citation31 The importance of such combination therapies is further strengthened by the observation of little or no anticancer effect of Chk1 inhibitors alone in patients.Citation24 Notably, however, the time of drug exposure in all studies was relatively short (i.e., 1–6 days for in vitro cytotoxicity assays,Citation25–27,Citation29–31 1–14 days for colony formation assaysCitation28–30,Citation32 and 16–42 days for in vivo models.Citation28,Citation30–32) Drugs for cancer therapy in the clinic generally require repeated administration for a much longer time or even lifetime. Therefore, more knowledge about the consequences of long-term treatments with PARP1 and Chk1 inhibitor combinations in cancer models is urgently needed.
As one of the deadliest cancers, pancreatic cancer lacks effective treatment.Citation5 Olaparib is the only PARP1 inhibitor approved for the treatment of pancreatic cancer to date.Citation5 As a selective Chk1 inhibitor, rabusertib (RT; LY2603618) is the only Chk1 inhibitor evaluated for pancreatic cancer in a phase II study.Citation24,Citation33 In this study, we first confirmed the synergistic effects in vitro of rabusertib and two PARP1 inhibitors, olaparib and talazoparib, in eight cancer cell models following seven days exposure, similarly to previous reports.Citation25–27,Citation29–31 Then we repeatedly treated the Capan-1 cell line, one of the most extensively used pancreatic cancer cell lines, with rabusertib, olaparib or both for a total exposure of 211–214 days. During this period, we monitored the changes in drug sensitivity. Compared to the single-agent treatment, unexpectedly, repeated treatment with the rabusertib/olaparib combination led to increased drug resistance, migration and invasion in the resulting cells. Mechanistically, activation of CXCL3-ERK1/2 signaling might contribute to the enhanced capabilities of migration in these resulting cells rather than acquired drug resistance.
Materials and methods
Drugs, reagents, and antibodies
Olaparib and talazoparib were purchased from Selleck Chemicals (Shanghai, China). Doramapimod, LY3214996, MK-2206 2HCl, MK-8776, rabusertib, SCH772984 and ulixertinib were purchased from MedChem Express (Shanghai, China). All drugs were dissolved in dimethyl sulfoxide (DMSO), aliquoted, stored at −20°C, and diluted to the desired concentrations in normal saline immediately prior to each experiment. The final DMSO concentration did not exceed 0.1%.
Propidium iodide (PI) and RNase A were from Beyotime (Shanhhai, China). All other chemical reagents were from Sigma (St. Louis, MO, USA). Primary antibodies against Akt (#4691), p-S473-Akt (#4060), p-S345-Chk1 (#2348), ɣH2AX (#2577), Caspase 3 (#9662), Caspase 7 (#4790), Caspase 8 (#4790), Caspase 9 (#9502), S6 (#2217), p-S235/S236-S6 (#4858), A-Raf (#4432), p-S71-A-Raf (#4431), p38 (#9212), p-T180/Y182-p38 (#4511), ERK1/2 (#9102), p-T202/Y204-ERK1/2 (#4370), p-S63-c-Jun (#9261), MKK3 (#8535), p-S189-MKK3 (#9236), PI3K/p85 (#4257), p-Y458-PI3K/p85 (#4228), p90RSK (#9355), p-T359/S363-p90RSK (#9344), MMP2 (#4022), MMP9 (#3852), ZEB1 (#3396), Slug (#9585), Src (#2109), p-Y416-Src (#6943), p-S2448-mTOR (#5536) and Vimentin (#5741) were from Cell Signaling Technology (Danvers, MA, USA). Primary antibodies against Chk1 (sc-8408), PARP1 (sc-7150), PARP2 (sc-30,622), PARG (sc-398,563), P-gp (sc-13,131), JNK (sc-571), p-T183/Y185-JNK (sc-6254), c-Jun (sc-1694), Rac1 (sc-217), p-S299-Rac1 (sc-135,641), PKCβI (sc-8049), PKCβII (sc-13,149), MEK1 (sc-252), p-T1402-MEK1 (sc-130,202), mTOR (sc-1549), N-cadherin (sc-7939) and E-cadherin (sc-7870) from Santa Cruz Biotechnology (Santa Cruz, CA, USA). Primary antibodies against FAK (ab40794), p-Y397-FAK (ab24781) and p-T500-PKCβI/II (ab5817) from Abcam (Cambridge, UK); PARP3 (NBP2–49,523) from Novus (Novus Biologicals, CO, USA); and GAPDH (AG019) from Beyotime (Shanghai, China).
Cell lines
Human cancer Capan-1, HCT-15, MDA-MB-436, PC-3, RD-ES, SK-ES-1, UWB1.289 and KB cell lines were purchased from the American Type Culture Collection (ATCC, Manassas, VA). U251 cells were acquired from the Institute of Cell Biology (Shanghai, China). KB/VCR cells were obtained from Sun Yat-Sen University of Medical Sciences (Guangzhou, China). All cells were cultured according to the suppliers’ instructions.
Rabusertib (RT)-resistant (Capan-1/RT) cells were generated by treating Capan-1 cells with 0.8 μM rabusertib. Olaparib (OP)-resistant (Capan-1/OP) cells were generated by the administration of gradually increasing concentrations of olaparib (0.5, 1, 2, 4, 8, and 16 μM; equivalent to 0.125, 0.5, 1, 2, 4, and 8 × IC50 of olaparib in the parental Capan-1 cells, respectively). Similarly, rabusertib/olaparib-resistant (Capan-1/OP+RT) cells were established by treating Capan-1 cells with 0.8 μM rabusertib and increasing concentrations of olaparib as described for Capan-1/OP cells. After incubation of the cells with the indicated agent(s) for 35 days (defined as 1st cycle), dead cells were discarded, and surviving cells were allowed to recover in drug-free medium until reaching at least 70% confluence between treatment intervals. Then, cells were repeated treated with a higher concentration for another 35 days (2nd cycle). After repeated treatments with the indicated agent(s) for 6 cycles (approximately 211–214 days), 3 resistant variants were obtained and cultured in drug-free medium.
Cytotoxicity assays
Cell Counting Kit-8 (CCK-8) assay and sulforhodamine B (SRB) assay were used to measure the cytotoxicity as described previously.Citation10 Cells were seeded into 96-well plates (Capan-1 800 cells per well, HCT-15 600 cells per well, MDA-MB-436 5000 cells per well, UWB1.289 2800 cells per well, RD-ES 6000 cells per well, SK-ES-1 8000 cells per well, U251 2000 cells per well, and PC-3 1200 cells per well), cultured overnight and treated with gradient concentrations of the tested drugs alone or in combination with indicated anticancer drugs for 7 days. Next, the cell survival rate was measured using Cell Counting Kit-8 (CCK-8; Dojindo Laboratories, Kumamoto, Japan) assay (MDA-MB-436) or sulforhodamine B (SRB; Sigma, St. Louis, MO, USA) assay (all the other cells). The results were recorded using a SpectraMax190 Microplate Reader (Molecular Devices, San Jose, CA, USA). The proliferative inhibition rate (%) was calculated as: [1-(A450treated/A450control)] × 100% for CCK-8 assays or [1-(A560treated/A560control)] × 100% for SRB assays. The average IC50 values were determined using the Logit method and are presented as mean ± SD from three independent tests.
The synergistic effects between both drugs were calculated using CalcuSyn software which employs the Chou-Talalay equation, taking into account both the potency (IC50) and shape of the dose-effect curve. A combination index (CI) < 0.8 indicates synergism, CI = 0.8–1.2 indicates additive effects, and CI > 1.2 indicates antagonism.Citation34
Cell cycle assay
Cell cycle arrest was analyzed by propiduim iodide (PI)-staining-based flow cytometry as previously described.Citation9,Citation35,Citation36 Cells (4 × 10⁵ cells per well) treated with olaparib for 48 h were collected and washed with PBS and then fixed with pre-cooled 70% ethanol in PBS for 4 h at 4°C. After that, cells were incubated with 40 μg/ml RNase A at 37°C and 10 μg/ml propiduim iodide (PI) in the dark for 10 min. At least 1 × 10⁴ cells per sample were analyzed using a FACS Calibur (BD Biosciences, Franklin Lakes, NJ).
Annexin V-FITC apoptosis detection
Cell apoptosis was analyzed by Annexin V-FITC and PI costaining-based flow cytometry as previously described.Citation9,Citation35,Citation36 3 × 10⁵ cells treated with olaparib for 72 h were collected and washed with PBS and then co-stained with Annexin V-FITC and PI using a detection kit (Keygen, Nanjing, China) as indicated. The fluorescence of at least 1 × 10⁴ cells per sample was immediately detected and recorded on a FACS Calibur (BD Biosciences, Franklin Lakes, NJ).
Western blotting analysis
Standard Western blotting was performed as previously described.Citation9,Citation35–37 Briefly, cells were lysed with 100 μL of 1× SDS-PAGE protein loading buffer and boiled for 10 min. Equal protein loads, from all samples used in a given experiment, were resolved by SDS-PAGE on 7.5%-12% acrylamide gels (Bio-Rad Laboratories Inc., Hercules, CA, USA) at 150 volts for 1 h, and transferred to nitrocellulose (NC) membranes (GE Healthcare, Waukesha, WI, USA). After blocking with 5% nonfat milk (Becton Dickinson Labware, MA, USA) in TBS-T (TBS, 0.2% Tween-20), the membranes were incubated with specific indicated primary antibody dilutions according to the manufacturer’s instruction at room temperature for 2 h or at 4°C overnight. Upon washing with TBS-T, the membranes were then incubated with 1: 2000 diluted horseradish peroxidase (HRP)-conjugated secondary antibody (Jackson ImmunoResearch Laboratories Inc., West Grove, PA, USA) at room temperature for 1 h. Finally, chemiluminiscence was detected using a ChemiDoc MP Imaging System (Bio-Rad Laboratories Inc., Hercules, CA, USA).
Cell migration and invasion assays
These assays were performed to detect cell mobility in vitro, as reported in our previous studies.Citation18,Citation35 For the Transwell migration assay, cells (5 × 10⁵ cells per well) in serum-free Iscove’s Modified Dulbecco’s medium (IMDM) containing the indicated concentrations of the tested drugs were added into the upper compartment of the chamber. The lower compartment contained IMDM medium supplemented with 20% fetal bovine serum (FBS). After 24 h incubation at 37°C, the cells remaining on the upper face of the Transwell membrane were removed using a cotton swab. The migrated cells on the lower side were fixed with 90% ethanol and stained with 0.1% crystal violet in 0.1 M borate and 2% ethanol (pH9.0). After the images were acquired, the stained cells on the lower side were subsequently extracted using 10% acetic acid. The absorbance values were recorded using a SpectraMax 190 (Molecular Devices, San Jose, CA, USA) at 600 nm. The invasion assay was performed in a manner similar to that of the migration assay, except that the upper compartment of Transwell membrane was pre-coated with matrigel (Corning, NY, USA) and the incubation time was 48 h.
RNA sequencing (RNA-seq)
RNA sequencing was processed and analyzed as previously described.Citation21 Total RNA of each sample was extracted using the TRIzol reagent (Invitrogen, Carlsbad, CA, USA). The mRNA was enriched with oligo (dT) and fragmented into small fragments. After reverse transcription, 3ʹ and 5ʹ adaptors ligation, PCR amplification, and library construction, these samples from above small fragments were sequenced using HiSeq2500 (Illumina Inc.; San Diego, CA, USA). The sequences were processed and analyzed by GENEWIZ, Inc (Suzhou, China).
Quantitative real-time PCR (qPCR)
Relative mRNA levels were measured by qPCR as previously described.Citation10,Citation18,Citation36,Citation37 Total RNA prepared with the TRIzol reagent (Invitrogen, Carlsbad, CA, USA) was reversed transcribed into cDNA using the PrimeScript RT Reagent Kit (TaKaRa, Tokyo, Japan). TB Green Premix EX Taq Kit (TaKaRa, Tokyo, Japan) was used for the assays and qPCR was performed in a 7500 Fast Real-Time PCR System (Applied Biosystems, Grand Island, NY, USA). The total reaction volume was 20 μL, including 10 μL TB Green Premix EX Taq, 10 mM forward primer, 10 mM reverse primer, 0.4 μL ROX reference Dye, and 2 μL cDNA template. Each assay was performed in triplicate. Non template control was added in all the assays. The PCR parameters were as follows: 95°C, 30 s; 90°C, 5 s, 64°C, 20 s, and 72°C, 15 s for 40 cycles; and 72°C, 10 min. mRNA expression was normalized to GAPDH mRNA. All primers were synthesized by Sangon (Shanghai, China) as follows: (5ʹ-3ʹ)
CXCL1-F 5ʹ-GTCCGTGGCCACTGAACT-3ʹ;
CXCL1-R 5ʹ-GGGGATGCAGGATTGAGGC-3ʹ;
CXCL2-F 5ʹ-ACATCCAAAGTGTGAAGGTGA-3ʹ;
CXCL2-R 5ʹ-CGATGCGGGGTTGAGACAA-3ʹ;
CXCL3-F 5ʹ-CGTCCGTGGTCACTGAACT-3ʹ;
CXCL3-R 5ʹ-CGGGGTTGAGACAAGCTTTC-3ʹ;
CXCL5-F 5ʹ-GTGTTGAGAGAGCTGCGTTG-3ʹ;
CXCL5-R 5ʹ-TCAAGACAAATTTCCTTCCCGT-3ʹ;
CXCL6-F 5ʹ-GACAGAGCTGCGTTGCACTT-3ʹ;
CXCL6-R 5ʹ-TTCAGGGAGGCTACCACTTC-3ʹ;
CX3CL1-F 5ʹ-TATCTCTGTCGTGGCTGCTC-3ʹ;
CX3CL1-R 5ʹ-GTGCTGTCTCGTCTCCAAGA-3ʹ;
CCL5-F 5ʹ- TCCTCATTGCTACTGCCCTC-3ʹ;
CCL5-R 5ʹ- TCGGGTGACAAAGACGACTG-3ʹ;
CCL20-F 5ʹ-CTCCTGGCTGCTTTGATGTC-3ʹ;
CCL20-R 5ʹ-AGCATTGATGTCACAGCCTTC-3ʹ;
GAPDH-F 5ʹ-CCATGGAGAAGGCTGGGG-3ʹ;
GAPDH-R 5ʹ-CAAAGTTGTCATGGATGACC-3ʹ.
All experiments were performed in triplicate and automatically analyzed using the PCR system software.
Small interfering RNA (siRNA)
Knockdown of specific genes was accomplished with siRNA as previously described.Citation33,Citation37 Briefly, 4 × 10⁵ cells per well were seeded into 6-well plates and transfected with 100 nM siRNA using RNAi Max (Invitrogen, Carlsbad, CA, USA) according to the manufacturer’s instructions for 48 h. The sequences of siRNA are as follows:
5ʹ- ACACGCAGUUGCAGUACAUTT −3ʹ for ERK1–1;
5ʹ- GACCGGAUGUUAACCUUUATT −3ʹ for ERK1–2;
5ʹ- GUGCUCUGCUUAUGAUAAUTT −3ʹ for ERK2–1;
5ʹ- CACCAACCAUCGAGCAAAUTT −3ʹ for ERK2–2;
5ʹ- CACCCAAACCGAAGUCAUAGCCA −3ʹ for CXCL1–1;
5ʹ- CAGUGUUUCUGGCUUAGAA −3ʹ for CXCL1–2;
5ʹ- CACUCAAGAAUGGGCAGAATT −3ʹ for CXCL2–1;
5ʹ- CAUCGCCCAUGGUUAAGAATT −3ʹ for CXCL2–2;
5ʹ- GCAGACACUGCAGGGAAUUTT −3ʹ for CXCL3–1;
5ʹ- GACAGCUGGAAAGGACUUATT −3ʹ for CXCL3–2;
5ʹ- UCUGCAAGUGUUCGCCAUATT −3ʹ for CXCL5–1;
5ʹ- CAAAGUGUCUUGAAUUGUA −3ʹ for CXCL5–2;
5ʹ- GAGCUGCGUUGCACUUGUUTT −3ʹ for CXCL6–1;
5ʹ- GCAGUGCUCCAAGGUGGAATT −3ʹ for CXCL6–2;
5ʹ- GACUCCUUCUUCCCAGGAATT −3ʹ for CX3CL1–1;
5ʹ- GGAGAAUGCUCCGUCUGAATT −3ʹ for CX3CL1–2;
5ʹ- GCUGUCAUCCUCAUUGCUATT −3ʹ for CCL5–1;
5ʹ- CCCAGAGAAGAAAUGGGUUTT −3ʹ for CCL5–2;
5ʹ- CCGUAUUCUUCAUCCUAAATT −3ʹ for CCL20–1; and
5ʹ- GCUAUCAUCUUUCACACAATT −3ʹ for CCL20–2;
All siRNA sequences were synthesized by Shanghai GenePharma Co. Ltd (Shanghai, China).
Statistical analysis
Data are presented as the mean ± SD. Student’s t-test was performed to determine the significant difference between two groups. P < .05 was considered to be statistically significant.
Results
Confirming the synergistic effects of combination of PARP1 and Chk1 inhibitor in vitro
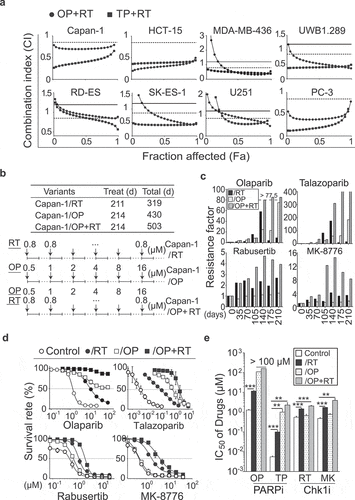
We first examined the effects of the combination of olaparib or talazoparib with rabusertib in 8 HRR-deficient cell lines following a 7-day exposure by performing combination index-fraction analysis with the median-effect method.Citation34 Both combinations (i.e., olaparib+rabusertib and talazoparib+rabusertib) resulted in synergistic effects with a combination index (CI) < 0.8 in 6 cell lines (human pancreatic cancer Capan-1 cells, colon cancer HCT-15 cells, breast cancer MDA-MB-436 cells, ovarian cancer UWB1.289 cells, Ewing sarcoma SK-ES-1 cells and prostate cancer PC-3 cells) derived from different tissues while producing only moderate synergy (CI: 0.8–1.2) in the remaining cell lines (RD-ES and U251) (). The results confirmed the synergistic effects of the PARP1 and Chk1 inhibitor combinations in vitro, as reported previously.Citation25–27,Citation29–31
Figure 1. Differential effects of 7-day and 7-month exposure of cancer cells to PARP1 inhibitors, Chk1 inhibitors or their combinations on cellular drug sensitivity. a, Combination index-fraction affected plots. The indicated cancer cells were exposed to olaparib (OP) or talazoparib (TP) and rabusertib (RT) for 7 days and then subjected to SRB assays. The combination index (CI) was calculated using CalcuSyn software based on the Chou-Talalay equation. CI values: < 0.8, synergy; 0.8 to 1.2, additivity; > 1.2, antagonism. Solid line, CI = 1.2; dotted line, CI = 0.8. b, Schematic diagram illustrating approximately 7 months of exposure of Capan-1 cells to the PARP1 inhibitor olaparib (OP), the Chk1 inhibitor rabusertib (RT) or their combination. The resulting resistant variants were denoted as Capan-1/RT, Capan-1/OP and Capan-1/OP+RT. Treat (d), treatment time; Total (d): total days of treatment and recovery time. Solid line, cells were treated with the indicated agents; dotted line, surviving cells after treatments were amplified in drug-free medium. c, Emergence and stability of drug resistance at different time points. Capan-1 cells gradually acquired drug resistance to the PARP1 inhibitors olaparib and talazoparib (upper panel) or the Chk1 inhibitors rabusertib and MK-8776 (lower panel) after treatments for 35, 70, 105, 140, 175 and 210 days. The IC50 values of the indicated agents for each time point were evaluated by 7-day SRB assays, and the resistance factor was calculated and is shown on the Log2 scale. Capan-1 cells were labeled as control. d and e, Capan-1/OP+RT cells were more resistant to PARP1 inhibitors (PARPi) and Chk1 inhibitors (Chk1i). Cells were exposed to olaparib (OP), talazoparib (TP), rabusertib (RT) or MK-8776 (MK) for 7 days, and then subjected to SRB assays. Survival rates (d) and IC50 values (e) are presented as the mean ± SD from three independent experiments. ** p < .01, *** p < .001.
Effects of repeated treatment of olaparib, rabusertib, or their combination on drug sensitivity in Capan-1 cells
We then chose olaparib, rabusertib or their combination to repeatedly treat pancreatic Capan-1 cancer cells for 211–214 days (detailed in the Materials and Methods section) (). This exposure time largely covered the survival time (typically less than 1 year) of pancreatic cancer patients and PFS (averaged 24.7 weeks; ranging from 3.9 to 41.1 weeks) of the patients with therapeutic responses to olaparib.Citation38 At 35-day intervals during drug exposure, we continually monitored the changes in drug sensitivity (; FigureS1a and b). The data showed that treatments with rabusertib alone gave Capan-1 cells 2.2-fold resistance to rabusertib itself and 2.0-fold resistance to the other Chk1 inhibitor, MK-8776, at the first 35-day monitoring point. This low-grade resistance (RF: ~4.1) basically remained at the end of the exposure. The same treatments caused higher-grade resistance (RF: ~173.8) to the PARP1 inhibitors olaparib and talazoparib. Treatments with olaparib alone led to no or only a slight reduction in sensitivity of Capan-1 cells to both Chk1 inhibitors (RF: ~1.7) but prominent resistance (RF: ~183.5) to both PARP1 inhibitors. In contrast, the combination of olaparib and rabusertib resulted in the highest-grade resistance to the Chk1 inhibitors (RF: ~14.6) and to the PARP1 inhibitors (RF: ~420.2). Moreover, the resistance increased over the exposure time, reached its peak at the 140-day monitoring point and then remained at the end ( and Fig. S1a).
The above differences were also displayed in the final resulting variant cells: for the PARP1 inhibitors, resistance increased in the order of Capan-1/RT (RF: ~19.1), Capan-1/OP (RF: ~183.5) and Capan-1/OP+RT (RF: ~416.6), while for the Chk1 inhibitors, resistance increased in the order of Capan-1/OP (RF: ~1.6), Capan-1/RT (RF: ~3.4) and Capan-1/OP+RT (RF: ~8.3) ( and e; Fig. S1b).
All these data indicate that relative to treatments with single agents, the addition of rabusertib to repeated treatments with olaparib aggravates the degree of resistance of Capan-1 cells to both PARP1 and Chk1 inhibitors.
Reduction of cell cycle arrest, apoptosis and DNA damage induced by olaparib in the resistant variants
As shown above, olaparib, rabusertib or their combination can result in PARP1 inhibitor resistance (). In the resulting resistant variants, consistently, the PARP1 inhibitor olaparib led to a significant decrease in G2/M arrest and apoptosis, particularly in the high-concentration groups (). Comparably, activation of caspase 3, 7, 8 and 9 and phosphorylation of Chk1 (p-Chk1) were decreased in the resistant cells relative to the parental cells in response to olaparib treatment ( and e). Moreover, when exposed to the same concentrations of olaparib, the resulting resistant cells accumulated much fewer DNA double-strand breaks as revealed by lower γH2AX levels than Capan-1 cells ().
Figure 2. Cell cycle arrest, apoptosis and DNA-damage induced by olaparib. a and b, G2/M arrest and apoptosis induced by olaparib were determined by flow cytometry in Capan-1 cells and the resistant variants. c, Percentage of cells in the G2/M phase (left panel) and apoptotic cells (right panel) were analyzed with FlowJo software. All data are presented as the mean ± SD from three independent experiments. * p < .05, ** p < .01, *** p < .001. d and e, Cells were treated with olaparib for the indicated time, and then subjected to Western blotting analysis for caspase 3, 7, 8 and 9 and corresponding cleaved forms (abbreviated as “c-”) (d) andɣH2AX, Chk1 and p-Chk1 (e). f, Protein levels of PARP1, PARP2, PARP3 and PARG detected by Western blotting in Capan-1 cells and the resistant variants. g, Protein levels of the drug transporter P-gp were detected by Western blotting. KB cells served as the negative control, and KB/VCR cells served as the positive control. h, Protein levels of p-Akt and total Akt were detected by Western blotting. i, Capan-1/RT (upper panel), Capan-1/OP (middle panel) and Capan-1/OP+RT (lower panel) cells were treated with PARP1 inhibitors [olaparib (OP, left panel) or talazoparib (TP, right panel)] alone or combined with the Akt inhibitor MK2206 2HCl (MK22, 100 nM) for 7 days, and then subjected to SRB assays. All data are presented as the mean ± SD from three independent experiments.
![Figure 2. Cell cycle arrest, apoptosis and DNA-damage induced by olaparib. a and b, G2/M arrest and apoptosis induced by olaparib were determined by flow cytometry in Capan-1 cells and the resistant variants. c, Percentage of cells in the G2/M phase (left panel) and apoptotic cells (right panel) were analyzed with FlowJo software. All data are presented as the mean ± SD from three independent experiments. * p < .05, ** p < .01, *** p < .001. d and e, Cells were treated with olaparib for the indicated time, and then subjected to Western blotting analysis for caspase 3, 7, 8 and 9 and corresponding cleaved forms (abbreviated as “c-”) (d) andɣH2AX, Chk1 and p-Chk1 (e). f, Protein levels of PARP1, PARP2, PARP3 and PARG detected by Western blotting in Capan-1 cells and the resistant variants. g, Protein levels of the drug transporter P-gp were detected by Western blotting. KB cells served as the negative control, and KB/VCR cells served as the positive control. h, Protein levels of p-Akt and total Akt were detected by Western blotting. i, Capan-1/RT (upper panel), Capan-1/OP (middle panel) and Capan-1/OP+RT (lower panel) cells were treated with PARP1 inhibitors [olaparib (OP, left panel) or talazoparib (TP, right panel)] alone or combined with the Akt inhibitor MK2206 2HCl (MK22, 100 nM) for 7 days, and then subjected to SRB assays. All data are presented as the mean ± SD from three independent experiments.](/cms/asset/637a33a7-c7c1-452a-8709-a8ee9a118a52/kcbt_a_2024414_f0002_b.gif)
PARP family members, i.e., PARP1, PARP2, and PARP3, have been implicated in DNA repair and genomic integrity.Citation39 Loss of poly(ADP-ribose) glycohydrolase (PARG) has been observed in response to treatments with PARP1 inhibitors.Citation40 However, the changes in the protein levels of PARP1, PARP2, PARP3, and PARG were undetectable in the resulting cells relative to the parental cells (). P-glycoprotein (P-gp) was undetectable in any resulting resistant variants or their parental cells, although high levels of P-gp were detected in the positive control KB/VCR cells (). In addition, phosphorylated Akt (p-S473) was shown to increase in all resistant cells (). However, inhibition of Akt with the Akt inhibitor, MK2206 2HCl (MK22), restored the sensitivity of 3 resistant variants to neither olaparib nor talazoparib (). These data suggest that the observed resistance is not associated with the expression of the tested PARP family members, upregulation of P-gp, or activation of the Akt pathway.
Enhanced migratory and invasive capacities of the resulting resistant variants
To better understand the effects of the above mentioned repeated treatments on Capan-1 cells, we further investigated changes in cell morphology and mobility. The parental Capan-1 cells possessed roughly round shapes that were typical of an epithelial cobblestone appearance and grew in clusters with tight cell-cell contacts and indistinct cell borders. In contrast, all resistant cells displayed elongated and irregular fibroblastic morphology (). These morphological changes suggest that the resistant variants acquire a more invasive phenotype. To further confirm this, cell migration and invasion abilities were tested as previously described.Citation18,Citation35 The migration abilities of the resistant cells were enhanced by 1.73- (Capan-1/OP), 2.39- (Capan-1/RT) and 4.77- (Capan-1/OP+RT) fold relative to their parental cells ( and d). Consistently, their invasion capacity was also significantly increased ( and d). Notably, Capan-1/OP+RT cells exhibited much higher migratory and invasive capacities than Capan-1/OP cells. These data suggest that relative to olaparib, the Chk1 inhibitor rabusertib might be an important contributor to the increased migration and invasion capabilities in Capan-1 cells.
Figure 3. Migration and invasion of the resistant variants and their parental cells. a, Morphology of the resistant variants and parental Capan-1 cells. Scale bar: 100 μm. b and c, Representative images show the migrating (b) and invading (c) cells. Cells were seeded in chambers (migration) or matrigel-coated chambers (invasion), incubated for 24 h (migration) or 48 h (invasion) and then stained with crystal violet. -Magnification: 10 × . d, Quantification results of b and c. The results indicated the combined data from three independent assays. Relative migration or invasion was calculated in relation to parental Capan-1 cells. SKOV-3 cells served as the positive control. All data are presented as the mean ± SD from three independent experiments. * p < .05, ** p < .01, *** p < .001. e, Western blot analysis of the indicated EMT-related proteins in the resistant variants and Capan-1 cells.
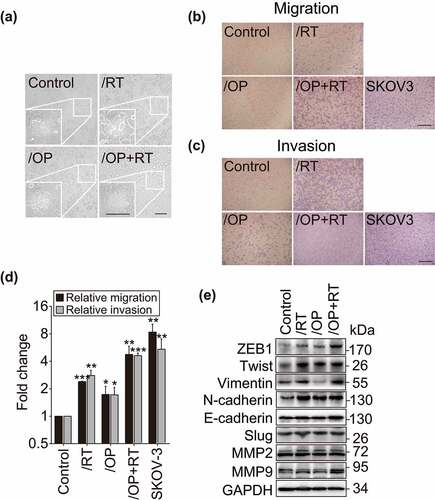
Epithelial-mesenchymal transition (EMT) is a critical step in the development of the invasive and migratory properties of cancer cells.Citation41 Several transcription factors, including ZEB1, Twist and Slug, function as molecular switches in the EMT process and play a vital role in cell migration and invasion.Citation42 Therefore, the expression of ZEB1, Twist, Slug, N-cadherin, E-cadherin, Vimentin, MMP2 and MMP9 was assessed in these cells (). All three resistant variants were found to express higher levels of ZEB1, Twist and N-cadherin than the parental cells (). Vimentin also had an enhanced level in both the Capan-1/RT and Capan-1/OP+RT sublines but not in the Capan-1/OP subline. No observable changes in the levels of the other tested proteins were observed in the resistant cells ().
Elevated expression of CXCL3 in resistant cells is associated with enhanced migration ability
To identify the expression-affected genes regulating the migration and invasion of the resistant cells, we conducted transcription profiling by RNA sequencing (RNA-seq). The results revealed that the expression of 124 genes changed significantly in all 3 resistant cells [log2 fold change > 2 with statistical significance (p < .05)] compared with their expression in the parental Capan-1 cells. Among these genes, 99 were upregulated and 25 were downregulated ( and Supplementary Table S1). Notably, the mRNA levels of 8 chemokine signaling-related genes, i.e., CXCL1, CXCL2, CXCL3, CXCL5, CXCL6, CX3CL1, CCL5 and CCL20, were consistently significantly upregulated in the resistant variants ( and Supplementary Table S1). The results were confirmed by qRT-PCR analysis (Fig. S2a). The 8 genes have been reported to be involved in cell invasion, motility, metastasis, interactions with the extracellular matrix and survival.Citation43 To investigate whether they contribute to the increased migration capacities of the resistant cells, we employed specific siRNAs to reduce their expression in Capan-1/OP+RT cells (Fig. S2b). The results showed that only depletion of CXCL3 significantly suppressed migration, with a reduction in migrated cells up to 40.63% relative to the control group (Fig. S2c and d), indicating that CXCL3 may be important for promoting migration.
Figure 4. Increased expression of CXCL3 in resistant cells is associated with enhanced migration. a, RNA-seq analysis identified 124 differentially expressed genes in all of the resistant cells (upper panel) and the differentially expressed details of 8 chemokine genes (lower panel). b, qRT-PCR validated the differential expression of CXCL3 in the resistant sublines and the parental cells. Data were normalized and presented as the mean ± SD from three independent experiments. * p < .05, ** p < .01. c, Western blotting analysis of CXCL3 levels. d, Western blotting analysis of CXCL3 levels following 1 μM rabusertib, 1 μM olaparib or both treatments for 24, 48 and 72 h. e, Knockdown of CXCL3 with siRNA suppressed the migration of Capan-1/RT and Capan-1/OP+RT variants. Cells were transfected with siCXCL3 for 48 h, and then subjected to Western blotting (upper panel) or Transwell migration assays for 24 h (lower panel). Magnification: 10 × . f, Quantitative data from migration assays (e) are presented as the mean ± SD from three independent experiments. *** p < .001. g, Western blotting analysis of EMT-related protein after transfection with siCXCL3 for 48 h in Capan-1/RT and Capan-1/OP+RT variants. h-j, Exogenous CXCL3 stimulated the migration of parental Capan-1 cells and influenced the expression of EMT-related proteins. Cells were treated with CXCL3 (1, 5 and 10 ng/ml) for 24 h in serum-free medium, and then subjected to Transwell migration assays (h) or Western blotting (j). Quantification data (i) from migration assays are presented as the mean ± SD from three independent experiments. * p < .05.
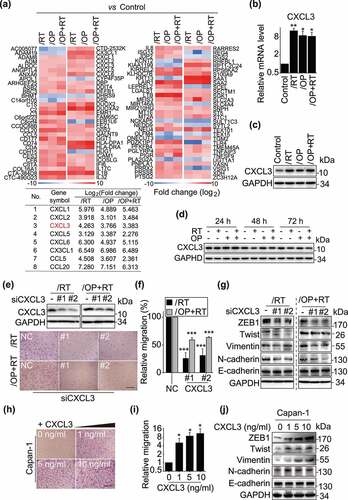
All the resistant variants expressed higher levels of CXCL3 mRNA () and protein () than the parental cells. However, treatments with the indicated PARP1 or Chk1 inhibitors did not increase the expression of CXCL3, suggesting that CXCL3 might not be regulated directly by PARP1 or Chk1 (). Knockdown of CXCL3 with a pair of siRNAs significantly inhibited the migration of Capan-1/RT and Capan-1/OP+RT cells, with reduction of migrated cells up to 74.32% and 40.97%, respectively (). Consistent with the decrease in migration abilities, depletion of CXCL3 clearly reduced the expression of ZEB1, Twist, Vimentin and N-cadherin (). Additionally, exogenous administration of CXCL3 led to a 4.97–10.67-fold increase in the migration of parental Capan-1 cells in a concentration-dependent manner (). Similarly, exogenous CXCL3 increased the expression of ZEB1, Twist, Vimentin and N-cadherin in Capan-1 cells (). However, depletion or exogenous administration of CXCL3 did not significantly affect cellular sensitivity to PARP1 or Chk1 inhibitors (Fig. S3). Moreover, CXCL3 did not significantly affect cell proliferation of Capan-1, Capan-1/RT and Capan-1/RT+OP cells. Only Capan-1/OP cells grew more slowly after silencing CXCL3 (Fig. S4). The data indicate that the increased expression of CXCL3 in the resistant variants might be associated with their enhanced migratory capabilities rather than their acquired drug resistance.
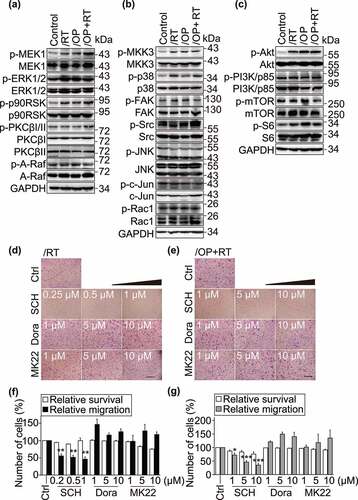
ERK1/2 inhibitors suppress the cell migration of resistant variants
CXCL3 has been reported to promote cell migration by activating downstream pathways, such as the ERK1/2, JNK, p38 and Akt pathways.Citation44–47 Thus, we examined the changes in downstream signaling molecules that are activated in response to CXCL3 signaling. The results showed there were significantly higher levels of p-ERK1/2 (T202/Y204), p-p38 (T180/Y182), p-Akt (S473), p-MEK1 (T1402), p-p90RSK (T359/S363), p-MKK3 (S189) and p-S6 (S235/S236) in the resistant variants than in the parental cells (). No difference was observed in the JNK pathway. To examine the effect of the ERK1/2/p38/Akt pathways on cell migration, Capan-1/RT and Capan-1/OP+RT cells were exposed to the ERK1/2 inhibitor SCH772984 (SCH), the p38 inhibitor doramapimod (Dora) or the Akt inhibitor MK-2206 2HCl (MK22) for 24 h (). Only the ERK1/2 inhibitor SCH significantly inhibited cell migration of the resistant variants (). Similar results were observed when two other ERK1/2 inhibitors, LY3214996 (LY) and ulixertinib (Ulix) were used (Fig. S5a-d). In contrast, p38 and Akt inhibitors did not affect cell migration of the resistant variants, ruling out the involvement of p38 or Akt pathways. Moreover, the ERK1/2 inhibitor in these cells did not affect sensitivity to PARP inhibitors (Fig. S5e).These results suggest that the ERK1/2 pathway activation is critical for the enhanced migratory capabilities of resistant variants.
Figure 5. Inhibition of ERK1/2 reduces the migration of Capan-1/RT and Capan-1/OP+RT cells. a-c, The expression of ERK1/2, p38, JNK, and Akt pathway components was examined by Western blotting. Cells were cultured in Iscove’s modified Dulbecco’s medium (IMDM) without fetal bovine serum (FBS) for 24 h, and then migration-related protein levels were detected by Western blotting. These pathways included the PI3K-PKC-A-Raf-MEK1-ERK1/2 (a), JNK/p38 (b), and Akt-mTOR (c) pathways. d-g, Representative images (d and e) and quantitative data (f and g) from migration assays. Transwell migration (for 24 h) and SRB assays were performed for Capan-1/RT and Capan-1/OP+RT after treatment with the indicated agents for 24 h. ERK1/2 inhibitor: SCH900776 (SCH); p38 inhibitor: doramapimod (Dora); and Akt inhibitor: MK-2206 2HCl (MK22). All data were analyzed from three independent experiments and are presented as the mean ± SD. * p < .05, ** p < .01, *** p < .001.
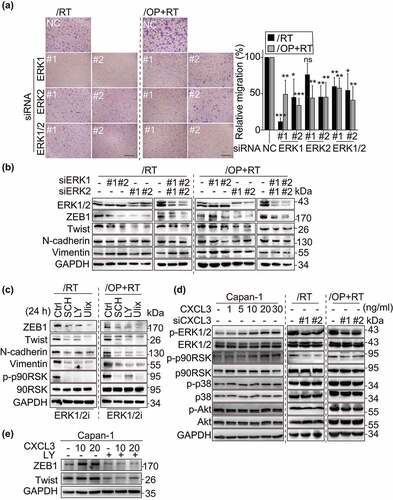
The CXCL3-ERK1/2 signaling axis is involved in regulating cell migration in resistant variants
To further verify the results described above, we used isoform-specific siRNAs to reduce the expression of ERK1 or ERK2. The data showed that depletion of ERK1/2 significantly decreased the percentage of migrated resistant cells, with less than 10% cell death (). Meanwhile, a decrease in the expression of ZEB1 and Twist was also observed after the cells were treated with siERK1, siERK2 or both for 48 h () or with different ERK1/2 inhibitors, including SCH, LY and Ulix for 24 h (). Vimentin and N-cadherin were also down-regulated when ERK1/2 activity was inhibited in the Capan-1/RT and Capan-1/OP+RT sublines. Consistently, the ERK1/2 signaling, but not p38 or Akt pathways, was regulated by exogenous administration or depletion of CXCL3 (). Furthermore, pre-treatment of ERK inhibitor abrogated the accumulation of ZEB1 and Twist induced by CXCL3 indicative of an essential role for ERK1/2 in EMT-like changes (). Thus, these data indicate that the CXCL3-ERK1/2 signaling promotes the cell migration of resistant variants.
Figure 6. The CXCL3-ERK1/2 axis plays a critical role in the migration of resistant variants. a, Depletion of ERK1/2 attenuated the migration of Capan-1/RT and Capan-1/OP+RT variants. Cells were transfected with siERK1, siERK2, or both for 48 h, and then subjected to Transwell migration assays for 24 h. Representative images of Capan-1/RT and Capan-1/OP+RT (left panel). Quantitative data from the migration assays (right panel). All data were analyzed from three independent experiments and expressed as the mean ± SD. ns, not significant, * p < .05, ** p < .01, *** p < .001. b and c, Western blotting analysis of EMT-related proteins after transfection with siERK1, siERK2 or both for 48 h (b) or treatments with ERK1/2 inhibitors for 24 h (c) in Capan-1/RT and Capan-1/OP+RT cells. ERK1/2 inhibitors (ERK1/2i): SCH772984 (SCH), LY3214996 (LY) and ulixertinib (Ulix). d, CXCL3 regulated the phosphorylation of ERK1/2 and p90RSK. Cells were treated with the chemokine CXCL3 (1, 5, 10, 20, and 30 ng/ml) for 24 h or siCXCL3 for 48 h, and then subjected to Western blotting to detect total and phosphorylated protein levels. p90RSK is the direct downstream effector of ERK1/2 signaling. e, Changes in ZEB1 and Twist expression levels following CXCL3 and ERK1/2 inhibitor incubation. FBS-starved cells were pre-treated with 10 μM LY3214996 (LY) for 4 h, then with the chemokine CXCL3 (10 and 20 ng/ml) for 24 h, and subjected to Western blotting.
Discussion
PARP1 inhibitors have been proposed in combination with Chk1 inhibitors for cancer therapy.Citation22–32 However, no data have revealed the effects of long-term exposure of cancer cells to the combination of PARP1 and Chk1 inhibitors. Here, we report the results of repeated treatments of pancreatic cancer Capan-1 cells with the PARP1 inhibitor olaparib, the Chk1 inhibitor rabusertib or both for ~7 months (). Unexpectedly, the data show that treatments with the combination of rabusertib and olaparib lead to increased drug resistance to both PARP1 and Chk1 inhibitors. Consistently, the resulting resistant cells display lower responses to cell cycle arrest, apoptosis and DNA damage induced by olaparib, further strengthening this conclusion. However, drug resistance in different resistant variants appears not to be correlated with the expression of PARP family members (i.e., PARP1, PARP2, and PARP3), upregulation of P-gp or activation of the Akt pathway. Therefore, the mechanisms remain to be further investigated.
Figure 7. Graphic model illustrating repeated treatment of PARP1-Chk1 inhibitor promote drug resistance, migration and invasion. During a 7 days treatment, PARPi-Chk1i combination exhibited a synergistic antitumor effect on 8 HRR-deficient cancer cell lines. When Capan-1 cells are under the selective pressure of repeated treatment for about 7 months, the rabusertib/olaparib combination result in increased drug resistance than monotherapy. Furthermore, the migration and invasion abilities of resistant cells were enhanced through activating CXCL3-ERK1/2 signaling pathway.
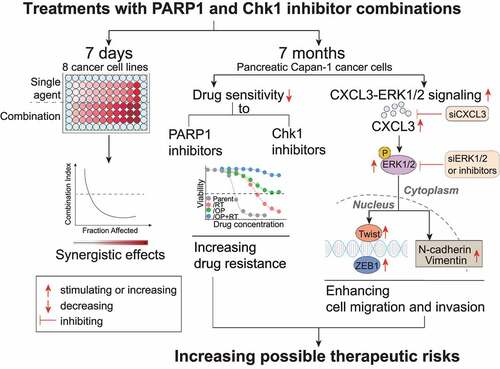
The other unexpected result is that all resulting resistant cells gain enhanced migratory and invasive capabilities and moreover, Capan-1/OP+RT cells have much higher migratory and invasive capacities than Capan-1/OP cells (). The protein levels of both EMT-related transcription factors, ZEB1 and Twist, display consistent increases in all resistant cells. Together with the morphological changes, these data show that the resistant cells obtain an EMT-like phenotype. These results indicate that treatment of Capan-1 cells with the PARP1 and Chk1 inhibitor combination might cause a more aggressive cell phenotype than treatment with olaparib. In fact, our previous studies demonstrated that approximately 3 months of exposure of glioblastoma U251 cells to different PARP1 inhibitors (i.e., olaparib, talazoparib and simmiparib) led to a ~1.93-fold increase in their migration and invasion abilities,Citation18 highly similar to the change revealed in Capan-1/OP cells. Although several previous studies reported contradictory results on the effects of PARP1 and PARP1 inhibitors on EMT,Citation47–50 our data from Capan-1 and U251 cells show that the effects of PARP1 inhibitors as single agents on cell migration and invasion are weak. Therefore, the more aggressive phenotype of Capan-1/OP+RT cells is likely derived from the addition of the Chk1 inhibitor rabusertib, when Capan-1 cells were exposed to the PARP1 inhibitor olaparib.
According to the gene expression profiling results, we further demonstrate that activation of the CXCL3-ERK1/2 signaling contributes to the enhanced migratory capabilities of resistant variants, as indicated by consistent data from RNA interference, exogenous CXCL3 addition and pharmacological inhibition. Sun et al. demonstrated that the RAS/MEK/ERK pathway is activated in PARPi-resistant A2780 CP and UWB1.289 clones; and MEKi and ERKi are synergistic with PARPi in RAS mutant and PARPi-resistant cells.Citation51 We have not demonstrated this functionally in the models tested. We report here that ERK1/2 specifically regulated CXCL-3-induced EMT-like changes and the CXCL3-ERK1/2 signaling is essential for cells migration of resistant variants. However, this signaling may not be correlated with acquired drug resistance. CXCL3 has been reported to be upregulated in aggressive cancers and to stimulate tumor metastasis.Citation45,Citation46,Citation52 However, it is worth noting that either depletion of CXCL3 or inhibition of ERK1/2 could not completely suppress the migration of Capan-1/RT and Capan-1/OP+RT cells, suggesting that there are other possible mechanisms. In addition, although the CXCL1 gene is transcriptionally regulated by the binding of PARP1 to its promoter,Citation53 the CXCL3 gene might not be regulated directly by PARP1 because treatments with olaparib alone or the combination of rabusertib and olaparib (for 24 ~ 72 h) did not obviously change the protein levels of CXCL3 in Capan-1 cells. Therefore, the mechanism responsible for the elevated expression of CXCL3 in the resulting resistant cells (Capan-1/OP, Capan-1/RT and Capan-1/OP+RT cells) remains to be clarified.
Apparently, therapeutic effectiveness in cancers concurrently treated with PARP1 and Chk1 inhibitors might be hindered by increasing drug resistance, enhancing migration and invasion. We noticed that PARPi-resistant Capan-1/OP cells remained sensitive to the Chk1 inhibitors rabusertib and MK-8776 (). Other studies also demonstrated that Chk1 inhibitors exhibited monotherapy activity in PARPi-resistant models.Citation32 Chk1 inhibitors might still elicit clinical efficacy in patients who have previously progressed after treatments with a PARP1 inhibitor. Therefore, sequential administration of PARP1 and Chk1 inhibitors might be a promising treatment strategy that deserves further investigation. Collectively, we demonstrate that repeated treatments with the combination of rabusertib and olaparib result in a higher degree of acquired drug resistance and a more aggressive cell phenotype than treatments with either single agent. Activation of CXCL3-ERK1/2 signaling is correlated with the increased migration of the resistant cells rather than their acquired drug resistance. As only one cancer cell line (Capan-1) was used in this study, the results need to be confirmed in more models including in vivo models. The underlying mechanisms responsible for acquired drug resistance in the resulting resistant cells also need further investigation in the future. Nevertheless, these novel findings are noteworthy for future clinical trials of PARP1 and Chk1 inhibitor combinations for cancer therapy.
Abbreviations
PARP1: Poly(ADP-ribose) polymerase 1; PFS: Progression-free survival; HRR: Homologous recombination repair; Chk1: Checkpoint kinase 1; ATCC: American Type Culture Collection; CCK-8: Cell Counting Kit-8; SRB: Sulforhodamine B; CI: Combination index; PI: Propiduim iodide; PARG: Poly(ADP-ribose) glycohydrolase; EMT: Epithelial-mesenchymal transition.
Contributions
Conception and design: Z.-H.M. and J.-X.H.; development of methodology: N.G., M.-Z.L., H.-D.C., S.-S.S., Z.-H.M. and J.-X.H.; data acquisition: N.G., M.-Z.L., L.-M.W., H.-D.C., and S.-S.S.; analysis and interpretation of data: N.G., J.-X.H., Z.-H.M., M.-Z.L., L.-M.W., H.-D.C., and S.-S.S.; Writing of the paper: J.-X.H., Z.-H.M. and N.G.; study supervision: J.-X.H., Z.-H.M.
Supplemental Material
Download Zip (2.7 MB)Disclosure statement
No potential conflict of interest was reported by the author(s).
Data Availability Statement
All data generated or analyzed during the current study are available from the corresponding authors on reasonable request. E-mail: [email protected] (J.-X. He); [email protected] (Z.-H. Miao).
Supplementary material
Supplemental data for this article can be accessed on the publisher’s website
Additional information
Funding
References
- Bryant HE, Schultz N, Thomas HD, Parker KM, Flower D, Lopez E, Kyle S, Meuth M, Curtin NJ, Helleday T. Specific killing of BRCA2-deficient tumours with inhibitors of poly(ADP-ribose) polymerase. Nature. 2005;434(7035):913–917. doi:10.1038/nature03443.
- Farmer H, McCabe N, Lord CJ, Tutt AN, Johnson DA, Richardson TB, Santarosa M, Dillon KJ, Hickson I, Knights C, et al. Targeting the DNA repair defect in BRCA mutant cells as a therapeutic strategy. Nature. 2005;434(7035):917–921. doi:10.1038/nature03445.
- Mateo J, Lord CJ, Serra V, Tutt A, Balmana J, Castroviejo-Bermejo M, Cruz C, Oaknin A, Kaye SB, de Bono JS. A decade of clinical development of PARP inhibitors in perspective. Ann Oncol. 2019;30(9):1437–1447. doi:10.1093/annonc/mdz192.
- Wang YQ, Wang PY, Wang YT, Yang GF, Zhang A, Miao ZH. An update on poly(ADP-ribose)polymerase-1 (PARP-1) inhibitors: opportunities and challenges in cancer therapy. J Med Chem. 2016;59(21):9575–9598. doi:10.1021/acs.jmedchem.6b00055.
- Zhu H, Wei M, Xu J, Hua J, Liang C, Meng Q, Zhang Y, Liu J, Zhang B, Yu X, et al. PARP inhibitors in pancreatic cancer: molecular mechanisms and clinical applications. Mol Cancer. 2020;19(1):49. doi:10.1186/s12943-020-01167-9.
- de Bono J, Mateo J, Fizazi K, Saad F, Shore N, Sandhu S, Chi KN, Sartor O, Agarwal N, Olmos D, et al. Olaparib for metastatic castration-resistant prostate cancer. N Engl J Med. 2020;382(22):2091–2102. doi:10.1056/NEJMoa1911440.
- Ding J, Miao ZH, Meng LH, Geng MY. Emerging cancer therapeutic opportunities target DNA-repair systems. Trends Pharmacol Sci. 2006;27(6):338–344. doi:10.1016/j.tips.2006.04.007.
- He JX, Yang CH, Miao ZH. Poly(ADP-ribose) polymerase inhibitors as promising cancer therapeutics. Acta Pharmacol Sin. 2010;31(9):1172–1180. doi:10.1038/aps.2010.103.
- Yuan B, Ye N, Song SS, Wang YT, Song Z, Chen HD, Chen CH, Huan XJ, Wang YQ, Su Y, et al. Poly(ADP-ribose)polymerase (PARP) inhibition and anticancer activity of simmiparib, a new inhibitor undergoing clinical trials. Cancer Lett. 2017;386:47–56. doi:10.1016/j.canlet.2016.11.010.
- He JX, Wang M, Huan XJ, Chen CH, Song SS, Wang YQ, Liao XM, Tan C, He Q, Tong LJ, et al. Novel PARP1/2 inhibitor mefuparib hydrochloride elicits potent in vitro and in vivo anticancer activity, characteristic of high tissue distribution. Oncotarget. 2017;8(3):4156–4168. doi:10.18632/oncotarget.13749.
- Ye N, Chen CH, Chen T, Song Z, He JX, Huan XJ, Song SS, Liu Q, Chen Y, Ding J, et al. Design, synthesis, and biological evaluation of a series of benzo[de][1,7]naphthyridin-7(8H)-ones bearing a functionalized longer chain appendage as novel PARP1 inhibitors. J Med Chem. 2013;56(7):2885–2903. doi:10.1021/jm301825t.
- Chen J, Peng H, He J, Huan X, Miao Z, Yang C. Synthesis of isoquinolinone-based tricycles as novel poly(ADP-ribose) polymerase-1 (PARP-1) inhibitors. Bioorg Med Chem Lett. 2014;24(12):2669–2673. doi:10.1016/j.bmcl.2014.04.061.
- Chen X, Huan X, Liu Q, Wang Y, He Q, Tan C, Chen Y, Ding J, Xu Y, Miao Z, et al. Design and synthesis of 2-(4,5,6,7-tetrahydrothienopyridin-2-yl)-benzoimidazole carboxamides as novel orally efficacious Poly(ADP-ribose)polymerase (PARP) inhibitors. Eur J Med Chem. 2018;145:389–403. doi:10.1016/j.ejmech.2018.01.018.
- Chen WH, Song SS, Qi MH, Huan XJ, Wang YQ, Jiang H, Ding J, Ren GB, Miao ZH, Li J. Discovery of potent 2,4-difluoro-linker poly(ADP-ribose) polymerase 1 inhibitors with enhanced water solubility and in vivo anticancer efficacy. Acta Pharmacol Sin. 2017;38(11):1521–1532. doi:10.1038/aps.2017.104.
- Chen W, Guo N, Qi M, Dai H, Hong M, Guan L, Huan X, Song S, He J, Wang Y, et al. Discovery, mechanism and metabolism studies of 2,3-difluorophenyl-linker-containing PARP1 inhibitors with enhanced in vivo efficacy for cancer therapy. Eur J Med Chem. 2017;138:514–531. doi:10.1016/j.ejmech.2017.06.053.
- Zhang N, Tian YN, Zhou LN, Li MZ, Chen HD, Song SS, Huan XJ, Bao XB, Zhang A, Miao ZH, et al. Glycogen synthase kinase 3beta inhibition synergizes with PARP inhibitors through the induction of homologous recombination deficiency in colorectal cancer. Cell Death Dis. 2021;12(2):183. doi:10.1038/s41419-021-03475-4.
- Li MZ, Meng T, Song SS, Bao XB, Ma LP, Zhang N, Yu T, Zhang YL, Xiong B, Shen JK, et al. Discovery of MTR-106 as a highly potent G-quadruplex stabilizer for treating BRCA-deficient cancers. Invest New Drugs 2021.
- Wang YT, Yuan B, Chen HD, Xu L, Tian YN, Zhang A, He JX, Miao ZH. Acquired resistance of phosphatase and tensin homolog-deficient cells to poly(ADP-ribose) polymerase inhibitor and Ara-C mediated by 53BP1 loss and SAMHD1 overexpression. Cancer Sci. 2018;109(3):821–831. doi:10.1111/cas.13477.
- Yang ZM, Liao XM, Chen Y, Shen YY, Yang XY, Su Y, Sun YM, Gao YL, Ding J, Zhang A, et al. Combining 53BP1 with BRCA1 as a biomarker to predict the sensitivity of poly(ADP-ribose) polymerase (PARP) inhibitors. Acta Pharmacol Sin. 2017;38(7):1038–1047. doi:10.1038/aps.2017.8.
- Tian YN, Chen HD, Tian CQ, Wang YQ, Miao ZH. Polymerase independent repression of FoxO1 transcription by sequence-specific PARP1 binding to FoxO1 promoter. Cell Death Dis. 2020;11(1):71. doi:10.1038/s41419-020-2265-y.
- Chen HD, Guo N, Song SS, Chen CH, Miao ZH, He JX. Novel mutations in BRCA2 intron 11 and overexpression of COX-2 and BIRC3 mediate cellular resistance to PARP inhibitors. Am J Cancer Res. 2020;10(9):2813–2831.
- Drean A, Lord CJ, Ashworth A. PARP inhibitor combination therapy. Crit Rev Oncol Hematol. 2016;108:73–85. doi:10.1016/j.critrevonc.2016.10.010.
- Gourley C, Balmana J, Ledermann JA, Serra V, Dent R, Loibl S, Pujade-Lauraine E, Boulton SJ. Moving from poly (ADP-Ribose) polymerase inhibition to targeting DNA repair and DNA damage response in cancer therapy. J Clin Oncol. 2019;37(25):2257–2269. doi:10.1200/JCO.18.02050.
- Dent P. Investigational CHK1 inhibitors in early phase clinical trials for the treatment of cancer. Expert Opin Investig Drugs. 2019;28(12):1095–1100. doi:10.1080/13543784.2019.1694661.
- Mitchell C, Park M, Eulitt P, Yang C, Yacoub A, Dent P. Poly(ADP-ribose) polymerase 1 modulates the lethality of CHK1 inhibitors in carcinoma cells. Mol Pharmacol. 2010;78(5):909–917. doi:10.1124/mol.110.067199.
- Tang Y, Hamed HA, Poklepovic A, Dai Y, Grant S, Dent P. Poly(ADP-ribose) polymerase 1 modulates the lethality of CHK1 inhibitors in mammary tumors. Mol Pharmacol. 2012;82(2):322–332. doi:10.1124/mol.112.078907.
- Booth L, Cruickshanks N, Ridder T, Dai Y, Grant S, Dent P. PARP and CHK inhibitors interact to cause DNA damage and cell death in mammary carcinoma cells. Cancer Biol Ther. 2013;14:458–465.
- Booth L, Roberts J, Poklepovic A, Dent P. The CHK1 inhibitor SRA737 synergizes with PARP1 inhibitors to kill carcinoma cells. Cancer Biol Ther. 2018;19(9):786–796. doi:10.1080/15384047.2018.1472189.
- Mani C, Jonnalagadda S, Lingareddy J, Awasthi S, Gmeiner WH, Palle K. Prexasertib treatment induces homologous recombination deficiency and synergizes with olaparib in triple-negative breast cancer cells. Breast Cancer Res. 2019;21(1):104. doi:10.1186/s13058-019-1192-2.
- Kim H, George E, Ragland R, Rafail S, Zhang R, Krepler C, Morgan M, Herlyn M, Brown E, Simpkins F. Targeting the ATR/CHK1 axis with PARP inhibition results in tumor regression in BRCA-mutant ovarian cancer models. Clin Cancer Res. 2017;23(12):3097–3108. doi:10.1158/1078-0432.CCR-16-2273.
- Parmar K, Kochupurakkal BS, Lazaro JB, Wang ZC, Palakurthi S, Kirschmeier PT, Yang C, Sambel LA, Farkkila A, Reznichenko E, et al. The CHK1 inhibitor prexasertib exhibits monotherapy activity in high-grade serous ovarian cancer models and sensitizes to PARP inhibition. Clin Cancer Res. 2019;25(20):6127–6140. doi:10.1158/1078-0432.CCR-19-0448.
- Yin Y, Shen Q, Zhang P, Tao R, Chang W, Li R, Xie G, Liu W, Zhang L, Kapoor P, et al. 2017. Chk1 inhibition potentiates the therapeutic efficacy of PARP inhibitor BMN673 in gastric cancer. Am J Cancer Res. 7(3):473–483.
- Laquente B, Lopez-Martin J, Richards D, Illerhaus G, Chang DZ, Kim G, Stella P, Richel D, Szcylik C, Cascinu S, et al. A phase II study to evaluate LY2603618 in combination with gemcitabine in pancreatic cancer patients. BMC Cancer. 2017;17(1):137. doi:10.1186/s12885-017-3131-x.
- Chou TC. Drug combination studies and their synergy quantification using the Chou-Talalay method. Cancer Res. 2010;70(2):440–446. doi:10.1158/0008-5472.CAN-09-1947.
- Parashar D P, Geethadevi A, Aure MR, Mishra J, George J, Chen C, Mishra MK, Tahiri A, Zhao W, Nair B, et al. miRNA551b-3p activates an oncostatin signaling module for the progression of triple-negative breast cancer. Cell Rep. 2019;29(13):4389–4406 e4310. doi:10.1016/j.celrep.2019.11.085.
- Parashar D, Geethadevi A, McAllister D, Ebben J, Peterson FC, Jensen DR, Bishop E, Pradeep S, Volkman BF, Dwinell MB, et al. Targeted biologic inhibition of both tumor cell-intrinsic and intercellular CLPTM1L/CRR9-mediated chemotherapeutic drug resistance. NPJ Precis Oncol. 2021;5(1):16. doi:10.1038/s41698-021-00152-9.
- Chen HD, Chen CH, Wang YT, Guo N, Tian YN, Huan XJ, Song SS, He JX, Miao ZH. Increased PARP1-DNA binding due to autoPARylation inhibition of PARP1 on DNA rather than PARP1-DNA trapping is correlated with PARP1 inhibitor’s cytotoxicity. Int J Cancer. 2019;145(3):714–727. doi:10.1002/ijc.32131.
- Golan T, Hammel P, Reni M, Van Cutsem E, Macarulla T, Hall MJ, Park JO, Hochhauser D, Arnold D, Oh DY, et al. Maintenance olaparib for germline BRCA-mutated metastatic pancreatic cancer. N Engl J Med. 2019;381(4):317–327. doi:10.1056/NEJMoa1903387.
- Langelier MF, Eisemann T, Riccio AA, Pascal JM. PARP family enzymes: regulation and catalysis of the poly(ADP-ribose) posttranslational modification. Curr Opin Struct Biol. 2018;53:187–198. doi:10.1016/j.sbi.2018.11.002.
- Gogola E, Duarte AA, de Ruiter JR, Wiegant WW, Schmid JA, de Bruijn R, James DI, Guerrero Llobet S, Vis DJ, Annunziato S, et al. Selective loss of PARG restores PARylation and counteracts PARP inhibitor-mediated synthetic lethality. Cancer Cell. 2018;33(6):1078–1093 e1012. doi:10.1016/j.ccell.2018.05.008.
- Felipe Lima J, Nofech-Mozes S, Bayani J, Bartlett JM. EMT in breast carcinoma-a review. J Clin Med. 2016;5(7):65. doi:10.3390/jcm5070065.
- Lamouille S, Xu J, Derynck R. Molecular mechanisms of epithelial-mesenchymal transition. Nat Rev Mol Cell Biol. 2014;15(3):178–196. doi:10.1038/nrm3758.
- Balkwill F. Cancer and the chemokine network. Nat Rev Cancer. 2004;4(7):540–550. doi:10.1038/nrc1388.
- Gui SL, Teng LC, Wang SQ, Liu S, Lin YL, Zhao XL, Liu L, Sui HY, Yang Y, Liang LC, et al. Overexpression of CXCL3 can enhance the oncogenic potential of prostate cancer. Int Urol Nephrol. 2016;48(5):701–709. doi:10.1007/s11255-016-1222-2.
- Xin H, Cao Y, Shao ML, Zhang W, Zhang CB, Wang JT, Liang LC, Shao WW, Qi YL, Li Y, et al. Chemokine CXCL3 mediates prostate cancer cells proliferation, migration and gene expression changes in an autocrine/paracrine fashion. Int Urol Nephrol. 2018;50(5):861–868. doi:10.1007/s11255-018-1818-9.
- Al-Alwan LA, Chang Y, Mogas A, Halayko AJ, Baglole CJ, Martin JG, Rousseau S, Eidelman DH, Hamid Q. Differential roles of CXCL2 and CXCL3 and their receptors in regulating normal and asthmatic airway smooth muscle cell migration. J Immunol. 2013;191(5):2731–2741. doi:10.4049/jimmunol.1203421.
- Rodriguez MI, Peralta-Leal A, O’Valle F, Rodriguez-Vargas JM, Gonzalez-Flores A, Majuelos-Melguizo J, Lopez L, Serrano S, de Herreros AG, Rodriguez-Manzaneque JC, et al. PARP-1 regulates metastatic melanoma through modulation of vimentin-induced malignant transformation. PLoS Genet. 2013;9(6):e1003531. doi:10.1371/journal.pgen.1003531.
- Stanisavljevic J, Porta-de-la-riva M, Batlle R, de Herreros Ag, Baulida J, de Herreros AG. The p65 subunit of NF-kappaB and PARP1 assist Snail1 in activating fibronectin transcription. J Cell Sci. 2011;124:4161–4171. doi:10.1242/jcs.078824.
- Allison Stewart C, Tong P, Cardnell RJ, Sen T, Li L, Gay CM, Masrorpour F, Fan Y, Bara RO, Feng Y, et al. Dynamic variations in epithelial-to-mesenchymal transition (EMT), ATM, and SLFN11 govern response to PARP inhibitors and cisplatin in small cell lung cancer. Oncotarget. 2017;8(17):28575–28587. doi:10.18632/oncotarget.15338.
- Ordonez LD, Hay T, McEwen R, Polanska UM, Hughes A, Delpuech O, Cadogan E, Powell S, Dry J, Tornillo G, et al. Rapid activation of epithelial-mesenchymal transition drives PARP inhibitor resistance in Brca2-mutant mammary tumours. Oncotarget. 2019;10(27):2586–2606. doi:10.18632/oncotarget.26830.
- Sun C, Fang Y, Yin J, Chen J, Ju Z, Zhang D, Chen X, Vellano CP, Jeong KJ, Ng PK, et al. Rational combination therapy with PARP and MEK inhibitors capitalizes on therapeutic liabilities in RAS mutant cancers. Sci Transl Med. 2017;9(392):10.1126/scitranslmed.aal5148
- See AL, Chong PK, Lu SY, Lim YP. CXCL3 is a potential target for breast cancer metastasis. Curr Cancer Drug Targets. 2014;14(7):294–309. doi:10.2174/1568009614666140305222328.
- Amiri KI, Ha HC, Smulson ME, Richmond A. Differential regulation of CXC ligand 1 transcription in melanoma cell lines by poly(ADP-ribose. Polymerase-1. Oncogene. 2006;25(59):7714–7722. doi:10.1038/sj.onc.1209751.