
ABSTRACT
Fluorouracil/5-flourouracil (5FU) is a first-line chemotherapy drug for many cancer types; however, its associated toxicities contribute to poor quality of life and reduced dose intensities negatively impacting patient prognosis. While obesity remains a critical risk factor for most cancers, our understanding regarding how obesity may impact chemotherapy’s toxicities is extremely limited. C56BL/6 mice were given high fat (Obese) or standard diets (Lean) for 4 months and then subjected to three cycles of 5FU (5d-40 mg/kg Lean Mass, 9d rest) or PBS vehicle control. Shockingly, only 60% of Obese survived 3 cycles compared to 100% of Lean, and Obese lost significantly more body weight. Dihydropyrimidine dehydrogenase (DPD), the enzyme responsible for 5FU catabolism, was reduced in obese livers. Total white blood cells, neutrophils, and lymphocytes were reduced in Obese 5FU compared to Lean 5FU and PBS controls. While adipocyte size was not affected by 5FU in Obese, skeletal muscle mass and myofibrillar cross section area were decreased following 5FU in Lean and Obese. Although adipose tissue inflammatory gene expression was not impacted by 5FU, distinct perturbations to skeletal muscle inflammatory gene expression and immune cell populations (CD45+ Immune cells, CD45+CD11b+CD68+ macrophages and CD45+CD11b+Ly6clo/int macrophage/monocytes) were observed in Obese only. Our evidence suggests that obesity induced liver pathologies and reduced DPD exacerbated 5FU toxicities. While obesity has been suggested to protect against cancer/chemotherapy-induced cachexia and other toxicities, our results demonstrate that obese mice are not protected, but rather show evidence of increased susceptibility to 5FU-induced cytotoxicity even when dosed for relative lean mass.
Introduction
The prevalence and incidence of cancer and the number of patients receiving chemotherapy have increased over the past several decades.Citation1 While novel and efficacious cancer therapies continue to emerge, traditional cytotoxic chemotherapies remain at the forefront of anticancer strategies.Citation2 Unfortunately, chemotherapeutics have pervasive off-target effects concomitant with patients developing chemoresistance which hamper efficacy.Citation3 Among these side effects are reduced blood counts, debilitating fatigue and weakness, and cachexia – the loss of lean mass secondary to disease.Citation4–6 In addition to the underlying cancer, patients often have preexisting conditions and co-morbidities that hold the potential to exacerbate these off-target effects.Citation7,Citation8 Unfortunately, inherent difficulty in studying these converging conditions has led to a dearth of investigations examining the implications of preexisting comorbidities on cytotoxic chemotherapies.
5 fluorouracil (5FU), either alone or in combination treatment, is a first-line therapy for colon, breast, head and neck, and pancreatic cancers.Citation2 Improved understanding of 5FU has led to superior strategies to enhance its therapeutic efficacy; however, much less is known about its off-target effects.Citation9–11 5FU is an antimetabolite, a uracil analogue, that incorporates into DNA/RNA to inhibit proliferation through inhibiting thymidylate synthase activity.Citation12,Citation13 Given its direct impact on proliferating cells, 5FU inhibits cancer cell growth, but with little specificity. While 5FU is cytotoxic, when catabolized in the liver by the dihydropyrimidine dehydrogenase (DPD) enzyme, it is excreted in the urine as nontoxic α-fluoro-β-alanine.Citation13 However, patients with DPD deficiency have been demonstrated to experience severe toxicities with a prolonged 5FU half-life.Citation14
Currently, over 40% of American adults are obese and obesity is linked to an increased risk for 13 different cancer types including breast and colorectal cancers.Citation15–17 Given this, obese individuals are increasingly more likely to undergo chemotherapy. Obesity negatively impacts metabolic plasticity and homeostasis as well as overall immune health.Citation18,Citation19 Consequently, between 50% and 90% of obese patients have nonalcoholic fatty liver disease (NAFLD), which disrupts liver enzymes resulting in impaired or altered drug metabolism.Citation20,Citation21 However, the impact of NAFLD on chemotherapeutic drug metabolism and consequential toxicity has been vastly understudied. Yet, it has been speculated that the increased cancer mortality that is associated with an obese state is in part attributable to the undertreatment of the patient.Citation22 While our understanding of 5FU’s off-target effects is improving, significant gaps remain contributing to the continued reduction in quality of life and subsequent dose modifications, especially in the context of an obese state. The purpose of the current study was to examine the impact of obesity on the toxicities of chemotherapy in liver, adipose, and skeletal muscle tissues as well as circulating immune cells.Citation23 While several dosing strategies have been suggested (e.g. body weight, body surface area, and lean mass), we aimed to dose all mice based on lean mass to minimize risk of overdosing obese mice (~90% greater body weight, ~45% greater BSA, and ~30% greater lean mass). We hypothesized that while an obesity paradox has been postulated,Citation24,Citation25 the susceptibility to 5FU-induced toxicities would be greater in obese mice even when dosed for lean mass.
Results
Obesity exacerbated body weight loss and decreased survival with 5FU
As expected, there were main effects (p < .0001) of Obese to have increased body weight by 89.5%, body surface area by 46.3%, and lean mass by 33.5% prior to the initiation of treatment (). Mice were then randomized and subjected to three cycles of 5FU or PBS (). Survival probability was assessed, and unexpectedly, obesity significantly (p = .025) reduced survival; indeed, 40% (n = 4/10) of Obese mice could not complete 3 cycles of 5FU and were euthanized for tissue collection once they reached >15% BW loss per University of South Carolina IACUC guidelines. All Lean 5FU animals (100%; n = 5/5) – and PBS controls (n = 15/15) – survived 3 cycles consistent with our previous findings ().Citation10 As we expected, there were main effects of 5FU to induce relative body weight loss (p < .0001; %); () and total body weight loss (p < .0001; grams;) (). Interestingly, there was a main effect of Obese to have increased total body weight loss (p = .002; grams) (); a significant interaction (p = .05) was detected and revealed that within 5FU, Obese had significantly greater body weight loss compared to Lean ().
Figure 1. Experimental design, survival, and body weight change with 5 fluorouracil treatment. a) Experimental timeline. Mice underwent dual-energy x-ray absorptiometry (DEXA) analysis prior to each 5FU dosing cycle on days −1, 12, and 26. Mice were given 5 i.p. injections of either 40 mg/kg lean mass of 5FU dissolved in PBS or empty PBS control. Mice were euthanized 48 hours following the last dose of 5FU/PBS. b) Probability of survival in lean and obese mice given 3 cycles of 5FU. c) Absolute body weight change given in grams. Values are given as *Pre* – *Post*. d) Relative body weight change given in percent from baseline. Values are given as (*Pre* – *Post*)/*Pre*. Values are means ± SEM. Two-way ANOVA and LSD post hoc and multiple comparisons. *Indicates significant difference in survival. #Indicates main effect of 5FU. %Indicates main effect of Obese. Different letters signify statistically significant differences with an interaction. Significance was set as p < .05.
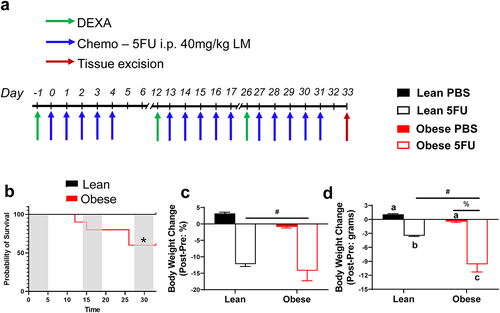
Table 1. Animal characteristics prior to each 5FU dosing cycle.
Obesity increased susceptibility to 5FU-induced cytopenia
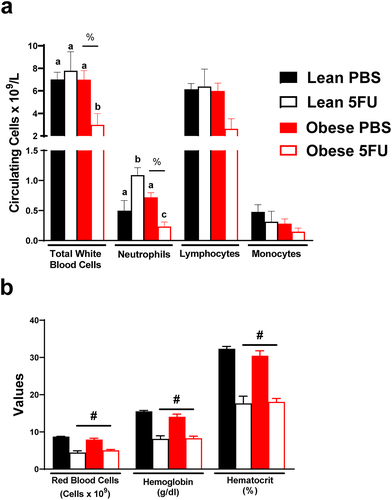
Next, we sought to examine the impact of obesity on the established deleterious effects of 5FU on blood cell counts – a key clinical outcome for dose intensity modifications. There was a main effect (p = .036) of Obese to have reduced white blood cells. Additionally, a significant interaction (p = .038) revealed that within Obese, 5FU had reduced white blood cells compared to PBS () and that within 5FU, Obese had decreased white blood cells compared to Lean. Similarly, there was a main effect (p = .007) of Obese to have reduced circulating neutrophils (). A significant interaction (p < .0001) revealed that within Obese, 5FU had reduced neutrophils compared to PBS (), and within 5FU, Obese neutrophils were decreased compared to Lean (). Interestingly, it was also revealed that within Lean, 5FU increased neutrophils compared to PBS; however, one cycle of 5FU induced neutropenia as previously demonstrated (Supplemental Figure 1).Citation9 Total lymphocytes followed a similar trend as total white blood cells and neutrophils; however, this did not achieve statistical significance (main effect of Obese – p = .055; interaction – p = .07; ). Circulating monocytes did not show any semblance of statistical differences (). It was also observed that one cycle of 5FU decreased total white blood cells, neutrophils, and lymphocytes, regardless of weight status (Supplementary figure 1). Last and as expected, there were main effects (p < .0001) for 5FU to decrease red blood cells, hemoglobin, and hematocrit regardless of weight status (). Together, these results highlight that an obese phenotype prolongs susceptibility to 5FU-induced cytopenia and did not protect against 5FU-induced anemia.
Figure 2. Blood counts. a) Circulating total white blood cells and white blood cell subsets – neutrophils, lymphocytes, and monocytes given as the number of cells x109/L. b) Circulating red blood cells given as number of cells x1012/L. Circulating hemoglobin counts given as grams/dL. Hematocrit percentage (%). Values are means ± SEM. Two-way ANOVA and LSD post hoc and multiple comparisons. #Indicates main effect of 5FU. %Indicates main effect of Obese. Different letters signify statistically significant differences with an interaction. Significance was set as p < .05.
Obesity induced NAFLD and liver dihydropyrimidine dehydrogenase expression
Based on the reduced survival and exacerbated cytopenia, we sought to examine the impact of obesity on liver health given its role in 5FU metabolism. There was a main effect (p < .0001) of Obese to have increased liver weight (), concomitant with signs of NAFLD (). We also observed main effects of Obese to have increased kidney (p < .0001) and heart (p < .0001) weights and a main effect (p = .0003) of 5FU to have decreased kidney weight (). Interestingly, we observed a main effect (p = .0057) of 5FU to have increased spleen weight; this was largely due to the increase seen in the Lean 5FU group as an interaction (p = .04) showed that within Lean, 5FU had increased spleen weight compared to PBS () but this same effect was not observed for Obese 5FU.
Figure 3. High fat diet-induced liver dysfunction associated with obesity. a) Organ weights excised from mice and euthanasia. b) Liver sections were stained with Hematoxylin and Eosin. Representative images are 4x with 20x inserts demonstrating signs of nonalcoholic fatty liver disease. Scale bars are 100 μm (20x) and 200 μm (4x). c) Liver gene expression of dihydropyrimidine dehydrogenase (DPYD) and d) collagen type 3 alpha 1 (Col3a1). Gene values were normalized to vehicle treated controls and compared to five reference targets. e) Liver lipid content measured using Folch’s extraction method in frozen liver. f) Quantified liver protein expression of DPD and western blot images. Values are means ± SEM. Two-way ANOVA and LSD post hoc and multiple comparisons. #Indicates main effect of 5FU. %Indicates main effect of Obese. Different letters signify statistically significant differences with an interaction. Significance was set as p < .05.
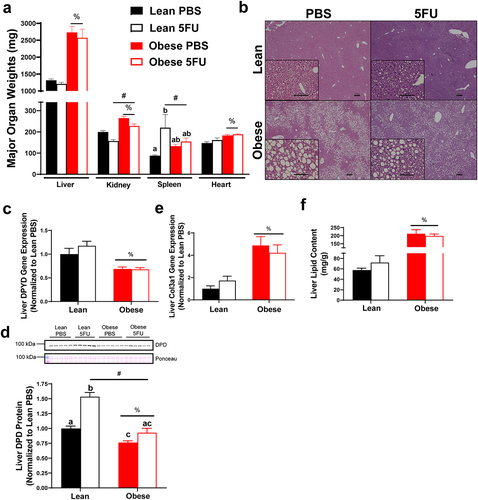
There was a main effect (p < .0001) of Obese to have reduced liver gene expression of dihydropyrimidine dehydrogenase (dpyd) irrespective of 5FU treatment (). To corroborate the dpyd gene expression data, we found a main effect (p < .0001) of Obese to have reduced DPD protein expression and a main effect (p < .0001) of 5FU to increase DPD. A significant interaction (p = .004) revealed that within PBS, Obese reduced DPD protein compared to Lean, and within 5FU, Obese was reduced compared to Lean, whereas within Lean, 5FU increased DPD protein compared to PBS ().
Additionally, there was a main effect (p = .0003) of Obese to have increased gene expression of liver collagen, col3a1 (), and a main effect (p < .0001) of Obese to have increased total liver lipid content () irrespective of 5FU treatment, further demonstrating high fat diet-induced NAFLD. Our obese mice showed signs of metabolic dysfunction with a main effect (p < .0001) of Obese to have elevated circulating insulin, whereas chemotherapy treated mice showed reduced insulin evidenced by a main effect (p = .008) of 5FU (Supplemental figure 2).
5FU decreases muscle mass and myofibrillar cross sectional area in both lean and obese mice
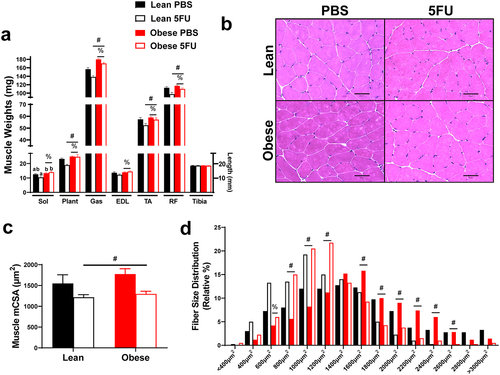
Given the observed loss in body weight and relevance of cachexia for patient quality of life and survival, we sought to examine the impact of obesity and 5FU on skeletal muscle mass. There were main effects of Obese to have increased Sol (p = .002), Plant (p = .002), Gas (p < .0001), EDL (p = .021), TA (p = .035), and RF (p = .004) weights with an additional main effect of 5FU to reduce the weights of the Plant (p = .046), Gas (p < .0001), TA (p = .025), and RF (p = .0003; ). A significant interaction (p = .036) was observed and revealed that within 5FU, Obese had increased Sol weight compared to Lean (). Tibia length was similar across all groups. There was a main effect (p = .009) of 5FU to have decreased mean myofibrillar cross-sectional area (CSA) in the TA irrespective of weight status, further demonstrating obesity did not protect against 5FU-induced cachexia (). This was also reflected in the fiber size distribution with a leftward shift in fiber size in both Lean and Obese demonstrated by main effects (p < .05) of 5FU to increase percent of fibers at 800 µm2, 1000 µm2, and 1200µm2, while decreasing percent of fibers at 1600µm2, 1800µm2, 2000µm2, 2200 µm2, 2400 µm2, 2600 µm2 ().
Figure 4. Skeletal muscle mass and cross-sectional area. a) Hindlimb (soleus, plantaris, gastrocnemius, tibialis anterior, extensor digitorum longus, rectus femoris) muscle weights taken at tissue excision given in milligrams (mg). Tibias were cleared of excess tissue and lengths measure in millimeters using vernier calipers. b) Representative hematoxylin and eosin (H&E) images of frozen tibialis anterior (TA) 10–12 μm cryosections. c) Mean myofibrillar cross sectional area (CSA) of the TA calculated from H&E stains given in micrometers (μm2). d) Distribution of TA cross sectional area calculated from H&E stains given as a relative distribution (%) across increasing μm2 sizes. Values are means ± SEM. Two-way ANOVA and LSD post hoc and multiple comparisons. #Indicates main effect of 5FU. %Indicates main effect of Obese. Different letters signify statistically significant differences with an interaction. Significance was set as p < .05.
Obesity perturbs skeletal muscle monocyte and macrophage abundance and phenotype
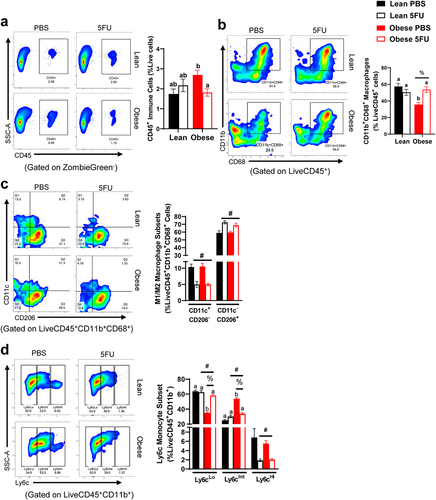
We have previously shown that one cycle of 5FU disrupts the immunophenotype of skeletal muscle,Citation9 so we sought to examine if obesity impacts skeletal muscle susceptibility to 5FU-induced skeletal muscle leukopenia. Skeletal muscle flow cytometry gating rubrics are shown in Supplemental figures 3 and 4. While we have previously shown that one cycle of 5FU decreases the total abundance of CD45+ immune cells in skeletal muscle,Citation9 this was not apparent after three cycles in Lean mice. While no main effects were observed, we did observe a significant interaction (p = .019) which revealed that within Obese, 5FU decreased CD45+ immune cells compared to PBS (). There was a main effect (p = .012) for Obese to have decreased relative abundance of CD11b+CD68+ macrophages with an observed significant interaction (p = .0012) revealing that within PBS, Obese had reduced CD11b+CD68+ macrophages compared to Lean and within Obese, 5FU had increased CD11b+CD68+ macrophages compared to PBS (). There were main effects of 5FU to have decreased M1-like CD11c+CD206− macrophages (p < .0001) and increased M2-like CD11c−CD206+ macrophages (p < .0001; ). Interestingly, there were main effects for both 5FU and Obese to impact Ly6cLo (p < .0001) and Ly6cInt (p < .0001) monocytes with an observed interaction (p < .0001) () revealing that within Obese, PBS had reduced Ly6cLo monocytes compared to 5FU, and similarly within PBS, Obese had reduced Ly6cLo monocytes compared to Lean (). Conversely, within Obese, PBS had increased Ly6cInt monocytes compared to 5FU and within PBS, Obese had increased Ly6cInt monocytes compared to Lean (). Lastly, there was a main effect (p = .0002) of 5FU to reduce Ly6cHi monocytes ().
Figure 5. Skeletal muscle immune cells. a) Representative flow plots of Cluster of Differentiation (CD) 45+ immune cells in all groups and quantified results shown as percent abundance among live cells. b) Representative flow plots of CD11b+CD68+ macrophages in all groups and quantified results shown as percent abundance among LiveCD45+ cells. c) Representative flow plots of CD11c x CD206 in all groups and quantified results shown as the percent abundance among LiveCD45+CD11b+CD68+. Quadrants indicate 4 distinct quantifiable populations, Q1: CD11c+CD206−, Q2: CD11c+CD206+, Q3: CD11c−CD206+, and Q4: CD11c−CD206−. d) Representative flow plots of Ly6cLo/Int/Hi monocytes/macrophages in all groups and quantified results shown as the percent abundance among LiveCD45+CD11b+ cells. Tertiles indicate 3 quantifiable populations, Ly6cLo, Ly6cInt, and Ly6cHi. Values are means ± SEM. Two-way ANOVA and LSD post hoc and multiple comparisons. #Indicates main effect of 5FU. %Indicates main effect of Obese. Different letters signify statistically significant differences with an interaction. Significance was set as p < .05.
5FU decreases inflammatory cytokine gene expression only in obese mice
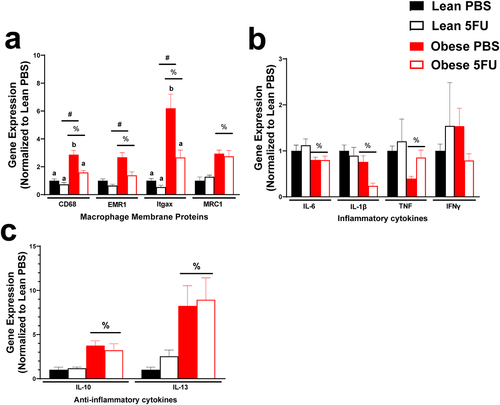
Continuing to the inflammatory environment of skeletal muscle, we examined gene expression of critical macrophage surface proteins, CD68, EMR1 (F4/80), Itgax (cd11c), and MRC1 (CD206) as well as pro- (IL-6, IL-1β, TNFα, and IFNγ) and anti- (IL-10 and IL-13) inflammatory cytokines. There were main effects of Obese to have increased CD68 (p < .0001), EMR1 (p = .0005), Itgax (p = .0002), and MRC1 (p < .0001) (). Additionally, there were main effects of 5FU to have decreased CD68 (p = .0055), EMR1 (p = .011), Itgax (p = .026), but not MRC1 (p = .89) (). There was a significant interaction (p = .033) where within PBS, Obese had increased CD68 compared to Lean and then within Obese, 5FU had reduced CD68 compared to PBS. Also, there was a significant interaction (p = .049) where within PBS, Obese had increased Itgax compared to Lean and then within Obese, 5FU had reduced Itgax compared to PBS (). There were main effects of Obese to have reduced expression of pro-inflammatory genes IL-6 (p = .012), IL-1β (p = .003), and TNFα (p = .03) () and there was a main effect of 5FU to have reduced IL-1β (p = .03) (). Interestingly, there were main effects for Obese to increase anti-inflammatory cytokines IL-10 (p = .0007) and IL-13 (p = .0065) genes, which were not affected by 5FU (p = .77, p = .63) ().
Figure 6. Skeletal muscle inflammatory gene expression. a) Relative gene expression of macrophage surface proteins, cluster differentiation (CD) 68, EGF-like module-containing mucin-like hormone receptor-like 1 (EMR1; F4/80), Integrin, alpha X (Itgax; CD11c), and Mannose receptor C-type 1 (MRC1; CD206). b) Relative gene expression of inflammatory cytokines, Interleukin (IL) 6, IL-1β, tumor necrosis factor, and interferon (IFN) γ. c) Relative gene expression of anti-inflammatory cytokines IL-10 and IL-13. Gene values were normalized to vehicle treated controls and compared to five reference targets. Values are means ± SEM. Two-way ANOVA and LSD post hoc and multiple comparisons. #Indicates main effect of 5FU. %Indicates main effect of Obese. Different letters signify statistically significant differences with an interaction. Significance was set as p < .05.
5FU decreases adipocyte size and adiposity only in lean mice
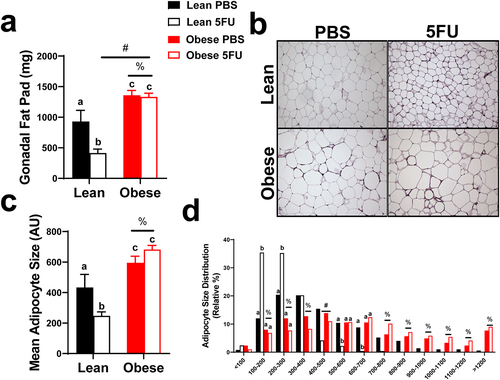
Lastly, we sought to determine if the wasting effects of 5FU were specific to lean tissue by examining the impact of obesity and 5FU on adipose tissue. As expected, there were main effects of Obese to have greater adipose tissue weight (p < .0001), () and adipocyte size (p < .0001), (). Conversely, there was a main effect (p = .01) of 5FU to have decreased gonadal fat pad weight. Significant interactions were discovered for gonadal fat weight (p = .02) and adipocyte size (p = .01); within Lean, 5FU had decreased fat pad weight and adipocyte size compared to PBS and within 5FU, Obese had increased fat pad and adipocyte size compared to Lean ().
Figure 7. Adipocyte size. a) gonadal fat pad weight taken at tissue excision given in milligrams (mg). b) Representative hematoxylin and eosin (H&E) images of fixed gonadal adipose tissue. c) Mean adipocyte size calculated from H&E stains given in arbitrary units (AU). d) Distribution of adipocyte size calculated from H&E stains given as a relative distribution (%) across arbitrary sizes. Values are means ± SEM. Two-way ANOVA and LSD post hoc and multiple comparisons. #Indicates main effect of 5FU. %Indicates main effect of Obese. Different letters signify statistically significant differences with an interaction. Significance was set as p < .05.
5FU did not impact adipose tissue inflammation however obesity increases inflammatory gene expression
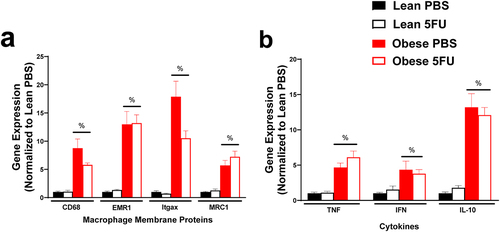
We have previously shown that 5FU alters skeletal muscle and colon tissue inflammation and inflammatory signaling,Citation9,Citation10 but little is known regarding 5FU’s impact on adipose tissue. As expected, there were main effects of Obese to have increased macrophage genes CD68 (p < .0001), EMR1 (p < .0001), Itgax (p < .0001), and MRC1 (p < .0001) () and increased cytokines TNFα (p < .0001), IFNγ (p = .013), and IL-10 (p < .0001) (); however, the inflammatory status of adipose tissue with obesity did not appear to be impacted by 5FU (i.e. there was no main effect of 5FU).
Figure 8. Adipose tissue inflammatory gene expression. a) Relative gene expression of macrophage surface proteins, cluster differentiation (CD) 68, EGF-like module-containing mucin-like hormone receptor-like 1 (EMR1; F4/80), Integrin, alpha X (Itgax; CD11c), and Mannose receptor C-type 1 (MRC1; CD206). b) Relative gene expression of inflammatory cytokines, tumor necrosis factor (TNF) α, and interferon (IFN) γ, and anti-inflammatory cytokine IL-10. Gene values were normalized to vehicle treated controls and compared to five reference targets. Values are means ± SEM. Two-way ANOVA. %Indicates main effect of Obese. Significance was set as p < .05.
Discussion
Improving our understanding of the consequences of cancer therapy will foster the development of novel cancer treatments and therapeutics to mitigate anti-cancer treatment toxicities. Importantly, not all cancer patients have the same preexisting conditions/comorbidities, nor do they respond consistently to the same treatments. Therefore, the current study aimed to understand the impact of obesity on the off-target effects of chemotherapy. Our results demonstrated that Obese mice had reduced liver dpyd enzyme gene expression and DPD protein – the enzyme responsible for 5FU catabolism – which likely contributed to reduced survival and increased systemic and skeletal muscle immune cell cytotoxicity with 5FU. Further, while our mice were dosed based on relative lean mass, 40% of the Obese mice were unable to sustain 3 cycles of 5FU. Although an obesity paradox has been postulated, the findings from the current study highlight that an obese phenotype was not protective or beneficial and even worsened several 5FU-associated toxicities and survival. Importantly, this suggests reconsidering the current treatment paradigm for 5FU administration and underscores the importance of personalized medicine. While the current study aimed to examine the impact of obesity on chemotherapy toxicities alone, the results from the current study highlight a need for additional clinical examinations and more mechanistic work using tumor-bearing mice.
Currently, the literature on the impact of weight status on chemotherapy-induced toxicities is sparse and equivocal. Evidence demonstrating improved survival with increasing body mass indexes (BMI) has led to the emergence of the Obesity Paradox – obesity is linked with an increased risk for developing cancer but also linked with better survival following a cancer diagnosis–; however, this hypothesis is contentious.Citation22,Citation26,Citation27 One potential explanation for this paradox is patients having ‘more weight to spare’ which would offset/delay the severity of cachexia.Citation24 Conversely, limiting chemotherapy dosages for patients with larger body surface areas (BSA; 2.0–2.2 m2) is common practice clinically, despite a push to provide larger patients with full BSA dosages.Citation28 This comes from evidence showing that capping chemotherapy dosing did not reduce treatment toxicities or improve prognosis.Citation28–30 This recommendation itself is paradoxical given the proposed improved survival observed with higher BMIs. Furthermore, it is not abundantly clear if the improved survival with a high BMI is consistent when dosages are capped. To the best of our knowledge, the current study design is the first of its kind and demonstrated that obesity was not protective against 5FU toxicities, but rather reduced survival and increased several toxicities. While certain limitations in our study exist (i.e., animal model, severity of obesity, examination of non-tumor bearing mice, and limited mechanistic insight), it is an important first step in the field and points to a need for more clinical and preclinical investigations into the impact of obesity on the efficacy and susceptibility to toxicity of common anti-cancer drugs.
A reduction in blood cell counts is among the most common and detrimental side effects of anti-cancer treatments. Here, we show that while white blood cells are dramatically reduced after one cycle of 5FU, these counts were returned following three cycles in Lean mice. Interestingly, Obese mice had reduced white blood cells following both one and three cycles. Our group and others have previously shown that 5FU induces white blood cell loss and neutropenia by depleting immune cells in bone marrow and inducing cell cycle arrest.Citation9 Additionally, this toxicity has been linked to DPD enzyme activity and catabolism of 5FU.Citation14,Citation31 We have extended this to show that livers from Obese mice have reduced dypd mRNA expression and DPD protein expression concomitant with reduced white blood cells throughout three cycles of 5FU. Interestingly, Lean mice increased DPD protein expression consistent with reports of improved 5FU clearance and reduced 5FU toxicity and efficacy throughout several cycles of chemotherapy. This increase was not observed with Obese which would help explain the sustained cytotoxicity. It is possible that this cytotoxicity may improve 5FU’s anti-cancer efficacy; however, this requires additional investigation involving tumor-bearing mice.
The progression of NAFLD with obesity is well established, yet, whether obesity induced NAFLD contributes to increased chemotherapy-induced toxicities is not as clear. In the current study, we show that livers from Obese mice, regardless of 5FU cycle, have increased fibrotic collagen gene, Col3a1, with reduced dpyd expression, reduced DPD protein, and increased liver lipid content. While a mechanistic link cannot be made from the current study, to the best of our knowledge, we are the first to demonstrate reduced DPD enzyme gene and protein expression with obesity. It is currently unknown if obesity is accompanied by reduced liver DPD in the clinic. Our result highlights a need for future studies understanding the impact of weight status, liver function, and overall metabolism on chemotherapy pharmacology and toxicity. Additionally, our results further support the narrative that dosing 5FU should be based on DPD enzyme expression or activity.Citation14 Further, there is a concerning dearth of clinical information on the impact of obesity on uracil and/or 5FU metabolism.
While a loss of white blood cells is clinically vital to indicate chemotherapy dose modification and the patient’s susceptibility to further complications with treatment, a loss of red blood cells contributes to anemia and functional deficits that plague cancer patients throughout treatment and often in the years following. In the current study, we show that obesity had no direct impact on 5FU-induced loss of red blood cells; however, there was an effect of 5FU cycle as red blood cells continued to drop after one cycle to be further reduced after three cycles, which has been reported in the clinic.Citation32 5FU-induced anemia likely contributes to the complexities of cancer and chemotherapy-related fatigue.Citation33–38 The etiology of 5FU-induced anemia is not well understood but is most often associated with 5FU’s toxicity to the hematopoietic system.Citation9,Citation12,Citation32 Further, anemia has been identified as an important influence in the pathology of unintentional wasting with cancer, termed cachexia.Citation39,Citation40 Our results demonstrate that obesity was not protective against 5FU-induced anemia.
Cachexia is the unintentional loss of body weight, particularly lean mass, that accompanies chronic disease.Citation39 The etiology of cancer-cachexia is complex, and depends on the underlying cancer, the patient’s age and comorbidities, and the treatment strategy. While 5FU containing therapies, FOLFOX/FOLFIRI, have been demonstrated to induce cachexia,Citation41–43 5FU monotherapy’s impact on muscle mass has appeared less severe.Citation9,Citation11 Despite this, the results from the current study demonstrate that three cycles of 5FU was sufficient to induce muscle mass loss and myofibrillar CSA loss in both Lean and Obese mice. While these results do not attempt a mechanistic explanation for 5FU-induced atrophy, 5FU has been shown to suppress phospho-Akt (S473), increase phospho-P38, and reduce myoblast cell viability which all have been demonstrated to promote muscle mass loss and myopathy with cachexia.Citation11,Citation42 Additionally, 5FU has been demonstrated to disrupt muscle mitochondria which also can contribute to muscle mass loss.Citation44,Citation45 It is also likely that the dose and dosing regimen contributes to the equivocal results pertaining to 5FU-induced muscle mass loss as there is currently no established model for chemotherapy dosing in preclinical study designs. Further, while Obese mice had increased muscle mass, this was not protective against 5FU induced muscle mass loss. Unfortunately, while muscle mass was not spared, the maladaptive increase in adipose tissue size and inflammation was not affected by 5FU. Together, this suggests the weight loss observed with obesity is even more catastrophic given the loss of lean mass and sparing of fat mass which would exacerbate function loss and metabolic dysfunction. Future studies are needed to examine the mechanistic overlap between obesity, cancer, and 5FU-induced skeletal muscle perturbations related to mitochondria or overall metabolic health.
Although the impact of 5FU on muscle mass remains equivocal, we confirm our previous findings that 5FU-induced cytopenia extends beyond circulation to impact skeletal muscle’s immune cell pool.Citation9 Indeed, we extend our previous findings to show that while one cycle of 5FU reduced total skeletal muscle CD45+ immune cells (preplanned t-test, p = .036, data not shown), this returned to baseline following three cycles. Interestingly, Obese mice without 5FU had elevated CD45+ immune cells, Ly6cInt monocytes/macrophages, and inflammatory gene expression, indicating increased immune cells and baseline inflammation. This increase in immune cells did not correspond to an increase in CD11b+CD68+ macrophages; however, these values are representative of relative abundance (%) rather than total counts. Increased macrophages and T-cells have been previously reported in skeletal muscle with obesity, while mast cells, eosinophils, neutrophils, B cells, NK cells were not changed with obesity.Citation46 We extend our previous findings to show that 5FU reduced monocytes and macrophages, particularly reducing inflammatory CD11b+Ly6cHi and CD68+CD11c+CD206− cells after three cycles. Together, our data demonstrate that obesity does not protect against 5FU-induced leukopenia, but rather demonstrates certain evidence of perturbed tolerance based on altered baseline (Obese PBS). One key physiological role of immune cells in skeletal muscle is the repair of muscle following damage, whether pathological or exercise induced. We have previously shown that exercise can improve muscle mass and function during cancer;Citation36,Citation47 however, whether these adaptations are maintained with concomitant cytotoxic chemotherapy remains elusive.Citation48
As previously stated, the current study has important limitations and delimitations. Given the lack of preclinical investigations into the impact of obesity on chemotherapy toxicities, it was important to examine these two key variables prior to its examination with a third – tumor presence. This comes with an important limitation that the presence of a tumor will elicit its own metabolic and inflammatory perturbations. Recently, the overlap of chemotherapy-toxicities and cancer associated wasting has been eloquently examined;Citation41,Citation43,Citation49 however, additional work is needed. Introducing high fat diet into tumor-bearing mice to counteract cachexia has been previously examined;Citation50 however, clinical investigations have determined traditional nutritional interventions cannot prevent or improve cachexia.Citation39 To the best of our knowledge, there are no preclinical studies examining the impact of obesity on cachexia progression when obesity is achieved prior to tumor or chemotherapy exposure; however, clinical investigations have highlighted that obese cancer patients experience a loss of muscle mass without particular changes to total body weight.Citation51,Citation52 The current study is also limited in its mechanistic insight. Additional work is needed to address causal effect of obesity on DPD deficiency as well as the causal link between the drop in DPD with obesity and chemotherapy toxicities. While important gene mutations have been extensively characterized,Citation12,Citation14 there is a dearth of information on the behavioral or environmental determinants of liver DPD expression.
Conclusions
The obesity paradox is likely more nuanced, as has been suggested,Citation25 and a gradation is important when delineating the impact of weight status as the animals in the current study were severely obese (~60 g BW, ~50% body fat). Further, the underlying condition and cancer-type appear to play a critical role as well.Citation53 The current study demonstrated that obese mice lost similar muscle mass and greater body weight with 5FU when compared to lean mice. Obese mice also had perturbed immune cell populations compared to their lean counterparts. Importantly, obese livers are likely unable to metabolize 5FU efficiently, leading to prolonged and increased toxicities. These data suggest obese mice are not protected against 5FU-induced cachexia or skeletal muscle leukopenia and are more susceptible to certain 5FU-induced cytotoxicity likely due to obesity-induced liver perturbations. Further, these results urge additional work in this realm given the increasing prevalence of obesity and its relevance to cancer.
Materials and methods
Animals
Thirty male C57BL/6 mice were purchased from Jackson Laboratories at 8 weeks of age and housed in the Department of Laboratory Animal Resources at the University of South Carolina. Mice were group housed (5/cage) and kept on a 12:12 h cycle. Animals were placed on a purified AIN-76A (Bio-Serv; cat#: F1515; Pro: 18.2%, Fat: 5.1%, Carb: 65.2%, 3.79 kcal/gram) diet and allowed to acclimate to the new facility for 3 weeks. Mice were then given a high fat diet (HFD; Bio-serv, Cat#: F3282; Pro: 20.5%, Fat: 36.0%, Carb: 35.7%, 5.49 kcal/gram) for ~20 weeks (Obese) or maintained on AIN-76A diet (Lean). Mice were then randomized into two groups within each weight status, three cycles of 5FU (n = 5 Lean; n = 10 Obese) or PBS vehicle control (n = 5 Lean; n = 10 Obese). A separate cohort of 20 mice (n = 10 Lean; n = 10 Obese) were subjected to 1 cycle of 5FU to validate consistent results across publications.Citation9 Body weights were measured weekly, and mice were monitored for signs of distress (grooming, temperature, anorexia, and tremors). Animals that lost more than 15% body weight were considered ‘end-point’ according to our Institutional Animal Care and Use Committee (IACUC) policy. Survival was examined in all groups (N = 5 Lean PBS, n = 5 Lean 5FU, N = 10 Obese PBS, N = 10 Obese 5FU). Animals were given food and water ad libitum throughout the duration of the study. All animals were fasted 5 h prior to tissue collection. Mice were anesthetized with isoflurane and hindlimb skeletal muscles and select organs were carefully dissected, weighed, and either snap frozen in liquid nitrogen or placed in the appropriate buffers for flow cytometry analysis. Animals were euthanized by a cardiectomy following tissue excision while still under anesthesia. All animal experiments were approved by the University of South Carolina’s IACUC.
5-FU administration
We have previously demonstrated that male C56BL/6 mice can sustain three cycles of 5FU dosed at 35 mg/kg of body weight.Citation10 We then back calculated the dosages of 5FU for lean mass to be ~40 mg/kg of lean mass. Therefore, prior to the initiation of the treatments in the current study, all mice underwent dual-energy X-ray absorptiometry (DEXA; Lunar PIXImus) analysis to determine body composition. Total lean mass percentage was calculated from measured lean mass and total body weight. At the beginning of each dosing cycle, 5FU was solubilized in phosphate buffered saline (PBS; 7.4pH) at 4.0 mg/mL under gentle agitation at 37°C, sterile filtered (0.2 µm) and stored at 4°C for no longer than 7 days. Mice were then given i.p. injections of 5FU at 40 mg/kg of lean mass. Mice were subjected to DEXA analysis once prior to each dosing cycle to adjust for changes to relative lean mass percentage. The dose of 5FU was then calculated daily based on body weight corrected from relative lean mass percentage. Mice in the 3-cycle group were injected with 5FU for 1) 5d, rest 9d, 2) 5d, rest 9d, 3) 5d and euthanized 48 h following the last 5FU injection. Lean and obese vehicle controls were given i.p. injection of PBS (Lean/Obese PBS). Mice in the one cycle group were injected with 5FU for 5d and euthanized 48 h following the last 5FU injection.
Tissue collection
At the completion of the treatment period, animals were fasted for 5 h, anesthetized with ~2% isoflurane with 2 L/min O2. While sedated, the hindlimb muscles, soleus (Sol), plantaris (Plant), gastrocnemius (Gas), tibialis anterior (TA), extensor digitorum longus (EDL), and quadriceps (Quad) were excised, weighed, and either snap frozen in liquid nitrogen or placed in DMEM (Quad) on ice. Additionally, the rectus femoris (RF) was carefully teased away from the vastus lateralis, medialis, and intermedius and weighed prior to being placed in DMEM. Following skeletal muscle excision, the gonadal fat pad, spleen, kidney, liver, and heart were excised, weighed, and place either in 10% neutral buffered formalin or snap frozen in liquid nitrogen.
Blood analysis
For insulin measurements blood was collected with plain capillary tubes (Kimble; Cat# 2502) prior to anesthesia exposure via the tail vein. Serum insulin concentrations were analyzed according to the manufacturer’s instructions using an insulin ELISA kit (Mercodia, Winston Salem, NC). Blood was then also collected retro-orbitally prior to euthanasia while the mouse was sedated with 2% isoflurane, placed in an EDTA coated vacutainer, and stored briefly on ice until analysis. A complete blood count was performed using the VetScan HMT (Abaxis, Union City, CA, United States) for determination of white blood cells and subsets including lymphocytes, monocytes, and neutrophils, as well as red blood cells, hemoglobin, and hematocrit.
RNA isolation and RT PCR
RNA isolation, cDNA synthesis, and RT-PCR were performed as previously described.Citation9 RNA isolation from liver and rectus femoris was performed using TRIzol (Life Technologies; Cat# 15596018), isopropanol (MPbiomedicals; Cat# 194006), and chloroform (Fisher Chemical; Cat# C298). RNA isolation from adipose tissue was performed using the RNeasy Lipid Tissue Mini Kit (Qiagen; Cat# 74804) according to the manufacturer’s instructions. RNA sample quality and quantities were verified using a Nanodrop One Microvolume UV-Vis Spectrophotometer (Thermo Fisher Scientific, Waltham, MA, United States) and determined to be of good quality based on A260/A280 and 260/230 values (>1.8) prior to cDNA synthesis using High-capacity Reverse Transcriptase kit (Applied Biosystems, Cat# 4368814). Probes from DPYD, TGFβ, Col3a1, Col1a1, Emr1 (F4/80), CD68, Itgax (CD11c), Mrc1 (CD206), TNFα, IFNγ, IL-10, IL-1β, IL-6, and IL-13 as well as housekeeping genes Hmbs, Hprt, B2M, TBP, H2afv, and 18s were purchased from Applied Biosystems. Quantitative RT-PCR analysis was carried out as per the manufacturer’s instructions using Taq-Man Gene Expression Assays on a Qiagen Rotor-Gene Q. Data were normalized to vehicle treated controls and compared to five reference targets (Hmbs, B2M, TBP, H2afv, and 18s), which were evaluated for expression stability using GeNorm.
Western blotting
Liver protein isolation and western blotting was completed as previously described.Citation54 Frozen liver tissue (n = 5–10) was homogenized in Mueller buffer containing a protease inhibitor cocktail (SigmaAldrich, St. Louis, MO). Total protein concentration was determined by the Bradford method. 20 μg of crude liver protein homogenates were separated by SDS-PAGE using precast 8–16% SDS-polyacrylamide gels (Bio-rad Cat#:5671105). Once proteins were fractionated, the proteins were electrophoretically transferred to a PVDF membrane with a Genie Blotter (IDEA Scientific, Minneapolis, MN). Membranes were then stained with Ponceau S solution to verify equal protein loading and transfer efficiency. Membranes were washed and blocked for 1 hr in 5% nonfat milk in Tris-buffered saline-0.1% Tween-20 (TBST). Primary antibody for DPD (Abcam, Cat#: ab180609) was diluted 1:1000 in 5% milk TBST. Membranes were then incubated in primary antibody overnight at 4°C with gentle agitation. Membranes were washed and incubated in secondary anti-rabbit (Cell Signal, Cat# 7074) diluted 1:3000 in 5% milk TBST for 1 hr at room temperature. An enhanced chemiluminescent substrate for detection of horseradish peroxidase was used to visualize the antibody–antigen interaction, which was visualized using the Syngene: G-Box. Images were analyzed by determining the integrated optical density of each band using ImageJ (NIH software).
Flow cytometry
Isolation of muscle immune cells and flow cytometry were performed as previously described.Citation9 A single-cell suspension of cells was prepared in PBS and stained for dead cells using Zombie Green™ (BioLegend, San Diego, CA; Cat#: 423111) following the manufacturer’s instruction. Cells were then suspended in flow buffer (5% FBS, 100 mM Hepes, 2 mM EDTA) and incubated with Fc-block against CD16 and CD32 (BioLegend, Cat#101302) before fluorescent staining. Cells were split into two panels and stained with fluorescently labeled antibodies from BioLegend. The two panels run were 1) “Monocyte Infiltration” CD45 (PE; Cat#:103106), CD11b (APC; Cat#:101211), CD64 (PE/Cy7 Cat#:139314), CD68 (APC/Cy7 Cat#:137024), and Ly6c (PerCP/Cy5.5; Cat#128012) and then 2) “Macrophage Polarization” CD45 (PE/Cy7 Cat#:103114), CD11b (APC; Cat#:101211), CD68 (APC/Cy7 Cat#:137024), CD206 (PE; Cat#141706), and CD11c (PerCP/Cy5.5; Cat#:117328) – ZombieGreen™ (Live/Dead) emits in the FITC detector. Cell markers were selected based on the current understanding of skeletal muscle monocyte/macrophage populations.Citation9,Citation55,Citation56 Cells were washed with PBS and then resuspended in flow buffer for analysis. Cell populations were measured using a FACS Aria II cell sorter and analyzed using FlowJo V10.8.1 (BD Biosciences, Ashland, OR, United States). Prior to FlowJo analysis, spectral compensation was performed using Invitrogen UltraComp eBeads™ (Life technologies, Carlsbad CA, United States). Single stained and Fluorescence Minus One (FMO) controls were used to set appropriate gates. A total of 106 isolated cells per mouse were analyzed.
Histology
Morphology of liver, adipose tissue (gonadal fat pad), and skeletal muscle (TA) was examined histologically. For liver and adipocyte morphology, a portion of the liver and gonadal fat pad, respectively, was excised and placed in 10% neutral buffered formalin (VWR; Cat#: 16004–128) for 18 h, washed with 70% ethanol, and then paraffin embedded. 5–7 μm sections were cut and slides were deparaffinized by xylene, rehydrated with decreasing concentrations of ethanol in water, and then stained with Hematoxylin and Eosin. Images (20x – adipose; 4x/20x – liver) were taken using a Nikon E600 microscope. Adipocyte area was measured using ImageJ (NIH; Bethesda, MD) by measuring the circumference of 150–350 adipocytes (n = 5–10/group). For skeletal muscle morphology, the TA was carefully excised, cut ~1 mm proximal to the mid belly and flash frozen in liquid nitrogen. 10 μm sections were cut using a Zeiss Microm 505HN Crystat (Oberkochen, Germany) at −24°C and slides were kept at −80°C until staining. Slides were fixed in ice cold acetone for 10 minutes and stained with Hematoxylin and Eosin. 20 and 40x images were taken using a Keyence BZX800 microscope. Myofibrillar cross sectional area (CSA) was measured using ImageJ by measuring the circumference of 300–700 myofibers/mouse (n = 5/group).
Statistics
All data is shown as means ± standard error (SEM). Data was graphed using Prism GraphPad (San Diego, CA) and statistical analysis was run with IBM® SPSS® (Armonk, NY). A two-way ANOVA, general linear model – univariate analysis of variance, was used to determine differences between weight status (Lean, Obese) and chemotherapy (PBS, 5FU). Significant main effect differences between groups (weight status or chemotherapy) were assessed. If a significant interaction was achieved, a post hoc multiple comparison analysis using an LSD adjustment to compare dependent variables within and across weight status and chemotherapy was completed to determine where the interaction occurred. In circumstances where main effects were achieved, the values were collapsed before comparisons. Survival analysis was examined using a Montel-Cox log-rank survival probability test. Significance was set a p ≤ .05.
Ethics statement
All animal experiments were approved by the University of South Carolina’s Institutional Animal Care and Use Committee (Protocol number: 2426-101349; approval date 09/05/2018).
Supplemental Material
Download Zip (5.8 MB)Disclosure statement
The authors declare no competing interest.
Data availability statement
All data generated or analyzed during this study are included in this published article and its supplementary information files.
Supplementary material
Supplemental data for this article can be accessed online at https://doi.org/10.1080/15384047.2022.2108306
Additional information
Funding
Notes on contributors
Brandon N. VanderVeen
Brandon N. VanderVeen is a PhD in the Department of Pathology, Microbiology, and Immunology at the University of South Carolina’s School of Medicine. He has a strong background in skeletal muscle physiology in the context of cancer and its treatments.
Thomas D. Cardaci
Thomas D. Cardaci holds a MS and is currently working on his PhD in the Department of Pathology, Microbiology, and Immunology at the University of South Carolina’s School of Medicine. His research interests are focused on skeletal muscle function in disease models.
Sierra J. McDonald
Sierra J. McDonald is currently working on her PhD in the Department of Pathology, Microbiology, and Immunology at the University of South Carolina’s School of Medicine. Her work is focused on diet, namely natural products, to prevent tumorigenesis.
Sarah S. Madero
Sarah S. Madero is a Research Assistant in the Department of Pathology, Microbiology, and Immunology at the University of South Carolina’s School of Medicine. She has strong expertise in laboratory techniques.
Christian A. Unger
Christian A. Unger is currently working on his PhD in the Department of Pathology, Microbiology, and Immunology at the University of South Carolina’s School of Medicine. His research interests are focused on metabolism and skeletal muscle function.
Brooke M. Bullard
Brooke M. Bullard is currently working on her PhD in the Department of Pathology, Microbiology, and Immunology at the University of South Carolina’s School of Medicine. Her work is focused on the use of alternative medicine to treat and prevent colitis and associated colorectal cancer.
Reilly T. Enos
Reilly T. Enos is a Principal Investigator in the Department of Pathology, Microbiology, and Immunology at the University of South Carolina’s School of Medicine. His research is focused on understanding how nutrition fuels obesity, diabetes, non-alcoholic fatty liver disease, and cancer development.
Kandy T. Velázquez
Kandy T. Velázquez is a Principal Investigator in the Department of Pathology, Microbiology, and Immunology at the University of South Carolina’s School of Medicine. Her work is focused on the use of herbal components as therapeutic modalities for cancer and associated cachexia and pain.
Jason L. Kubinak
Jason L. Kubinak is a Principal Investigator in the Department of Pathology, Microbiology, and Immunology at the University of South Carolina’s School of Medicine. His research program is focused on immune-microbiota interactions in health and disease.
Daping Fan
Daping Fan is a Principal Investigator in the Department of Cell Biology and Anatomy at the University of South Carolina’s School of Medicine. His work is focused on developing novel therapies for inflammatory diseases including cardiovascular diseases and breast cancer.
E. Angela Murphy
E. Angela Murphy is a Principal Investigator in the Department of Pathology, Microbiology, and Immunology at the University of South Carolina’s School of Medicine. Her research program is focused on the impact of diet on cancer and cancer therapy.
References
- Islami F, Ward EM, Sung H, Cronin KA, Tangka FKL, Sherman RL, Zhao J, Anderson RN, Henley SJ, Yabroff KR, et al. Annual report to the nation on the status of cancer, part 1: national cancer statistics. J Natl Cancer Inst. 2021;113(12):1648–1669. Epub 2021 Jul 10. 10.1093/jnci/djab131. PubMed PMID: 34240195.
- Benson AB, Venook AP, Al-Hawary MM, Arain MA, Chen YJ, Ciombor KK, Cohen S, Cooper HS, Deming D, Farkas L, et al. Colon cancer,version 2.2021,NCCN clinical practice guidelines in oncology. J Natl Compr Canc Netw. 2021;19(3):329–359. Epub 2021 Mar 17. 10.6004/jnccn.2021.0012. PubMed PMID: 33724754.
- Sougiannis AT, VanderVeen BN, Davis JM, Fan D, Murphy EA. Understanding chemotherapy-induced intestinal mucositis and strategies to improve gut resilience. Am J Physiol Gastrointest Liver Physiol. 2021;320(5):G712–G719. Epub 2021 Jan 21. 10.1152/ajpgi.00380.2020. PubMed PMID: 33471628.
- Shitara K, Matsuo K, Takahari D, Yokota T, Inaba Y, Yamaura H, Sato Y, Najima M, Ura T, Muro K. Neutropenia as a prognostic factor in metastatic colorectal cancer patients undergoing chemotherapy with first-line FOLFOX. Eur J Cancer. 2009;45(10):1757–1763. Epub 2009 Feb 17. 10.1016/j.ejca.2009.01.019. PubMed PMID: 19217278.
- Abraham JE, Hiller L, Dorling L, Vallier AL, Dunn J, Bowden S, Ingle S, Jones L, Hardy R, Twelves C, et al. A nested cohort study of 6,248 early breast cancer patients treated in neoadjuvant and adjuvant chemotherapy trials investigating the prognostic value of chemotherapy-related toxicities. BMC Med. 2015;13(1):306. Epub 2015 Dec 31. 10.1186/s12916-015-0547-5. PubMed PMID: 26715442; PMCID: PMC4693418.
- Olsen MM, LeFebvre KB, Brassil KJ. Oncology nursing society. Chemotherapy and immunotherapy guidelines and recommendations for practice. 2019; Pittsburgh (Pennsylvania):Oncology Nursing Society. xiii, 644.
- Roy S, Vallepu S, Barrios C, Hunter K. Comparison of comorbid conditions between cancer survivors and age-Matched patients without cancer. J Clin Med Res. 2018;10(12):911–919. Epub 2018 Nov 15. 10.14740/jocmr3617w. PubMed PMID: 30425764; PMCID: PMC6225860.
- Fowler H, Belot A, Ellis L, Maringe C, Luque-Fernandez MA, Njagi EN, Navani N, Sarfati D, Rachet B. Comorbidity prevalence among cancer patients: a population-based cohort study of four cancers. BMC Cancer. 2020;20(1):2. Epub 2020 Jan 29. 10.1186/s12885-019-6472-9. PubMed PMID: 31987032; PMCID: PMC6986047.
- VanderVeen BN, Sougiannis AT, Velazquez KT, Carson JA, Fan D, Murphy EA. The acute effects of 5 fluorouracil on skeletal muscle resident and infiltrating immune cells in mice. Front Physiol. 2020;11:593468. Epub 2020 Dec 29. 10.3389/fphys.2020.593468. PubMed PMID: 33364975; PMCID: PMC7750461.
- Sougiannis AT, VanderVeen BN, Enos RT, Velazquez KT, Bader JE, Carson M, Chatzistamou I, Walla M, Pena MM, Kubinak JL, et al. Impact of 5 fluorouracil chemotherapy on gut inflammation, functional parameters, and gut microbiota. Brain Behav Immun. 2019;80:44–55. Epub 2019 Feb 27. 10.1016/j.bbi.2019.02.020. PubMed PMID: 30807838; PMCID: PMC6660349.
- Campelj DG, Timpani CA, Cree T, Petersen AC, Hayes A, Goodman CA, Rybalka E. Metronomic 5-Fluorouracil delivery primes skeletal muscle for myopathy but does not cause cachexia. Pharmaceuticals (Basel). 2021;14(5):478. Epub 2021 Jun 03. 10.3390/ph14050478. PubMed PMID: 34067869; PMCID: PMC8156038.
- Longley DB, Harkin DP, Johnston PG. 5-fluorouracil: mechanisms of action and clinical strategies. Nat Rev Cancer. 2003;3(5):330–338. Epub 2003 May 02. 10.1038/nrc1074. PubMed PMID: 12724731.
- Miura K, Kinouchi M, Ishida K, Fujibuchi W, Naitoh T, Ogawa H, Ando T, Yazaki N, Watanabe K, Haneda S, et al. 5-fu metabolism in cancer and orally-administrable 5-fu drugs. Cancers (Basel). 2010;2(3):1717–1730. Epub 2010 Jan 01. 10.3390/cancers2031717. PubMed PMID: 24281184; PMCID: PMC3837334.
- Latchman J, Guastella A, Tofthagen C. 5-Fluorouracil toxicity and dihydropyrimidine dehydrogenase enzyme: implications for practice. Clin J Oncol Nurs. 2014;18(5):581–585. Epub 2014 Sep 26. 10.1188/14.CJON.581-585. PubMed PMID: 25253112; PMCID: PMC5469441.
- Lauby-Secretan B, Scoccianti C, Loomis D, Grosse Y, Bianchini F, Straif K. International agency for research on cancer handbook working g. body fatness and cancer–Viewpoint of the IARC working group. N Engl J Med. 2016;375(8):794–798. Epub 2016 Aug 25. 10.1056/NEJMsr1606602. PubMed PMID: 27557308; PMCID: PMC6754861.
- Gribovskaja-Rupp I, Kosinski L, Ludwig KA. Obesity and colorectal cancer. Clin Colon Rectal Surg. 2011;24(4):229–243. Epub 2012 Dec 04. 10.1055/s-0031-1295686. PubMed PMID: 23204938; PMCID: PMC3311490.
- Louie SM, Roberts LS, Nomura DK. Mechanisms linking obesity and cancer. Biochim Biophys Acta. 2013;1831(10):1499–1508. Epub 2013 Mar 09. 10.1016/j.bbalip.2013.02.008. PubMed PMID: 23470257; PMCID: PMC3766377.
- Engin A. The definition and prevalence of obesity and metabolic syndrome. Adv Exp Med Biol. 2017;960:1–17. Epub 2017 Jun 07. 10.1007/978-3-319-48382-5_1. PubMed PMID: 28585193.
- de Heredia FP, Gomez-Martinez S, Marcos A. Obesity, inflammation and the immune system. Proc Nutr Soc. 2012;71(2):332–338. Epub 2012 Mar 21. 10.1017/S0029665112000092. PubMed PMID: 22429824.
- Merrell MD, Cherrington NJ. Drug metabolism alterations in nonalcoholic fatty liver disease. Drug Metab Rev. 2011;43(3):317–334. Epub 2011 May 27. 10.3109/03602532.2011.577781. PubMed PMID: 21612324; PMCID: PMC3753221.
- Divella R, Mazzocca A, Daniele A, Sabba C, Paradiso AO. Nonalcoholic fatty liver disease and adipocytokines network in promotion of cancer. Int J Biol Sci. 2019;15(3):610–616. Epub 2019 Feb 13. 10.7150/ijbs.29599. PubMed PMID: 30745847; PMCID: PMC6367583.
- Petrelli F, Cortellini A, Indini A, Tomasello G, Ghidini M, Nigro O, Salati M, Dottorini L, Iaculli A, Varricchio A, et al. Association of obesity with survival outcomes in patients with cancer: a systematic review and meta-analysis. JAMA Netw Open. 2021;4(3):e213520. Epub 2021 Mar 30. 10.1001/jamanetworkopen.2021.3520. PubMed PMID: 33779745; PMCID: PMC8008284.
- VanderVeen BN, Murphy EA, Carson JA. The impact of immune cells on the skeletal muscle microenvironment during cancer cachexia. Front Physiol. 2020;11:1037. Epub 2020 Sep 29. 10.3389/fphys.2020.01037. PubMed PMID: 32982782; PMCID: PMC7489038.
- Lee DH, Giovannucci EL. The obesity paradox in cancer: epidemiologic insights and perspectives. Curr Nutr Rep. 2019;8(3):175–181. Epub 2019 May 28. 10.1007/s13668-019-00280-6. PubMed PMID: 31129887.
- Lennon H, Sperrin M, Badrick E, Renehan AG. The obesity paradox in cancer: a review. Curr Oncol Rep. 2016;18(9):56. Epub 2016 Aug 01. 10.1007/s11912-016-0539-4. PubMed PMID: 27475805; PMCID: PMC4967417.
- Daniel CR, Shu X, Ye Y, Gu J, Raju GS, Kopetz S, Wu X. Severe obesity prior to diagnosis limits survival in colorectal cancer patients evaluated at a large cancer centre. Br J Cancer. 2016;114(1):103–109. Epub 2015 Dec 17. 10.1038/bjc.2015.424. PubMed PMID: 26679375; PMCID: PMC4716542.
- Prado CM, Baracos VE, McCargar LJ, Mourtzakis M, Mulder KE, Reiman T, Butts CA, Scarfe AG, Sawyer MB. Body composition as an independent determinant of 5-fluorouracil-based chemotherapy toxicity. Clin Cancer Res. 2007;13(11):3264–3268. Epub 2007 Jun 05. 10.1158/1078-0432.CCR-06-3067. PubMed PMID: 17545532.
- Horowitz NS, Wright AA. Impact of obesity on chemotherapy management and outcomes in women with gynecologic malignancies. Gynecol Oncol. 2015;138(1):201–206. Epub 2015 Apr 15. 10.1016/j.ygyno.2015.04.002. PubMed PMID: 25870918; PMCID: PMC4469517.
- Bouleftour W, Viard A, Mery B, Chaux R, Magne N, Simoens X, Rivoirard R, Forges F. Body surface area capping may not improve cytotoxic drugs tolerance. Sci Rep. 2021;11(1):2431. Epub 2021 Jan 28. 10.1038/s41598-021-81792-6. PubMed PMID: 33510207; PMCID: PMC7843991.
- Meyerhardt JA, Tepper JE, Niedzwiecki D, Hollis DR, McCollum AD, Brady D, O’Connell MJ, Mayer RJ, Cummings B, Willett C, et al. Impact of body mass index on outcomes and treatment-related toxicity in patients with stage II and III rectal cancer: findings from Intergroup Trial 0114. J Clin Oncol. 2004;22(4):648–657. 10.1200/JCO.2004.07.121. PubMed PMID: 14966087.
- Noguchi T, Tanimoto K, Shimokuni T, Ukon K, Tsujimoto H, Fukushima M, Noguchi T, Kawahara K, Hiyama K, Nishiyama M. Aberrant methylation of DPYD promoter, DPYD expression, and cellular sensitivity to 5-fluorouracil in cancer cells. Clin Cancer Res. 2004;10(20):7100–7107. Epub 2004 Oct 27. 10.1158/1078-0432.CCR-04-0337. PubMed PMID: 15501990.
- Groopman JE, Itri LM. Chemotherapy-induced anemia in adults: incidence and treatment. J Natl Cancer Inst. 1999;91(19):1616–1634. Epub 1999 Oct 08. 10.1093/jnci/91.19.1616. PubMed PMID: 10511589.
- Mahoney SE, Davis JM, Murphy EA, McClellan JL, Gordon B, Pena MM. Effects of 5-fluorouracil chemotherapy on fatigue: role of MCP-1. Brain Behav Immun. 2013;27(1):155–161. Epub 2012 Oct 23. 10.1016/j.bbi.2012.10.012. PubMed PMID: 23085145; PMCID: PMC3711245.
- Saligan LN, Olson K, Filler K, Larkin D, Cramp F, Yennurajalingam S, Escalante CP, Del Giglio A, Kober KM, Kamath J, et al. Multinational association of supportive care in cancer fatigue study group-Biomarker working G. The biology of cancer-related fatigue: a review of the literature. Support Care Cancer. 2015;23(8):2461–2478. Epub 2015 May 16. 10.1007/s00520-015-2763-0. PubMed PMID: 25975676; PMCID: PMC4484308.
- VanderVeen BN, Fix DK, Montalvo RN, Counts BR, Smuder AJ, Murphy EA, Koh HJ, Carson JA. The regulation of skeletal muscle fatigability and mitochondrial function by chronically elevated interleukin-6. Exp Physiol. 2019;104(3):385–397. Epub 2018 Dec 24. 10.1113/EP087429. PubMed PMID: 30576589; PMCID: PMC6750733.
- Vanderveen BN, Fix DK, Counts BR, Carson JA. The effect of wheel exercise on functional indices of cachexia in tumor-bearing mice. Med Sci Sports Exerc. 2020;52(11):385–397. doi:10.1249/MSS.0000000000002393. PubMed PMID: 33064407; PMCID: PMC7573199.
- VanderVeen BN, Hardee JP, Fix DK, Carson JA. Skeletal muscle function during the progression of cancer cachexia in the male Apc(Min/+) mouse. J Appl Physiol. 1985. 2018;124(3):684–695. Epub 2017 Nov 11. doi: 10.1152/japplphysiol.00897.2017. PubMed PMID: 29122966; PMCID: PMC5899274
- Counts BR, Halle JL, Carson JA. Early-Onset physical inactivity and metabolic dysfunction in tumor-bearing mice is associated with accelerated cachexia. Med Sci Sports Exerc. 2022;54(1):77–88. doi:10.1249/MSS.0000000000002772. PubMed PMID: 34431825; PMCID: PMC8678203.
- Evans WJ, Morley JE, Argiles J, Bales C, Baracos V, Guttridge D, Jatoi A, Kalantar-Zadeh K, Lochs H, Mantovani G, et al. Cachexia: a new definition. Clin Nutr. 2008;27(6):793–799. 10.1016/j.clnu.2008.06.013. PubMed PMID: 18718696.
- Baltgalvis KA, Berger FG, Pena MM, Mark Davis J, White JP, Carson JA. Activity level, apoptosis, and development of cachexia in Apc(Min/+) mice. J Appl Physiol. 1985;109(4):1155–1161. 2010;():. doi: 10.1152/japplphysiol.00442.2010. PubMed PMID: 20651218; PMCID: PMC2963323.
- Barreto R, Mandili G, Witzmann FA, Novelli F, Zimmers TA, Bonetto A. Cancer and chemotherapy contribute to muscle loss by activating common signaling pathways. Front Physiol. 2016;7:472. PubMed PMID: 27807421; PMCID: PMC5070123. doi:10.3389/fphys.2016.00472.
- Barreto R, Waning DL, Gao H, Liu Y, Zimmers TA, Bonetto A. Chemotherapy-related cachexia is associated with mitochondrial depletion and the activation of ERK1/2 and p38 MAPKs. Oncotarget. 2016;7(28):43442–43460. Epub 2016 Jun 04. 10.18632/oncotarget.9779. PubMed PMID: 27259276; PMCID: PMC5190036.
- Huot JR, Pin F, Bonetto A. Muscle weakness caused by cancer and chemotherapy is associated with loss of motor unit connectivity. Am J Cancer Res. 2021;11(6):2990–3001. Epub 2021 Jun 15. PubMed PMID: 34249440; PMCID: PMC8263661.
- VanderVeen BN, Fix DK, Carson JA. Disrupted skeletal muscle mitochondrial dynamics, mitophagy, and biogenesis during cancer cachexia: a role for inflammation. Oxid Med Cell Longev. 2017;2017:3292087. Epub 2017 Jul 13. 10.1155/2017/3292087. PubMed PMID: 28785374; PMCID: PMC5530417.
- Carson JA, Hardee JP, VanderVeen BN. The emerging role of skeletal muscle oxidative metabolism as a biological target and cellular regulator of cancer-induced muscle wasting. Semin Cell Dev Biol. 2016;54:53–67. Epub 2015 Nov 26. 10.1016/j.semcdb.2015.11.005. PubMed PMID: 26593326; PMCID: PMC4867246.
- Wu H, Ballantyne CM. Skeletal muscle inflammation and insulin resistance in obesity. J Clin Invest. 2017;127(1):43–54. Epub 2017 Jan 04. 10.1172/JCI88880. PubMed PMID: 28045398; PMCID: PMC5199705 Sanofi-Synthelabo, and has a provisional patent (no. 61721475) entitled “Biomarkers to improve prediction of heart failure risk,” filed by Baylor College of Medicine and Roche.
- Hardee JP, Counts BR, Gao S, VanderVeen BN, Fix DK, Koh HJ, Carson JA. Inflammatory signalling regulates eccentric contraction-induced protein synthesis in cachectic skeletal muscle. J Cachexia Sarcopenia Muscle. 2018;9(2):369–383. Epub 2017 Dec 08. 10.1002/jcsm.12271. PubMed PMID: 29215198; PMCID: PMC5879978.
- Huang SC, Wu JF, Saovieng S, Chien WH, Hsu MF, Li XF, Lee SD, Huang CY, Huang CY, Kuo CH. Doxorubicin inhibits muscle inflammation after eccentric exercise. J Cachexia Sarcopenia Muscle. 2017;8(2):277–284. Epub 2016 Nov 30. 10.1002/jcsm.12148. PubMed PMID: 27897404; PMCID: PMC5377412.
- Wijler LA, Raats DAE, Elias SG, Dijk FJ, Quirindongo H, May AM, Furber MJW, Dorresteijn B, van Dijk M, Kranenburg O. Specialized nutrition improves muscle function and physical activity without affecting chemotherapy efficacy in C26 tumour-bearing mice. J Cachexia Sarcopenia Muscle. 2021;12(3):796–810. Epub 2021 May 06. 10.1002/jcsm.12703. PubMed PMID: 33956410; PMCID: PMC8200448.
- Tisdale MJ, Brennan RA, Fearon KC. Reduction of weight loss and tumour size in a cachexia model by a high fat diet. Br J Cancer. 1987;56(1):39–43. doi:10.1038/bjc.1987.149. PubMed PMID: 3620317; PMCID: PMC2001676.
- Martin L, Birdsell L, Macdonald N, Reiman T, Clandinin MT, McCargar LJ, Murphy R, Ghosh S, Sawyer MB, Baracos VE. Cancer cachexia in the age of obesity: skeletal muscle depletion is a powerful prognostic factor, independent of body mass index. J Clin Oncol. 2013;31(12):1539–1547. Epub 2013 Mar 25. 10.1200/JCO.2012.45.2722. PubMed PMID: 23530101.
- Tan BH, Birdsell LA, Martin L, Baracos VE, Fearon KC. Sarcopenia in an overweight or obese patient is an adverse prognostic factor in pancreatic cancer. Clin Cancer Res. 2009;15(22):6973–6979. doi:10.1158/1078-0432.CCR-09-1525. PubMed PMID: 19887488.
- Ding PQ, Batra A, Xu Y, McKinnon GP, Cheung WY. Obesity and its impact on outcomes in patients with stage iii colon cancer receiving adjuvant chemotherapy. Clin Colorectal Cancer. 2020;19(3):209–218. Epub 2020 Apr 16. 10.1016/j.clcc.2020.02.010. PubMed PMID: 32291245.
- Sougiannis AT, VanderVeen BN, Cranford TL, Enos RT, Velazquez KT, McDonald S, Bader JE, Chatzistamou I, Fan D, Murphy EA. Impact of weight loss and partial weight regain on immune cell and inflammatory markers in adipose tissue in male mice. J Appl Physiol. 1985;129(4):909–919. Epub 2020 Aug 28. 10.1152/japplphysiol.00356.2020. PubMed PMID: 32853106; PMCID: PMC7654690.
- Reidy PT, McKenzie AI, Mahmassani ZS, Petrocelli JJ, Nelson DB, Lindsay CC, Gardner JE, Morrow VR, Keefe AC, Huffaker TB, et al. Aging impairs mouse skeletal muscle macrophage polarization and muscle-specific abundance during recovery from disuse. Am J Physiol Endocrinol Metab. 2019;317(1):E85–E98. Epub 2019 Apr 10. 10.1152/ajpendo.00422.2018. PubMed PMID: 30964703; PMCID: PMC6689737.
- Arnold L, Henry A, Poron F, Baba-Amer Y, van Rooijen N, Plonquet A, Gherardi RK, Chazaud B. Inflammatory monocytes recruited after skeletal muscle injury switch into antiinflammatory macrophages to support myogenesis. J Exp Med. 2007;204(5):1057–1069. Epub 2007 May 07. 10.1084/jem.20070075. PubMed PMID: 17485518; PMCID: PMC2118577.