
ABSTRACT
Elevated SOX2 protein levels correspond to the poor prognosis of patients with esophageal squamous cell carcinoma (ESCC). Poor prognosis is closely correlated with the loss or disruption of cellular polarity; however, the relationships between SOX2 protein and polarity proteins in ESCC remain elusive. Herein, we found that the knockdown of SOX2 significantly decreased miR-142-3p expression and can regulate the translation of LLGL2 protein, a member of the Scribble complex. LLGL2 protein levels in ESCC are negatively correlated with miR-142-3p and SOX2 levels. Moreover, LLGL2 protein expression increased upon SOX2 knockdown in ESCC cell lines, and mutating the binding site for this miRNA in the LLGL2 3’-UTR disrupted its ability to inhibit LLGL2 expression. When LLGL2 was overexpressed, ESCC cell proliferation and invasion were inhibited in vitro and in vivo, which could be elucidated based on changes in gene expression after RNA sequencing, targeted proteomic analysis and bioinformatic assays. However, SOX2 protein did not directly bind to the promoter of miR-142-3p after ChIP sequencing. Together, these findings indicate that a SOX2 regulatory axis governs ESCC proliferation, migration, invasiveness, and apoptosis, thereby providing a potential avenue for future therapeutic intervention.
Abbreviations
CCK-8, Cell Counting Kit 8; Chip, Chromatin Immunoprecipitation; EC, Esophageal cancer; EMT, epithelial-to-mesenchymal transition; ESCC, Esophageal squamous cell carcinomas; LLGL2, lethal (2) giant larvae protein homolog 2; LLGL2ov, LLGL2 overexpression; MET, mesenchymal-epithelial transition; miRNAs, MicroRNAs; PRM-MS, Parallel reaction monitoring-Mass spectrometry; SD, Standard deviation; SOX, sex determining region Y (SRY)-like box; SOX2-Kd, SOX2-knockdwon; TUNEL, TdT-mediated dUTP Nick-End Labeling.
Introduction
Esophageal cancer is among the deadliest diseases globally, and the most common subtype in developing nations is ESCC.Citation1,Citation2 In China, ESCC accounts for 90% of esophageal cancer-related deaths. Previous work has revealed the etiologies of ESCC caused by environmental and genetic factors, which include smoking, drinking, diet, chemical factors, infection, family ESCC history and genetic changes; thus, epigenetic and genetic regulation of cellular growth are factorsCitation3 and have also been demonstrated to yield tumor growth advantages that can mediate ESCC oncogenesis and progression.Citation4–7 We used genetic mouse models to identify a novel mechanism by which SOX2 cooperates with inflammatory signals to transform basal stem cells in the esophagus, thus leading to ESCC initiation and progression.Citation8
The sex determining region Y (SRY)-like box (SOX) family member SOX2 is a member of the gene family that helps control stem-like properties in cells.Citation9–11 Interestingly, SOX2 is also commonly mutated in ESCC, with ~25% of samples showing genetic amplification, and it has recently been associated with ESCC tumorigenesis and multiple other malignant processes.Citation8,Citation12,Citation13 Elevated SOX2 expression is known to correspond to tumor development, progression, and eventual metastasis,Citation14 and many attempts have been made to target SOX2 protein, SOX2-interacting protein, SOX2-related regulatory axis or SOX2+ cells for cancer treatment.Citation15–20 ESCC is also known to be associated with dysregulated miRNA expression and activity.Citation21,Citation22 For example, miR-455-3p, which activates the transforming growth factor-β (TGF-β)/Smad and Wnt/β-catenin pathways, plays essential roles in the chemoresistance and tumorigenesis of ESCC using a chemoresistant patient-derived xenograft (PDX) model.Citation23
Additionally, many studies have shown that the loss of cell polarity is considered as a hallmark for cancer and promotes the invasion of cancer cells.Citation3,Citation24 Moreover, SOX2 protein is also involved in the invasion progress of ESCC.Citation20 To elucidate the relationships between SOX2 protein and polarity proteins, we tested the expression change of miRNAs targeting polarity proteins after SOX2 knockdown using a microarray assay and determined the regulatory axis using bioinformatics. Then, we examined the expression pattern of LLGL2 in ESCC cell lines and clinical biopsies and identified that miR-142-3p, a potential regulator of LLGL2 protein, was always increased in ESCC clinical samples and significantly decreased upon SOX2 knockdown. Importantly, LLGL2 protein acts as a negative regulator in cell proliferation, migration, invasion, and apoptosis upon its ectopic expression. Therefore, we highlight a SOX2/miRNA/LLGL2 regulator axis in ESCC linked to malignant progression.
Materials and methods
Cell lines, mice and reagents
KYSE450, TE-1 ESCC and HEEC cells were obtained from the ATCC (VA, USA) and grown in RPMI 1640 or DMEM containing 10% FBS (Gibco, NY, USA). Cells were infected with lentiviruses to mediate either SOX2 knockdown (pLK0.1SOX2) or control (pLK0.1Scramble) plasmids,Citation8 or they were transfected with lentivirus designed for LLGL2 overexpression (pCDH-LLGL2-IRES-GFP). A list of all primers used for generating the construct is shown in Table S1. Cells stably transduced with these constructs were obtained via selection with puromycin (Santa Cruz Biotechnology, TX, USA). For animal studies, 6-week-old NCG mice (NOD/ShiLtJGpt-Prkdcem26 IL2rgem26/Gpt) from GemPharmatech Company (Nanjing, China) were used. A TUNEL Assay Kit (Merck, Cat No: S7100) was utilized for apoptosis evaluation. The Medical Ethics Committee of Dongfang Hospital of Xiamen University approved all studies regarding mouse manipulation and clinical sample collection described herein.
Tissue section, immunofluorescence, and immunohistochemistry assay
These assays were performed as previously described.Citation8,Citation25
Western blot analysis
Western blotting was conducted as in past reports.Citation25,Citation26 Briefly, after proteins were transferred to PVDF membranes, these blots were probed using primary antibodies specific for SOX2 (Seven Hills, OH, USA), β-actin (Beyotime, Nantong, China), LLGL2 (Abcam, MA, USA) or E-cadherin (Cell Signaling Technology, MA, USA). HRP-linked secondary antibodies specific for mouse-IgG (ZSGB-Bio, Beijing, China) or rabbit IgG (Abcam) were then used for protein detection, β-actin was used as a control for normalization, and Image-Pro Plus 6.0 was used for quantification.
Cell proliferation and colony formation
Cells were seeded into 96-well plates, and then the OD of these cells was assessed every 24 h for a total of 96 h or 72 h at 450 nm and 630 nm via a CCK-8 assay. The difference in OD between 630 nm and 450 nm was used to calculate the rate of cell proliferation. In colony formation assays, cells were seeded in 6-well plates for two or more weeks, after which 4% paraformaldehyde (DingGuo, Beijing, China) was used to fix cells, which were then stained with 0.5% crystal violet. Colonies that were larger than 0.5 mm in size were then enumerated using ImageJ software, as in previous reports.Citation25
Wound healing assay
Initially, 6-well plates were seeded with 1 × 10⁶ KYSE450 or TE-1 cells (control and LLGL2ov) grew until 90% confluency, at which time a wound was generated in this monolayer by scraping it using a micropipette tip. After removing nonadherent cells, the cells were grown for 24 h in medium containing 5% FBS, and the wound healing index was determined based on wound closure over a 24 h period as follows: (S0− Sn)/S0 × 100%, with S0 and Sn corresponding to the empty area at 0 h and 24 h after wounding, respectively.Citation25
Invasion assay
Twenty-four-well plates that had 6.5 mm inserts were used (Corning, Cat No: 3422, NY, USA), and 12 μL of ice-cold Matrigel™ (BD, Cat No: 356234, MA, USA)-coated 8 μM polycarbonate membranes were suspended over these wells. In the upper chamber of this setup, a total of 5 × 10⁴ cells were added to a 200 μL volume in media that contained 5% FBS. In the lower chamber, 500 μL of media that contained 20% FBS was added. Cells were grown for 24 hrs, and then cells at the lower side of the membrane were fixed in methanol followed by 1% crystal violet staining for counting.
Xenograft studies
Six-week-old NCG mice were subcutaneously implanted with a 100 μL volume of RPMI medium containing 5 × 10⁶ KYSE450 cells, as in our previous study.Citation20 Five male NCG mice per cohort were randomized prior to implantation. Tumors were harvested 8 weeks after inoculation, and tumor weight was analyzed using statistical methods.
miRNA microarray and quantitative real-time PCR
TRIzol (Invitrogen, CA, USA) and the miRNeasy kit (Qiagen, Hilden, Germany) were used to isolate total ESCC cellular RNA based on the instructions. For measures of altered miRNA expression in cells upon SOX2 knockdown, a human miRNA microarray miRCURY™ LNA Expression Array (v.18.0, Exiqon) was employed. After filtering out miRNAs that were present at low intensity, the initial signal intensity for each sample was normalized based on the median normalization approach. Significance analysis of microarrays (SAM) v2.1 was utilized to identify those miRNAs that had a ≥ 1.5-fold-change and a p value ≤.05 between the control and SOX2-Kd cells. miRNA expression changes were validated via quantitative real-time PCR using stem loop primers and specific PCR primers (Table S2).
Luciferase reporter assays
The Dual-Luciferase Reporter Assay System (Promega, Cat No. E1910, WI, USA) was used to assess miRNA binding to the LLGL2 3’-UTR using primers for the wild-type and mutant LLGL2 3’-UTRs, as shown in Table S3. Cells were transfected with both reporter constructs bearing the wild-type or mutant 3’-UTR sequence together with pRL-TK and miRNA mimics or inhibitors. After transfection, luciferase activity in cells was assessed, with Renilla luciferase activity serving as a control for transfection efficiency. The sequences used in this experiment, including miRNA mimics and controls (RIBOBIO company, Guangzhou, China), are listed in Table S4.
TdT-mediated dUTP Nick-End Labeling (TUNEL) assay
TUNEL assay for apoptosis detection was performed with the ApopTag Peroxidase In Situ Apoptosis Detection Kit exactly as described in the manual. Tail with digoxigenin-nucleotide was added to the exposed 3′-OH ends of DNA fragments generated in response to apoptotic signals by terminal deoxynucleotidyl transferase (TdT). Following this step, digoxigenin-nucleotide was detected by using anti-digoxigenin-peroxidase conjugate. Diaminobenzidine reacted with peroxidase to generate an insoluble colored substrate at the site of apoptotic cells. Counterstaining with methyl green would aid in the morphological evaluation and identification of apoptotic tumor cells on slides derived from xenograft tumors.
RNA sequencing and data mining
Total RNA was isolated from KYSE450 cells using TRIzol reagent following the manufacturer’s guidance. The concentration and quality of RNA were determined with a NanoDrop 1000 spectrophotometer. Construction of the next-generation sequencing library was performed using the TruSeq RNA Sample Preparation Kit V2 (Illumina) according to the manufacturer’s protocols. Oligo-dT magnetic beads were used to purify mRNA from 1000 ng total RNA, and then cDNA synthesis was performed with random primers and reverse transcription enzyme. Following this, end repair and 3’ adenylation were performed on these synthesized cDNAs. Adaptors were then ligated to both ends of the cDNAs. These cDNAs were purified using gel electrophoresis, and amplicons 200–500 bp in size were generated after amplification with specific primers designed according to the adaptor sequences. The amplified amplicons were then hybridized to the Illumina paired-end flow cell and amplified using PE150 equipment at a concentration of 10 pM per lane, and paired-end reads of 150 nt were produced for each sample.
Data mining was subsequently performed based on bioinformatic analysis using annotation and functional enrichment, and the annotation methods included GO annotation and KEGG pathway annotation. The means of functional enrichment included enrichment of Gene Ontology analysis, enrichment of pathway analysis and enrichment-based clustering.
Parallel reaction monitoring-mass spectrometry (PRM-MS)-based targeted proteomic analysis
PRM analysis was performed on a Q-Exactive mass spectrometer equipped with an EASY nLC-1200 pump and autosampler system (Thermo Fisher Scientific). The separation of the peptides was performed on Reprosil-Pur 120 C18-AQ (Dr. Maisch) using 0.1% formic acid (mobile phase A) and 80% ACN with 0.1% formic acid (mobile phase B). A linear gradient of 92 min from 6 to 28% B, 20 min from 28 to 40% B, 2 min from 40 to 100% B, 2 min 100% B, 2 min from 100 to 2% B, and 2 min from 2% B at a flow rate of 300 nL/min was used. Mass spectrometry analysis was performed for 120 min/sample in positive ion detection mode. The PRM acquisition mode was performed as follows: MS2 resolution was 175.00 at m/z @ 200, AGC was 5E +4, and maximum time of ion collision was (Max IT) 200 ms. The normalized collision energy was fixed to 25%, and a mass window of 2 m/z was used to fragment the selected precursor ions.
Chromatin immunoprecipitation (ChIP) and sequencing analysis
ChIP experiments and sequencing were performed in KYSE450 cells after enrichment with SOX2 antibody (Cell Signaling Technology, Cat No: 2748). Ten nanograms of DNA samples was prepared for Illumina sequencing, and the completed libraries were quantified by an Agilent 2100 Bioanalyzer. The libraries were denatured with 0.1 M NaOH to generate single-stranded DNA molecules, captured on an Illumina flow cell, and amplified in situ. The libraries were then sequenced on the Illumina NovaSeq 6000 following the NovaSeq 6000 S4 Reagent Kit (300 cycles) protocol. After the sequencing platform generated the sequencing images, the quality of sequencing was examined using FastQC software. After passing the Solexa CHASTITY quality filter, the clean reads were aligned to the human genome (UCSC HG19) using BOWTIE software (V2.1.0). Aligned reads were used for ChIP-enriched region (peak) calling of the ChIP regions using MACS V1.4.2. Statistically significant peaks were identified after comparison of the sequencing results of ChIP with SOX2 antibody and input control using a p value threshold of 10−3. The peaks in samples were annotated by the nearest gene using the newest UCSC RefSeq database. The annotation of these peaks, which were located within −2 kb to +2 kb around the corresponding gene transcription start sites (TSSs) in KYSE450 cells, was also analyzed.
Statistical analysis
GraphPad Prism v5.0 was used for all analyses, with all data representing the means ± SDs of three independent experiments. Unpaired Student’s t tests and ANOVAs were used to compare data, with p < .05 as the significance threshold.
Results
SOX2 knockdown in an ESCC cell line reduced miR-142-3p expression
The level of SOX2 protein in HEEC cells, TE-1 cells and KYSE450 cells was detected using an immunofluorescence assay, as shown in , SOX2 is expressed in these two esophageal squamous cell carcinoma cell lines, which is consistent with our previous study.Citation20 We aimed to decrease the SOX2 protein level using shRNA-mediated knockdown (), and then we used a microarray approach (miRCURY™ LNA Expression Array v.18.0) to analyze miRNAs that were regulated by SOX2 protein. For this assay, we isolated miRNAs from the control and SOX2-Kd KYSE450 cells. As mentioned above, miRNAs have been associated with controlling the progression of cancer; therefore, we designed a schematic diagram to screen miRNAs that can target polarity proteins ().
Figure 1. miR-142-3p and LLGL2 are potentially regulated by the SOX2 protein. A. High levels of SOX2 protein are present in TE-1 and KYSE450 cells but are very low in the esophageal epithelial cell line HEEC. Scale bar: 100 μm. B. SOX2 protein levels were significantly decreased upon SOX2 knockdown. C. Schematic of the strategy to determine miR-142-3p and polarity protein LLGL2 for further study. D. Sequence of putative miR-142-3p binding sites in the LLGL2 3’-UTR were identified using bioinformatic analysis. The sites are conserved in humans. E. Reduced miR-142-3p expression was validated via microarray and quantitative PCR after SOX2 knockdown. F. SOX2 mRNA levels were inversely correlated with LLGL2 mRNA levels (p < .001). G. miR-142-3p expression is stronger in esophageal carcinoma tissues than in normal tissues based on a starBase database analysis (n = 162 for esophageal carcinoma tissues, and n = 11 for normal tissues, p < .001). H. miR-142-3p level is elevated in ESCC clinical cancers compared with cancer-adjacent tissues (n = 30). *p < .05, **p < .01, ***p < .001, ****p < .0001 vs. control. Data are the means ± SDs.
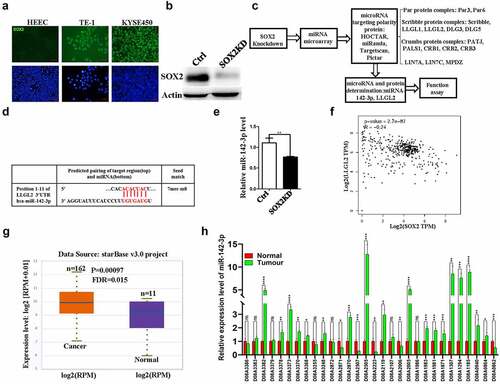
Among these differential miRNAs regulated by the SOX2 protein, we specifically analyzed the miRNAs that may bind and target polarity proteins. Herein, multiple polarity proteins, including the members of the Par protein complex (Par3, Par6), Scribble protein complex (Scribble, LLGL1, LLGL2, DLG3, and DLG5), Crumbs protein complex (PATJ, PALS1, CRB1, CRB2, and CRB3), LIN7A, LIN7C and MPDZ, were comprehensively analyzed with several online tools, such as HOCTAR, miRanda, TargetScan and Pictar, and then we further studied the overlapping miRNAs that may bind and target the polarity proteins from these online tools. Many miRNAs were dysregulated following SOX2 knockdown. Among these changed miRNAs, miR-142-3p was the most significantly downregulated miRNA that may target polarity protein, and a potential binding site of miR-142-3p was identified at the 3’-UTR of LLGL2 after analysis using online tools, including TargetScan (). The differential expression level of miR-142-3p in SOX2-Kd and control KYSE450 cells was further validated by quantitative PCR (<.01). miR-142-3p downregulation was also evident in TE-1 cells following SOX2 knockdown (data not shown). Interestingly, we found that the expression level of SOX2 was inversely correlated with the mRNA level of LLGL2 after the correlation analysis using the GEPIA tool (http://gepia.cancer-pku.cn/index.html) (<.001).
Previously, the level of miR-142-3p was associated with histological differentiation in ESCC and prognosis.Citation27 Consistently, we also confirmed the upregulated expression of miR-142-3p in clinical esophageal carcinoma using the starBase tool (http://starbase.sysu.edu.cn/index.php) (=162 for esophageal carcinoma tissues, and n = 11 for normal tissues, p < .001); moreover, the upregulated expression of miR-142-3p in 21 of a total of 30 ESCC clinical samples (70%) was further verified when compared with their matched cancer-adjacent tissues after quantitative PCR assay (, n = 30).
SOX2 expression inversely correlates with the level of LLGL2 protein in clinical samples
We analyzed the levels of LLGL2 in ESCC clinical samples, and we found that the mRNA level of LLGL2 was downregulated in 26 of 30 ESCC clinical samples (approximately 86.7%) after real-time PCR (=30). Additionally, our previous studies suggested that 54.2% of ESCC patients exhibit SOX2-positive expression in clinical samples, and the 5-year survival rate of ESCC patients with high levels of SOX2 was 42.9%.Citation8 As shown in , we also found abundant levels of SOX2 protein in ESCC cell lines but not in normal epithelial cells; in contrast, LLGL2 protein was expressed in all these cell lines, including HEEC cells, which is a normal epithelial cell line of the esophagus ().
Figure 2. LLGL2 expression is inversely correlated with SOX2 in clinical biopsies. A. mRNA level of LLGL2 in ESCC tissues was significantly lower than that in cancer-adjacent tissues (n = 30). *p < .05, **p < .01, ***p < .001, ****p < .0001 vs. control. Data are the means ± SDs. B. LLGL2 is expressed in HEEC, TE-1 and KYSE450 cells. The upper panel presents the immunofluorescence results, and the lower panel presents the western blot results. Scale bar: 100 μm. C. Downregulated expression of LLGL2 protein in ESCC clinical samples (C) versus cancer adjacent samples (CA) according to the tissue microarray (n = 80). D. Representative images of LLGL2 immunochemistry in ESCC clinical samples (C) versus cancer adjacent samples (CA). E. LLGL2 protein levels in ESCC tissues were significantly lower than those in cancer-adjacent tissues (n = 80, p < .001).
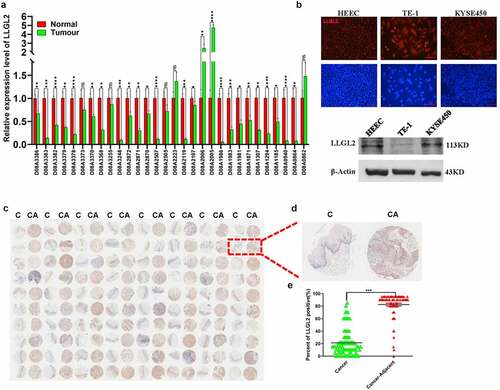
Since the LLGL2 protein may be regulated by SOX2 protein through miR-142-3p, we aimed to test the expression of LLGL2 protein in clinical samples. Previously, we tested the expression pattern of SOX2 in ESCC clinical samples, and a higher level of SOX2 was found in ESCC cancers than in healthy controls.Citation20 We tested the expression level of LLGL2 protein in an ESCC tissue microarray containing 80 cases and matched adjacent normal tissues, and representative images of LLGL2 in ESCC patients are shown in . We found that the level of LLGL2 was significantly higher in adjacent tissues than in ESCC tissues (=80, p < .001). Patients with a diagnosis of cancer stage M exhibited lower LLGL2 expression, and the characteristics of these samples are shown in Table S5, suggesting that LLGL2 may serve as a tumor suppressor gene in ESCC.
SOX2 regulates the level of LLGL2 protein via miR-142-3p in ESCC cells
As described above, many miRNAs were downregulated after SOX2 knockdown, and miR-142-3p potentially bound to the 3’-UTR of LLGL2 (). To validate this hypothesis, we tested the level of LLGL2 protein upon SOX2 knockdown. As shown in , the level of LLGL2 protein significantly increased after SOX2 knockdown. After SOX2 knockdown, we did not observe significant changes in the LLGL2 transcript levels using quantitative real-time PCR and primers (, Table S2) (p > .05), which is consistent with the finding that miR-142-3p regulates the translation of LLGL2 but not its transcription after transfection of miR-142-3p into KYSE450 cells (). Moreover, the level of LLGL2 protein decreased after transfection of miR-142-3p mimics into KYSE450 cells with overexpression of LLGL2 when compared with transfection of negative mimics control (, left panel), while the level of LLGL2 protein increased after transfection of miR-142-3p inhibitors into KYSE450 cells than transfection of negative inhibitor control (, right panel).
Figure 3. Translation of LLGL2 protein is regulated by SOX2 via miR-142-3p. A-B. SOX2 knockdown significantly resulted in decreased levels of SOX2 protein and increased levels of LLGL2 protein in KYSE450 cells. C. mRNA level of SOX2 significantly decreased upon SOX2 knockdown, while no significant difference in the mRNA level of LLGL2 occurred upon SOX2 knockdown. D. Level of LLGL2 mRNA was not affected after transfection of miR-142-3p mimics into KYSE450 cells. E. Level of LLGL2 protein decreased after transfection of miR-142-3p mimics into LLGL2 overexpressing KYSE450 cells (left panel), level of LLGL2 protein increased after transfection of miR-142-3p inhibitor into KYSE450 cells (right panel). F. Schematic diagram of binding sites between the 3’-UTR of LLGL2 mRNA and miR-142-3p. The mutated nucleotides (in red) used for the luciferase reporter assay are also shown in the diagram, and the wild-type or mutant 3’-UTR was cloned into a luciferase reporter construct (pMIR-Report-Luc). G. Mutation of this binding site is linked with increased LLGL2 reporter luciferase activity in HEK293T cells after cotransfection with miR-142-3p mimics. Control cells were cotransfected with pMIR-Report-Luc-LLGL2-3UTR-WT and negative mimic controls (Ctrl). H. miR-142-3p inhibitor enhanced LLGL2 reporter luciferase activity compared with miR-142-3p mimics in KYSE450 cells. For the control group, cells were transfected with the pMIR-Report-Luc-LLGL2-3UTR-Mutant construct along with negative mimics. I. miR-142-3p inhibitor suppressed the proliferation of KYSE450 cells (p < .05). J. miR-142-3p inhibitor reduced the invasion of KYSE450 cells (p < .05). *p < .05, **p < .01, ***p < .001 vs. control. Data are the means ± SDs.
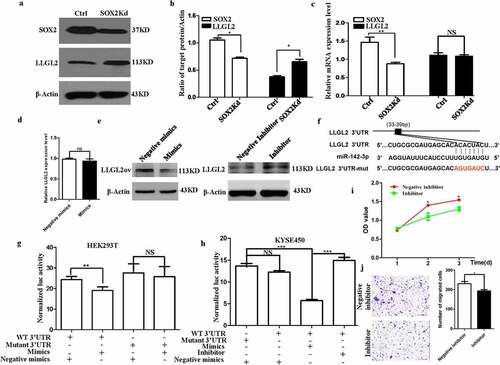
We next cloned the LLGL2 3’-UTR with the putative miRNA binding site into luciferase reporter constructs and assessed whether miR-142-3p directly regulates LLGL2 through the potential binding sites, and luciferase reporter constructs containing the wild-type or mutated 3’-UTR of LLGL2 were successfully obtained using overlap PCR with the primers listed in Table S3 (). Vector construction is described in Fig. S1A-B. Interestingly, cotransfection of miR-142-3p mimics significantly reduced the luciferase activities compared with the control (). Notably, mutating these binding sites does not lead to reduced luciferase activity in HEK293T cells, indicating that miR-142-3p controls LLGL2 translation through the binding sites. Consistent results were also obtained after cotransfection with wild-type or mutated luciferase reporter constructs with miR-142-3p mimics or inhibitors in KYSE450 cells (). These findings thus suggest that SOX2 can directly regulate LLGL2 protein levels via miR-142-3p.
We also found that the miR-142-3p inhibitor suppressed the proliferation of KYSE450 cells compared with its control (<.05). Additionally, the miR-142-3p inhibitor reduced the invasion of KYSE450 cells (<.05).
LLGL2 reduces ESCC proliferation in vitro and suppresses tumor growth in vivo
As shown in , SOX2 knockdown leads to decreased levels of miR-142-3p and increased levels of LLGL2 protein. The relationships between LLGL2 mRNA levels and the pathological stage of ESCC patients were analyzed using the GEPIA tool, and the results showed that significant correlations occurred between them (, p < .05). To test the roles of LLGL2 in ESCC progression, we performed a lentivirus-mediated LLGL2 gain-of-function study in KYSE450 and TE-1-cell lines as previously described (Fig. S2-S3),Citation25 and the increased level of LLGL2 protein was significantly achieved in these two stable cell lines (p < .01) (). Notably, increased levels of LLGL2 protein were closely linked with reduced proliferation of KYSE450 cells, especially at 96 hrs upon the overexpression of LLGL2 (p < .01) (). Consistently, LLGL2 overexpression also inhibited the proliferation of TE-1 cells ().
Figure 4. LLGL2 ectopic expression suppresses ESCC cell proliferation in vitro and reduces tumor growth in vivo. A. LLGL2 mRNA levels were significantly correlated with the pathological stage of ESCC patients (p < .05). B-C. Ectopic expression of LLGL2 protein in KYSE450 and TE-1-cell lines was established and validated by western blot. D. Ectopic expression of LLGL2 led to reduced proliferation of KYSE450 cells, as assessed with a CCK8 assay (n = 3 per group, p < .01). E. Ectopic expression of LLGL2 led to inhibited proliferation of TE-1 cells assessed with a CCK8 assay (n = 3 per group, p < .01). F-H. Ectopic expression of LLGL2 impaired colony formation and decreased individual clone sizes in KYSE450 and TE-1 cells, as shown by a colony formation assay (n = 3 per group, p < .01 for KYSE450 cells and p < .05 for TE-1 cells). I-J. LLGL2 overexpression significantly reduced xenograft tumor growth in mice, with representative KYSE450 (control) and KYSE450 (LLGL2ov) xenografts shown (n = 5 per cohort, p < .01). Tumors were collected 8 weeks after KYSE450 cell implantation. K. LLGL2 overexpression significantly reduced the weight of xenografts formed by KYSE450 cells than the control (n = 5 per group; p < .001). L-M. LLGL2 overexpression suppresses the proliferation of tumor cells, as reflected by immunostaining with a Ki67 antibody (p < .001). Scale bar: 20 µm. N-O. LLGL2 overexpression induces the apoptosis of tumor cells, as reflected by the TUNEL assay (p < .001). Scale bar: 40 µm. *p < .05, **p < .01, ***p < .001 vs. control. Data are the means ± SDs.
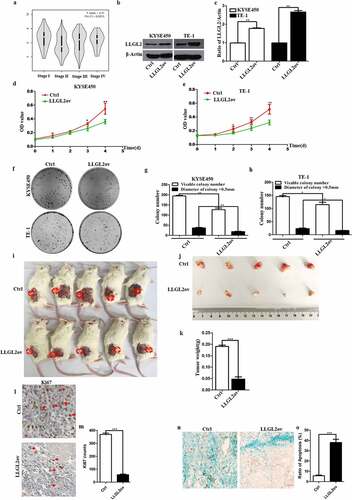
We also conducted colony formation assays to explore whether overexpression of LLGL2 (LLGL2ov) altered single-cell colony formation. As shown in , Increased levels of LLGL2 protein markedly impaired the efficiency of colony formation (194 ± 5 vs. 127 ± 12 colonies/well) (p < .01), and the number of KYSE450 colonies >0.5 mm in diameter was significantly reduced in the LLGL2ov group versus the control (P < .01) (). Moreover, LLGL2 ectopic expression in TE-1 cells also significantly reduced the number of total colonies >0.5 mm in diameter (P < .05) (). These results confirm that LLGL2 plays a suppressive role in the proliferation of ESCC cells in vitro, indicating that LLGL2 acts as a negative regulator in the proliferation of ESCC cells.
We further utilized a xenograft model to assess whether LLGL2 ectopic expression reduces tumor growth in vivo. KYSE450 (LLGL2ov) and KYSE450 (control) cells were transplanted into NCG mice. Significantly, LLGL2 ectopic expression led to a 4-fold reduction in the average weight of tumors when compared with the control (P < .001, n = 5) (). Moreover, we also found that LLGL2 ectopic expression in KYSE450 cells led to decreased proliferation and enhanced apoptosis of these cells in vivo, which was reflected by Ki67 immunostaining (P < .001) () and TUNEL staining (P < .001) (). This finding indicates that the level of LLGL2 protein is correlated with the decreased growth capability of ESCC cells in vivo, suggesting that LLGL2 affects the proliferation of ESCC cells in vitro and in vivo.
LLGL2 overexpression leads to reduced migration and invasion of ESCC cells
LLGL2 has been found to induce MET and suppress Snail tumorigenesis.Citation28 We next tested whether LLGL2 is also involved in other cellular activities, such as cell migration and invasion. As we expected, LLGL2 overexpression led to significantly decreased KYSE450 migration, and a similar result was also found in TE-1 cells. In a wound healing assay, there was a reduction in the healing index from 41.66% (control) to 27.53% (LLGL2ov) for KYSE450 cells (p < .05) () and from 78.84% (control) to 65.9% (LLGL2ov) for TE-1 cells (p < .05) (), respectively.
Figure 5. Ectopic expression of LLGL2 leads to reduced migration and invasion capabilities in ESCC cells. A. KYSE450 cell migration was inhibited by ectopic expression of LLGL2, as shown by wound healing assays (p < .05). Scale bar: 500 µm. B. Ectopic expression of LLGL2 in TE-1 cells suppressed the migration capability with wound healing assays (p < .05). Scale bar: 500 µm. C. Ectopic expression of LLGL2 impaired KYSE450 cell invasion according to the Transwell assay (p < .001). Scale bar: 100 μm. D. Ectopic expression of LLGL2 in TE-1 cells reduced the invasion capability according to the Transwell assay (p < .001). The indicated number of cells per membrane was counted and graphed. Scale bar: 100 μm. E. Ectopic expression of LLGL2 in KYSE450 cells led to an increased level of E-cadherin protein (p < .01). F. E-cadherin protein levels increased after LLGL2 overexpression, as reflected by immunofluorescence with an E-cadherin antibody. Scale bar: 100 μm. *p < .05, **p < .01, ***p < .001 vs. control. Data are the means ± SDs.
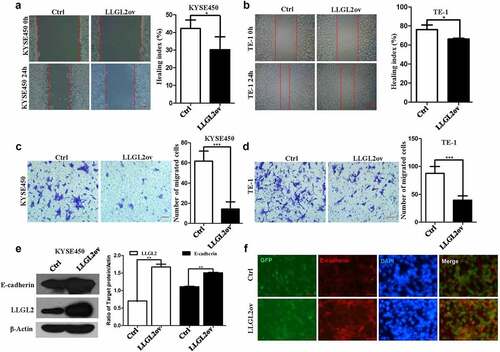
Furthermore, LLGL2 also inhibited ESCC invasion, as shown by a transwell assay. There were significantly fewer cells passing through the filter membrane of the transwell upon LLGL2 ectopic expression (p < .001 for KYSE450 cells and TE-1 cells, ). Consistently, the level of E-cadherin protein, which always decreases during the EMT process, increased in KYSE450 cells upon LLGL2 overexpression when they were tested with western blotting (p < .01, ) and immunofluorescence (). These in vitro findings suggest that elevated LLGL2 protein levels are pivotal for ESCC cell migration and invasion, which is consistent with a previous study in breast cancer.Citation28
LLGL2 contributes to the inhibitory effect on malignant processes of ESCC cells via the changed expression pattern of pivotal genes
To explore the mechanism underlying the tumor inhibitory effects caused by the ectopic expression of LLGL2, we performed RNA sequencing to test the changes in gene expression patterns upon LLGL2 overexpression in KYSE450 cells (n = 3). A total of 386 genes were upregulated by more than 2-fold, and 481 genes were downregulated by more than 1/2-fold in response to LLGL2 overexpression (p < .05). Among these downregulated genes, S100A7 was the most dramatically downregulated gene, and its mRNA level decreased to 0.0011-fold of that in the control group (). Consistently, the sequencing results showed that the mRNA level of LLGL2 increased 4.2-fold in KYSE450 cells after its overexpression in comparison with control cells.
Figure 6. Ectopic expression of LLGL2 leads to changed expression of multiple genes and proteins that have been involved in cancer progression. A. Top 20 genes that were upregulated or downregulated upon LLGL2 overexpression (n = 3 per group). B. Detailed changes in the top 20 genes at the RNA level upon LLGL2 overexpression. C. Biological function analysis through the PANTHER database revealed that the top 20 downregulated genes are involved in multiple biological functions, such as biological regulation, cellular processes, metabolic process, and signaling. LLGL2 is involved in multiple biological functions (as indicated with arrows). D. KEGG pathway clustering analysis was performed by bioinformatics, and pathways in cancer were the most relevant pathway upon LLGL2 overexpression. E. Changes in specific proteins were tested with PRM-MS-based targeted proteomic analysis (n = 3 per group).
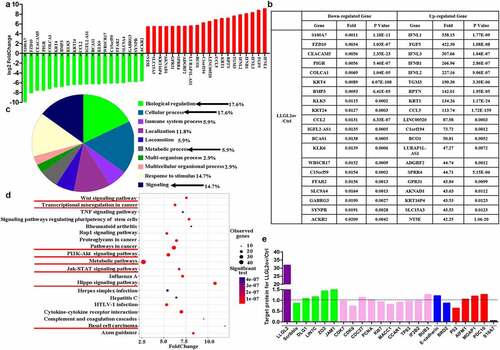
LLGL2 overexpression leads to changes in the mRNA levels of multiple genes that are involved in cancer progression. For example, downregulated mRNAs included those involved in multiple steps of the malignant process, e.g., cell proliferation (KLK6, p = .0006; CCND2, p = 7.24E-06), cell growth (MAP2K6, p = 6.44E-05), cell migration and metastasis (S100A7, p = 1.18E-11). In addition, the mRNA levels of matrix metalloproteinases (MMPs, MMP7, p = .046; MMP9, p = .027) were also downregulated. Moreover, CEACAM5, also known as the coding gene for CEA protein, which has been extensively used for tumor diagnosis and monitoring in clinics, drastically decreased when LLGL2 was overexpressed (p = 2.35E-23). Intriguingly, we also found that the mRNA level of many members belonging to the WNT and IGFBP families was reduced. Here, we found that WNT3A, WNT5A, WNT5B, WNT7B, WNT10A and WNT16 decreased to 0.246-fold (p = .002), 0.035-fold (p = .031), 0.129-fold (p = 4.69E-06), 0.434-fold (p = 4.78E-45), 0.034-fold, (p = 7.93E-05) and 0.127-fold (p = 1.65E-05), respectively, upon LLGL2 overexpression in KYSE450 cells than that in control cells. The mRNA levels of IGFBP2, IGFBP3, IGFBP5 and IGFBP6 decreased to 0.109-fold (p = 4.15E-104), 0.039-fold (p = 4.68E-284), 0.038-fold (p = .039), and 0.136-fold (p = 1.40E-273), respectively, upon LLGL2 overexpression in KYSE450 cells than that in control cells. In contrast, the mRNA levels of TGM3, GSDMD and LINC00520, which are involved in cell apoptosis, pyroptosis and adhesion, were increased by 190.29-fold (p = 3.39E-06), 36.86-fold (p = .021) and 87.97-fold (p = 3.42E-04), respectively, upon LLGL2 overexpression compared with that in KYSE450 control cells. Together, these results are consistent with the reduced growth of KYSE450 cells after LLGL2 overexpression.
Additionally, Protein Analysis Through Evolutionary Relationships (PANTHER) analysis suggested that LLGL2 is functionally associated with biological regulation, cellular processes, metabolic process, and signaling (). Moreover, protein binding is the molecular function that was most significantly affected upon LLGL2 overexpression. KEGG-based clustering analysis revealed that the differentially expressed genes were involved in multiple pathways, including the Hippo signaling pathway, Wnt signaling pathway, pathways in cancer, PI3K-Akt signaling pathway, transcriptional misregulation in cancer, metabolic pathways and Jak-STAT signaling pathway, and 37 differentially expressed genes were involved in the pathways in cancer, which was the most relevant to LLGL2 overexpression ().
To further explain the change in cellular activities caused by LLGL2 overexpression, we specifically tested the levels of some important proteins involved in the physiological activities described above using PRM-MS-based targeted proteomic analysis. As exhibited in , the mean level and changed level of these specific proteins were induced upon LLGL2 ectopic expression. Among these proteins, most are involved in the regulation of cell polarity and junction elevated, such as LLGL2, Disks large homolog 1 (DLG1), Protein lin-7 homolog C (LIN7C), ZO2 and Junctional adhesion molecule A (JAM1). Most proteins involved in cell proliferation declined, including cyclin-dependent kinase 7 (CDK7), cyclin-dependent kinase 9 (CDK9), cell division cycle protein 27 homolog (CDC27), proliferating cell nuclear antigen (PCNA), antigen KI-67 (KI67), metastasis-associated in colon cancer protein 1 (MACC1), cell division cycle and apoptosis regulator protein 1 (CCAR1), tumor protein 63 (TP63), and insulin-like growth Factor 2 mRNA-binding protein 2 (IF2B2). Meanwhile, the level of E-cadherin protein increased, and the level of bromodomain-containing protein 2 (BRD2) decreased, both of which are involved in epithelial-to-mesenchymal transition (EMT) progression. Among apoptosis-related proteins, the level of P53 protein was reduced, while the levels of apoptosis-inducing Factor 1 (AIFM1), modulator of apoptosis 1 (MOAP1) and programmed cell death protein 10 (PDC10) were increased. Consistent with the RNA level achieved by sequencing, the level of S10A7 protein encoded by the S100A7 gene decreased to 0.049-fold relative to that in control cells after LLGL2 ectopic expression (p < .01).
SOX2 protein indirectly regulates the expression of miR-142-3p but does not directly bind to the promoter of miR-142-3p
To determine the comprehensive distribution of SOX2 binding sites on genomic DNA of KYSE450 cells, we analyzed the results of ChIP sequencing (n = 3), and an overview of SOX2 binding sites is shown in . We also plotted the distribution of peak regions around TSS (+5 kb to TSS), as shown in . After enrichment with SOX2 antibody, SOX2 binding was substantially induced around the TSS, whereas the basal SOX2 TSS binding peak did not appreciably change. The location of the peak center was further analyzed, and we found that 54.52% of the peak centers were located in intergenic sites, whereas only 3.5% of the peak centers occurred in the promoters of some genes (). The total profile and specific profile of SOX2 binding sites on genomic DNA and miRNA genes were counted, and a total of 2071 binding sites on genomic DNA and 71 binding sites on miRNA genes were detected. Moreover, only three peak centers were located in the promoter of miRNA genes, including MIR6854, MIR612 and MIR3135B ().
Figure 7. Overview of the binding sites of SOX2 protein on the genome of KYSE450 cells. A. Heatmap of the binding sites of SOX2 protein on the genome of KYSE450 cells after enrichment with SOX2 antibody (n = 3 per group). B. Distribution of peaks within TSS ±5 kb in the KYSE450-SOX2 samples and KYSE450-input control samples. C. Distribution of peak centers on all types of sites within the genome of KYSE450-SOX2 samples and KYSE450-input control samples. D. The total peak distribution of genomic DNA and microRNA genes in KYSE450-SOX2 samples and KYSE450-input control samples. E-G. Enrichment of cellular components, biological processes and molecular functions was performed with genes whose promoter regions contained the peaks. The number in the bracket indicates the number of enriched genes. H. Detailed information on the top five peaks located in the promoter of protein-expressing and lncRNA-expressing genes, and the total three peaks occurred in the promoter of miRNA-expressing genes.
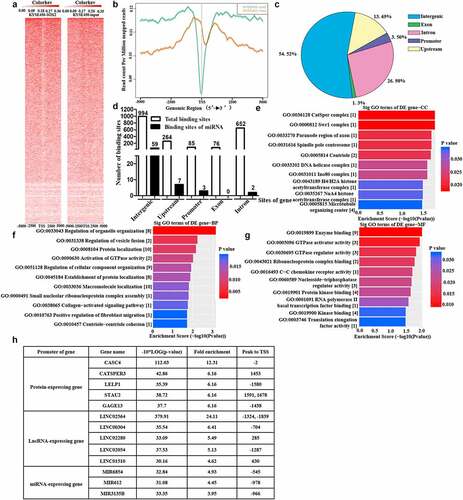
To evaluate the roles of genes regulated by the SOX2 protein, some genes whose promoters comprise enriched binding sites were subjected to functional enrichment analysis. According to the cell component, the most significant genes were categorized as catsper complex, swr1 complex, paranode region of axon, spindle pole centrosome and centriole (). Among the biological processes, the most significant genes were enriched in the regulation of organelle organization, regulation of vesicle fusion and protein localization (). According to the molecular functions, most significant genes were enriched in enzyme binding, GTPase activator activity, and GTPase regulator activity (). In addition, the promoters of the top five protein-expressing or lncRNA-expressing genes consisting of SOX2 binding sites are summarized in , while only three promoters of miRNA-expressing genes comprising the SOX2 binding sites were detected, and no SOX2 protein binding sites were found in the miR-142-3p gene, suggesting that SOX2 indirectly regulates the expression of miR-142-3p. Detailed information regarding these binding sites is shown in .
Discussion
As described above, SOX2 has been involved in cellular activities, including stemness maintenance,Citation10,Citation29,Citation30 cell specification,Citation11 tumor growth and overall survival of patients,Citation8,Citation12,Citation13 metastasis,Citation25,Citation31,Citation32 and chemoresistance.Citation33,Citation34 Moreover, SOX2 amplification is always found in multiple cancers,Citation13,Citation35 and a high level of SOX2 has been validated in ESCC clinical samples.Citation20 Therefore, SOX2 has been proposed as an oncogene and potential target for cancer therapy,Citation15,Citation20,Citation36,Citation37 and we have developed a synthetic peptide to inhibit ESCC malignant progression.Citation20 SOX2 protein also regulates tumor metastasis, which is regulated via the EMT process and the disruption of cell polarity. We previously found that SOX2 can regulate the miR-181a-5p and miR30e-5p/TUSC3 axes, thereby influencing the translation of TUSC3 and playing a pivotal role in breast cancer metastasis.Citation25 However, the role of SOX2 protein in the invasion regulation of ESCC remains elusive.
Apical-basal cell polarity is one of the most important properties of cells, and it is essential for regulating many biological processes, such as mitotic exit.Citation38 It is regulated by several protein complexes, including the Crumbs complex, Par complex, Scribble complex and integrated PDZ protein complex.Citation39 The loss or disruption of cell polarity promotes tumorigenesis and EMT progression. EMT enables tumors to metastasize to distant sites, and it is required for tumor progression. During the EMT process, it requires a disruption in the normal polarity and cell‒cell adhesion of cells, together with the acquisition of a fibroblastoid motile phenotype. However, cell polarity can also be transcriptionally regulated by EMT inducers, especially the ZEB and Snail factors, through complex networks.Citation40 ZEB1 suppresses the expression of cell polarity factors, especially LLGL2 protein, thereby promoting the loss of cell polarity in cancer and eventually leading to metastasis.Citation41 Intriguingly, disruption of polarity proteins promotes rewiring of oncogene and tumor suppressor signaling pathways to disrupt proliferation, apoptosis, invasion, and metastasis.Citation42 For example, depleting or mislocalizing Scribble in cells of the mammary epithelium disrupts cell polarity and promotes tumorigenesis.Citation24
To explore the underlying mechanism of SOX2 protein in polarity regulation and dissect the relationships between SOX2 and polarity protein, we revealed the miRNAs that are regulated by SOX2 protein using microarray, and we found that miR-142-3p was the most significantly downregulated miRNA that can target polarity protein upon SOX2 knockdown. A previous study demonstrated that a high level of miR-142-3p was linked to poor prognosis in ESCC patients, particularly among those patients with small tumors, a lack of lymph node metastases, or at an early stage.Citation27 Other studies further revealed that miR-142-3p is oncogenic since it is linked to the migration, proliferation and apoptosis of cancer cells.Citation43,Citation44 Circulating miR-142-3p in serum is also associated with a high risk of recurrence and can be used for risk assessment,Citation45 suggesting that miR-142-3p is necessary for the malignant processes of cancer cells. Suppressing roles of miR-142-3p in cancer cells were also explored in other studies,Citation46,Citation47 implying that miR-142-3p may play different roles based on the type of cancer.
As a pivotal member of the Scribble polarity complex, LLGL2 protein is an indispensable regulator of cellular activities such as polarity, cell division, hemidesmosome formation, and signaling pathways, and it also contributes to malignant progression.Citation48–51 Moreover, the loss or aberrant location of LLGL2 protein was also found in gastric epithelial dysplasia and adenocarcinoma, pancreatic intraepithelial neoplasia-3 and adenocarcinoma, and lung cancer,Citation52–55 suggesting that LLGL2 may be a putative tumor suppressor. Using a zebrafish model, the pen/LGL2 mutant exhibits two key cellular and molecular features of mammalian malignancy, cell autonomous epidermal neoplasia and EMT of basal epidermal cells, and neoplasia and EMT are promoted by ErbB signaling.Citation56 LLGL2 also induces mesenchymal-epithelial transition (MET) and suppresses Snail tumorigenesis,Citation28 suggesting that LLGL2 is closely correlated with mesenchymal and epithelial status.Citation54 Here, we found that the levels of LLGL2 mRNA and protein are both downregulated in clinical cancer biopsies compared to matched normal tissues. LLGL2 ectopic expression inhibits the proliferation, migration, invasion, and tumor growth of ESCC, which is consistent with previous studies in other cancers, and these findings are consistent with its tumor suppressor function.Citation28 Notably, LLGL2 is also overexpressed in ER+ breast cancer and promotes cell proliferation under nutrient stress by regulating the cell surface level of SLC7A5, a pivotal leucine transporter.Citation57
LLGL2 overexpression also affects the expression pattern of some genes in KYSE450 cells after RNA sequencing, and it inhibits malignant processes by reducing the expression of some oncogenic genes, such as S100A7,Citation58,Citation59 CEACAM5,Citation60 KLK6Citation61 and MMP7/9, or by increasing the expression of some tumor-suppressive genes, including TGM3.Citation62 Consistently, we found that the mRNA level of SQRDL increases to 3.1-fold after LLGL2 overexpression when compared with its level in control cells. A similar result was also found in KYSE450 cells using a specific peptide aptamer that targets SOX2 protein.Citation20 Moreover, the mRNA level of MAP2K6, which can promote the growth of esophageal adenocarcinoma cells in our previous study,Citation63 decreased to 0.211-fold of its level in control cells. We further confirmed that the differentially expressed genes caused by LLGL2 overexpression are involved in multiple malignant pathways, including the Wnt signaling pathway and transcriptional misregulation in cancer.
To better explore the mechanisms underlying the suppression of cellular activities upon the ectopic expression of LLGL2, we also used the PRM-MS method to analyze a series of proteins that are pivotal for cell proliferation, cell invasion, apoptosis, tumor growth and metastasis, and the results of RNA sequencing were consistent with the PRM-MS test based on the changed levels of LLGL2 and S10A7. As we expected, fewer differences between the LLGL2ov group and the control occurred in other polarity proteins, such as Scribble, DLG1 and LIN7C. In contrast, both ZO-2 and JAM1, which are involved in cellular junctions and tumor suppression,Citation64–66 are dramatically elevated after LLGL2 overexpression. Interestingly, several important apoptosis-related proteins, such as p53, AIFM1, MOAP1 and PDC10, also changed with LLGL2 overexpression.
To determine the relationships between the SOX2 protein and miR-142-3p, we also used a ChIP experiment to elucidate whether the SOX2 protein directly binds to the promoter of the miR-142-3p gene. Interestingly, only three peaks of SOX2 binding sites were found in the promoter of miRNA genes, except the promoter of the miR-142-3p gene, suggesting that SOX2 protein indirectly affects the expression of miR-142-3p, thereby regulating the translation of LLGL2 protein. However, correlations between the promoter of miR-142-3p and downstream proteins regulated by the SOX2 protein should be fully elucidated in the future.
In summary, we found that SOX2 controls the expression of miR-142-3p and its downstream target, the cellular polarity protein LLGL2 (). Knockdown of SOX2 reduced miR-142-3p expression and increased LLGL2 protein levels, while LLGL2 overexpression directly impaired ESCC cell proliferation and invasion. This suggests that the SOX2/miR-142-3p/LLGL2 regulatory axis plays a pivotal role in the development of ESCC, thus highlighting this axis as a potential avenue for future therapeutic intervention.
Figure 8. Working model: SOX2 regulates miR-142-3p expression and LLGL2 translation, thereby affecting ESCC cell proliferation, migration, invasion, apoptosis, and tumor growth through the SOX2/miR-142-3p/LLGL2 axis.
Contributors
SHZ, YYC and QH performed cell culture, western blot, IHC and qPCR experiments. TTZ, ZW, YJZ, YXW, HZZ, JKW, YXY, JYZ, SLS, YJZ, LY and ZCF planned the project and participated coordination. KCL analysed the data and designed the study, prepared the figures, performed the statistical analysis, and wrote the manuscript. All authors read and approved the final manuscript.
Ethics approval and consent to participate
The mice manipulation and clinical samples collection in this study was approved by the Medical Ethics Committee of Dongfang Hospital of the Xiamen University.
Availability of data and materials
The data used to support these findings of this study are available from the corresponding author upon reasonable request.
Supplemental Material
Download Zip (1.5 MB)Disclosure statement
The authors declare that they have no competing interests.
Supplementary material
Supplemental data for this article can be accessed online at https://doi.org/10.1080/15384047.2022.2126248
Additional information
Funding
References
- Chen W, Zheng R, Baade PD, Zhang S, Zeng H, Bray F, Jemal A, Yu XQ, He J. Cancer statistics in China, 2015. CA Cancer J Clin. 2016;66(2):115–132. doi:10.3322/caac.21338.
- Pennathur A, Gibson MK, Jobe BA, Luketich JD. Oesophageal carcinoma. Lancet. 2013;381(9864):400–412. doi:10.1016/S0140-6736(12)60643-6.
- Liu K, Zhao T, Wang J, Chen Y, Zhang R, Lan X, Que J. Etiology, cancer stem cells and potential diagnostic biomarkers for esophageal cancer. Cancer Lett. 2019;458:21–28. doi:10.1016/j.canlet.2019.05.018.
- Gao YB, Chen ZL, Li JG, Hu XD, Shi XJ, Sun ZM, Zhang F, Zhao Z-R, Li Z-T, Liu Z-Y, et al. Genetic landscape of esophageal squamous cell carcinoma. Nat Genet. 2014;46(10):1097–1102. doi:10.1038/ng.3076.
- Qu Y, Zhang S, Cui L, Wang K, Song C, Wang P, et al. Two novel polymorphisms in PLCE1 are associated with the susceptibility to esophageal squamous cell carcinoma in Chinese population. Dis Esophagus. 2017;30(1):1–7. doi:10.1111/dote.12463.
- Song Y, Li L, Ou Y, Gao Z, Li E, Li X, Zhang W, Wang J, Xu L, Zhou Y, et al. Identification of genomic alterations in oesophageal squamous cell cancer. Nature. 2014;509(7498):91–95. doi:10.1038/nature13176.
- Wu C, Wang Z, Song X, Feng X-S, Abnet CC, He J, Hu N, Zuo X-B, Tan W, Zhan Q, et al. Joint analysis of three genome-wide association studies of esophageal squamous cell carcinoma in Chinese populations. Nat Genet. 2014;46(9):1001–1006. doi:10.1038/ng.3064.
- Liu K, Jiang M, Lu Y, Chen H, Sun J, Wu S, Ku W-Y, Nakagawa H, Kita Y, Natsugoe S, et al. Sox2 cooperates with inflammation-mediated Stat3 activation in the malignant transformation of foregut basal progenitor cells. Cell Stem Cell. 2013;12(3):304–315. doi:10.1016/j.stem.2013.01.007.
- Que J, Luo X, Schwartz RJ, Hogan BL. Multiple roles for Sox2 in the developing and adult mouse trachea. Development. 2009;136(11):1899–1907. doi:10.1242/dev.034629.
- Takahashi K, Tanabe K, Ohnuki M, Narita M, Ichisaka T, Tomoda K, Yamanaka S. Induction of pluripotent stem cells from adult human fibroblasts by defined factors. Cell. 2007;131(5):861–872. doi:10.1016/j.cell.2007.11.019.
- Trisno SL, Philo KED, McCracken KW, Cata EM, Ruiz-Torres S, Rankin SA, Han L, Nasr T, Chaturvedi P, Rothenberg ME, et al. Esophageal organoids from human pluripotent stem cells delineate Sox2 functions during esophageal specification. Cell Stem Cell. 2018;23(4):501–515.e7. doi:10.1016/j.stem.2018.08.008.
- Gen Y, Yasui K, Nishikawa T, Yoshikawa T. SOX2 promotes tumor growth of esophageal squamous cell carcinoma through the AKT/mammalian target of rapamycin complex 1 signaling pathway. Cancer Sci. 2013;104(7):810–816. doi:10.1111/cas.12155.
- Bass AJ, Watanabe H, Mermel CH, Yu S, Perner S, Verhaak RG, Kim SY, Wardwell L, Tamayo P, Gat-Viks I, et al. SOX2 is an amplified lineage-survival oncogene in lung and esophageal squamous cell carcinomas. Nat Genet. 2009;41(11):1238–1242. doi:10.1038/ng.465.
- Liu K, Lin B, Zhao M, Yang X, Chen M, Gao A, Liu F, Que J, Lan X. The multiple roles for Sox2 in stem cell maintenance and tumorigenesis. Cell Signal. 2013;25(5):1264–1271. doi:10.1016/j.cellsig.2013.02.013.
- Huser L, Novak D, Umansky V, Altevogt P, Utikal J. Targeting SOX2 in anticancer therapy. Expert Opin Ther Targets. 2018;22(12):983–991. doi:10.1080/14728222.2018.1538359.
- Ji J, Yu Y, Li ZL, Chen MY, Deng R, Huang X, Wang G-F, Zhang M-X, Yang Q, Ravichandran S, et al. XIAP limits autophagic degradation of Sox2 and is a therapeutic target in nasopharyngeal carcinoma stem cells. Theranostics. 2018;8(6):1494–1510. doi:10.7150/thno.21717.
- Jia Y, Gu D, Wan J, Yu B, Zhang X, Chiorean EG, et al. The role of GLI-SOX2 signaling axis for gemcitabine resistance in pancreatic cancer. Oncogene. 2019;38(10):1764–1777. doi:10.1038/s41388-018-0553-0.
- Singh S, Trevino J, Bora-Singhal N, Coppola D, Haura E, Altiok S, Chellappan SP. EGFR/Src/Akt signaling modulates Sox2 expression and self-renewal of stem-like side-population cells in non-small cell lung cancer. Mol Cancer. 2012;11:73. doi:10.1186/1476-4598-11-73.
- Yoo YA, Vatapalli R, Lysy B, Mok H, Desouki MM, Abdulkadir SA. The role of castration-resistant Bmi1+Sox2+ cells in driving recurrence in prostate cancer. J Natl Cancer Inst. 2019;111(3):311–321. doi:10.1093/jnci/djy142.
- Liu K, Xie F, Zhao T, Zhang R, Gao A, Chen Y, Li H, Zhang S, Xiao Z, Li J, et al. Targeting SOX2 protein with peptide aptamers for therapeutic gains against esophageal squamous cell carcinoma. Mol Ther. 2020;28(3):901–913. doi:10.1016/j.ymthe.2020.01.012.
- Croce CM. Causes and consequences of microRNA dysregulation in cancer. Nat Rev Genet. 2009;10(10):704–714. doi:10.1038/nrg2634.
- Esquela-Kerscher A, Slack FJ. Oncomirs - microRNAs with a role in cancer. Nat Rev Cancer. 2006;6(4):259–269. doi:10.1038/nrc1840.
- Liu A, Zhu J, Wu G, Cao L, Tan Z, Zhang S, Jiang L, Wu J, Li M, Song L, et al. Antagonizing miR-455-3p inhibits chemoresistance and aggressiveness in esophageal squamous cell carcinoma. Mol Cancer. 2017;16(1):106. doi:10.1186/s12943-017-0669-9.
- Zhan L, Rosenberg A, Bergami KC, Yu M, Xuan Z, Jaffe AB, Allred C, Muthuswamy SK. Deregulation of scribble promotes mammary tumorigenesis and reveals a role for cell polarity in carcinoma. Cell. 2008;135(5):865–878. doi:10.1016/j.cell.2008.09.045.
- Liu K, Xie F, Gao A, Zhang R, Zhang L, Xiao Z, Hu Q, Huang W, Huang Q, Lin B, et al. SOX2 regulates multiple malignant processes of breast cancer development through the SOX2/miR-181a-5p, miR-30e-5p/TUSC3 axis. Mol Cancer. 2017;16(1):62. doi:10.1186/s12943-017-0632-9.
- Jiang M, Ku W-Y, Zhou Z, Dellon ES, Falk GW, Nakagawa H, Wang M-L, Liu K, Wang J, Katzka DA, et al. BMP-driven NRF2 activation in esophageal basal cell differentiation and eosinophilic esophagitis. J Clin Invest. 2015;125(4):1557–1568. doi:10.1172/JCI78850.
- Lin RJ, Xiao DW, Liao LD, Chen T, Xie ZF, Huang WZ, Wang W-S, Jiang T-F, Wu B-L, Li E-M, et al. MiR-142-3p as a potential prognostic biomarker for esophageal squamous cell carcinoma. J Surg Oncol. 2012;105(2):175–182. doi:10.1002/jso.22066.
- Kashyap A, Zimmerman T, Ergul N, Bosserhoff A, Hartman U, Alla V, Bataille F, Galle PR, Strand S, Strand D, et al. The human Lgl polarity gene, Hugl-2, induces MET and suppresses Snail tumorigenesis. Oncogene. 2013;32(11):1396–1407. doi:10.1038/onc.2012.162.
- Fong H, Hohenstein KA, Donovan PJ. Regulation of self-renewal and pluripotency by Sox2 in human embryonic stem cells. Stem Cells. 2008;26(8):1931–1938. doi:10.1634/stemcells.2007-1002.
- Basu-Roy U, Bayin NS, Rattanakorn K, Han E, Placantonakis DG, Mansukhani A, Basilico C. Sox2 antagonizes the Hippo pathway to maintain stemness in cancer cells. Nat Commun. 2015;6:6411. doi:10.1038/ncomms7411.
- Li X, Xu Y, Chen Y, Chen S, Jia X, Sun T, Liu Y, Li X, Xiang R, Li N, et al. SOX2 promotes tumor metastasis by stimulating epithelial-to-mesenchymal transition via regulation of WNT/beta-catenin signal network. Cancer Lett. 2013;336(2):379–389 . doi:10.1016/j.canlet.2013.03.027.
- Xiang R, Liao D, Cheng T, Zhou H, Shi Q, Chuang TS, Markowitz D, Reisfeld RA, Luo Y. Downregulation of transcription factor SOX2 in cancer stem cells suppresses growth and metastasis of lung cancer. Br J Cancer. 2011;104(9):1410–1417. doi:10.1038/bjc.2011.94.
- Jeon HM, Sohn YW, Oh SY, Kim SH, Beck S, Kim S, Kim H. ID4 imparts chemoresistance and cancer stemness to glioma cells by derepressing miR-9*-mediated suppression of SOX2. Cancer Res. 2011;71(9):3410–3421. doi:10.1158/0008-5472.CAN-10-3340.
- Jia Y, Gu D, Wan J, Yu B, Zhang X, Chiorean EG, et al. The role of GLI-SOX2 signaling axis for gemcitabine resistance in pancreatic cancer. Oncogene. 2019;38(10):1764–1777. doi:10.1038/s41388-018-0553-0.
- Maier S, Wilbertz T, Braun M, Scheble V, Reischl M, Mikut R, Menon R, Nikolov P, Petersen K, Beschorner C, et al. SOX2 amplification is a common event in squamous cell carcinomas of different organ sites. Hum Pathol. 2011;42(8):1078–1088. doi:10.1016/j.humpath.2010.11.010.
- Schmitz M, Temme A, Senner V, Ebner R, Schwind S, Stevanovic S, Wehner R, Schackert G, Schackert HK, Fussel M, et al. Identification of SOX2 as a novel glioma-associated antigen and potential target for T cell-based immunotherapy. Br J Cancer. 2007;96(8):1293–1301. doi:10.1038/sj.bjc.6603696.
- Zhang S, Xiong X, Sun Y. Functional characterization of SOX2 as an anticancer target. Signal Transduct Target Ther. 2020;5(1):135. doi:10.1038/s41392-020-00242-3.
- Hofken T, Schiebel E. A role for cell polarity proteins in mitotic exit. EMBO J. 2002;21(18):4851–4862. doi:10.1093/emboj/cdf481.
- Bilder D, Schober M, Perrimon N. Integrated activity of PDZ protein complexes regulates epithelial polarity. Nat Cell Biol. 2003;5(1):53–58. doi:10.1038/ncb897.
- Moreno-Bueno G, Portillo F, Cano A. Transcriptional regulation of cell polarity in EMT and cancer. Oncogene. 2008;27(55):6958–6969. doi:10.1038/onc.2008.346.
- Spaderna S, Schmalhofer O, Wahlbuhl M, Dimmler A, Bauer K, Sultan A, Hlubek F, Jung A, Strand D, Eger A, et al. The transcriptional repressor ZEB1 promotes metastasis and loss of cell polarity in cancer. Cancer Res. 2008;68(2):537–544. doi:10.1158/0008-5472.CAN-07-5682.
- Halaoui R, McCaffrey L. Rewiring cell polarity signaling in cancer. Oncogene. 2015;34(8):939–950. doi:10.1038/onc.2014.59.
- Li YF, Chen DQ, Jin L, Liu JJ, Li YC, Su ZM, QI Z, SHI M, JIANG Z, YANG S, et al. Oncogenic microRNA-142-3p is associated with cellular migration, proliferation and apoptosis in renal cell carcinoma. Oncol Lett. 2016;11(2):1235–1241. doi:10.3892/ol.2015.4021.
- Tanaka K, Kondo K, Kitajima K, Muraoka M, Nozawa A, Hara T. Tumor-suppressive function of protein-tyrosine phosphatase non-receptor type 23 in testicular germ cell tumors is lost upon overexpression of miR142-3p microRNA. J Bio Chem. 2013;288(33):23990–23999. doi:10.1074/jbc.M113.478891.
- Kaduthanam S, Gade S, Meister M, Brase JC, Johannes M, Dienemann H, Warth A, Schnabel PA, Herth FJF, Sültmann H, et al. Serum miR-142-3p is associated with early relapse in operable lung adenocarcinoma patients. Lung Cancer. 2013;80(2):223–227. doi:10.1016/j.lungcan.2013.01.013.
- Mansoori B, Mohammadi A, Ghasabi M, Shirjang S, Dehghan R, Montazeri V, Holmskov U, Kazemi T, Duijf P, Gjerstorff M, et al. miR-142-3p as tumor suppressor miRNA in the regulation of tumorigenicity, invasion and migration of human breast cancer by targeting Bach-1 expression. J Cell Physiol. 2019;234(6):9816–9825. doi:10.1002/jcp.27670.
- Liang L, Fu J, Wang S, Cen H, Zhang L, Mandukhail SR, Du L, Wu Q, Zhang P, Yu X, et al. MiR-142-3p enhances chemosensitivity of breast cancer cells and inhibits autophagy by targeting HMGB1. Acta Pharm Sin B. 2020;10(6):1036–1046. doi:10.1016/j.apsb.2019.11.009.
- Cao F, Miao Y, Xu K, Liu P. Lethal (2) giant larvae: an indispensable regulator of cell polarity and cancer development. Int J Biol Sci. 2015;11(4):380–389. doi:10.7150/ijbs.11243.
- Sonawane M, Martin-Maischein H, Schwarz H, Nusslein-Volhard C. Lgl2 and E-cadherin act antagonistically to regulate hemidesmosome formation during epidermal development in zebrafish. Development. 2009;136(8):1231–1240. doi:10.1242/dev.032508.
- Nakajima Y, Gibson MC. Epithelial cell division: aurora kicks Lgl to the cytoplasmic curb. Curr Biol. 2015;25(1):R43–5. doi:10.1016/j.cub.2014.11.052.
- Portela M, Parsons LM, Grzeschik NA, Richardson HE. Regulation of Notch signaling and endocytosis by the Lgl neoplastic tumor suppressor. Cell Cycle. 2015;14(10):1496–1506 doi:10.1080/15384101.2015.1026515.
- Lisovsky M, Dresser K, Baker S, Fisher A, Woda B, Banner B, et al. Cell polarity protein Lgl2 is lost or aberrantly localized in gastric dysplasia and adenocarcinoma: an immunohistochemical study. Modern Pathol. 2009;22(7):977–984. doi:10.1038/modpathol.2009.68.
- Lisovsky M, Dresser K, Woda B, Mino-Kenudson M. Immunohistochemistry for cell polarity protein lethal giant larvae 2 differentiates pancreatic intraepithelial neoplasia-3 and ductal adenocarcinoma of the pancreas from lower-grade pancreatic intraepithelial neoplasias. Hum Pathol. 2010;41(6):902–909. doi:10.1016/j.humpath.2009.12.004.
- Nam KH, Kim MA, Choe G, Kim WH, Lee HS. Deregulation of the cell polarity protein Lethal giant larvae 2 (Lgl2) correlates with gastric cancer progression. Gastric Cancer. 2014;17(4):610–620. doi:10.1007/s10120-013-0324-0.
- Imamura N, Horikoshi Y, Matsuzaki T, Toriumi K, Kitatani K, Ogura G, Masuda R, Nakamura N, Takekoshi S, Iwazaki M, et al. Localization of aPKC lambda/iota and its interacting protein, Lgl2, is significantly associated with lung adenocarcinoma progression. Tokai J Exp Clin Med. 2013;38(4):146–158.
- Reischauer S, Levesque MP, Nusslein-Volhard C, Sonawane M, Mullins MC. Lgl2 Executes Its Function as a Tumor Suppressor by Regulating ErbB Signaling in the Zebrafish Epidermis. PLoS Genet. 2009;5(11):e1000720. doi:10.1371/journal.pgen.1000720.
- Saito Y, Li L, Coyaud E, Luna A, Sander C, Raught B, Asara JM, Brown M, Muthuswamy SK. LLGL2 rescues nutrient stress by promoting leucine uptake in ER(+) breast cancer. Nature. 2019;569(7755):275–279. doi:10.1038/s41586-019-1126-2.
- Li Y, Kong F, Shao Q, Wang R, Hu E, Liu J, et al. YAP expression and activity are suppressed by S100A7 via p65/NFkappaB-mediated repression of DeltaNp63. Mol Cancer Res. 2017;15(12):1752–1763 doi:10.1158/1541-7786.MCR-17-0349.
- Mayama A, Takagi K, Suzuki H, Sato A, Onodera Y, Miki Y, Sakurai M, Watanabe T, Sakamoto K, Yoshida R, et al. OLFM4, LY6D and S100A7 as potent markers for distant metastasis in estrogen receptor-positive breast carcinoma. Cancer Sci. 2018;109(10):3350–3359. doi:10.1111/cas.13770.
- van der Kaaij RT, Voncken FEM, van Dieren JM, Snaebjornsson P, Korse CM, Grootscholten C, et al. Elevated pretreatment CEA and CA19-9 levels are related to early treatment failure in esophageal adenocarcinoma. Am J Clin Oncol. 2019;42(4):345–350. doi:10.1097/COC.0000000000000525.
- Sells E, Pandey R, Chen H, Skovan BA, Cui H, Ignatenko NA. Specific microRNA-mRNA regulatory network of colon cancer invasion mediated by tissue kallikrein-related peptidase 6. Neoplasia. 2017;19(5):396–411. doi:10.1016/j.neo.2017.02.003.
- Li W, Zhang Z, Zhao W, Han N. Transglutaminase 3 protein modulates human esophageal cancer cell growth by targeting the NF-kappaB signaling pathway. Oncol Rep. 2016;36(3):1723–1730. doi:10.3892/or.2016.4921.
- Lin S, Liu K, Zhang Y, Jiang M, Lu R, Folts CJ, et al. Pharmacological targeting of p38 MAP-Kinase 6 (MAP2K6) inhibits the growth of esophageal adenocarcinoma. Cell Signal. 2018;51:222–232. doi:10.1016/j.cellsig.2018.08.008.
- Sambrotta M, Strautnieks S, Papouli E, Rushton P, Clark BE, Parry DA, Logan CV, Newbury LJ, Kamath BM, Ling S, et al. Mutations in TJP2 cause progressive cholestatic liver disease. Nat Genet. 2014;46(4):326–328. doi:10.1038/ng.2918.
- Zhou S, Hertel PM, Finegold MJ, Wang L, Kerkar N, Wang J, Wong LJC, Plon SE, Sambrotta M, Foskett P, et al. Hepatocellular carcinoma associated with tight-junction protein 2 deficiency. Hepatology. 2015;62(6):1914–1916. doi:10.1002/hep.27872.
- Orlandella FM, Mariniello RM, Iervolino PLC, Auletta L, De Stefano AE, Ugolini C, Greco A, Mirabelli P, Pane K, Franzese M, et al. Junctional adhesion molecule-A is down-regulated in anaplastic thyroid carcinomas and reduces cancer cell aggressiveness by modulating p53 and GSK3 α/β pathways. Mol Carcinog. 2019;58(7):1181–1193. doi:10.1002/mc.23001.