
Abstract
Leucine carboxyl methyltransferase-1 (LCMT1) and protein phosphatase methylesterase-1 (PME-1) are essential enzymes that regulate the methylation of the protein phosphatase 2A catalytic subunit (PP2AC). LCMT1 and PME-1 have been linked to the regulation of cell growth and proliferation, but the underlying mechanisms have remained elusive. We show here an important role for an LCMT1-PME-1 methylation equilibrium in controlling mitotic spindle size. Depletion of LCMT1 or overexpression of PME-1 led to long spindles. In contrast, depletion of PME-1, pharmacological inhibition of PME-1 or overexpression of LCMT1 led to short spindles. Furthermore, perturbation of the LCMT1-PME-1 methylation equilibrium led to mitotic arrest, spindle assembly checkpoint activation, defective cell divisions, induction of apoptosis and reduced cell viability. Thus, we propose that the LCMT1-PME-1 methylation equilibrium is critical for regulating mitotic spindle size and thereby proper cell division.
Introduction
Leucine carboxyl methyltransferase-1 (LCMT1) is a monomeric 38-kDa protein that catalyzes the transfer of methyl groups from S-Adenosyl-L-Methionine (SAM) to the α-carboxyl leucine of the catalytic subunit of protein phosphatase 2A (PP2AC).Citation1 The PP2A phosphatase has established roles in cell signaling and cell proliferation, and is composed of a scaffold subunit (A subunit), a catalytic subunit (C subunit), and one of many regulatory subunits (B, B′, B″, B‴ subunits) that provide substrate specificity and generate >60 PP2A holoenzymes.Citation2,3 Methylation of PP2AC controls its association with specific regulatory subunits (B subunits), thus modulating PP2A activity toward specific substrates.Citation2,4 This methylation is reversible by the protein phosphatase methylesterase-1 (PME-1).Citation5,6 Other than PP2AC, there are no known substrates of LCMT1 or PME-1, thus it has been hypothesized that the main role of these enzymes is to regulate the abundance of specific PP2A holoenzymes. Interestingly, homozygous deletion of either LCMT1 or PME-1 in mice is embryonic lethal, indicating that their role in regulating PP2A through methylation/demethylation is critical for cell growth and development.Citation7,8
A recent report demonstrated that depletion of LCMT1 led to an abnormal progression through mitosis and an increase in cell death,Citation7 thus implicating LCMT1 in the regulation of normal cell division and survival. However, the mechanism of how LCMT1 functions to promote proper cell division has remained elusive. As PME-1 counteracts LCMT1 methylation activity, it is reasonable to postulate that PME-1 might also have a role in regulating cell division. However, this hypothesis has also remained unexplored. In this study, we have analyzed the role of LCMT1 and PME-1 in cell division. Surprisingly, we uncovered a previously undescribed methylation equilibrium established by LCMT1 and PME-1 that is critical for regulating mitotic spindle size, and its misregulation leads to defective cell divisions and reduced cell viability.
Results
Perturbation of the LCMT1-PME-1 methylation equilibrium leads to an abnormal mitotic spindle size
To define the role of LCMT1 in cell division and to determine if PME-1 was required for proper cell division, we analyzed the cellular consequences of depleting LCMT1 and PME-1. First, we verified that siRNA oligonucleotides targeting LCMT1 (siLCMT1) and PME-1 (siPME-1) were able to deplete LCMT1 and PME-1 protein levels compared to non-targeting siRNAs (siControl) (; Fig. S1). Human HeLa cells were then transfected with siControl, siLCMT1, or siPME-1 for 48 hours. Cells were fixed, costained for DNA, α-tubulin and Pericentrin, and imaged by fluorescence microscopy (). Interestingly, depletion of LCMT1 led to abnormally long spindles with spindle multipolarity and aberrant unaligned chromosomes (; Fig. S2). Conversely, depletion of PME-1 led to abnormally short spindles and partially aligned chromosomes at the metaphase plate (; Fig. S2). Quantitative analysis of these data showed that depletion of both LCMT1 and PME-1 led to a major increase in the percentage of mitotic cells (siLCMT1= 33.6 ± 3.7 (p = 0.0011) and siPME-1= 30.3 ± 6.0 (p = 0.033) compared to siControl = 8.7 ± 1.7) (), aberrant mitotic spindles (siLCMT1 displayed predominantly long spindles = 27.7 ± 2.1 (p = 0.0008) and multipolar spindles = 30.3 ± 2.0 (p = 0.0014) compared to siControl = 4.3 ± 1.2 and 9.7 ± 1.7 respectively and siPME-1 displayed predominantly short spindles = 41.3 ± 2.9 (p = 0.0001) compared to siControl = 4.6 ± 0.9) (), and an increase in the percentage of cells with unaligned chromosomes (siLCMT1= 53 ± 5.1 (p = 0.0027) and siPME-1= 51 ± 2.2 (p = 0.0001) compared to siControl = 7 ± 2.2) (). These data indicated that LCMT1 and PME-1 likely played a role in regulating mitotic spindle size and that depletion of either led to defects in spindle size and assembly.
Figure 1. For figure legend, see page 1951. Figure 1 (See previous page). RNAi-mediated perturbation of the LCMT1-PME-1 methylation equilibrium leads to misregulation of spindle size and cell division. (A) siRNA knockdown of LCMT1 or PME-1 expression levels compared to control non-targeting siRNA. Note that the levels of demethylated PP2AC decreases in PME-1 depleted cells and increases in LCMT1 depleted cells. (B) Immunofluorescence microcopy showing that PME-1 depletion leads to abnormally short spindles and LCMT1 depletion leads to abnormally long spindles. Bar = 5 μm. (C) Quantification of the percentage of cells in mitosis showing that depletion of LCMT1 or PME-1 leads to a major increase in cells arrested in mitosis. (D) Quantification of the percentage of mitotic cells with abnormal spindles (short, long, multipolar) showing that depletion of LCMT1 or PME-1 leads to a major increase in abnormal spindles. (E) Quantification of the percentage of mitotic cells with unaligned chromosomes showing that depletion of LCMT1 or PME-1 leads to a major increase in unaligned chromosomes. (F) Outline of metaphase spindle pole-to-pole (PTP) distance and width measurements. (G) Quantification of metaphase spindle PTP distance (in μm) showing that depletion of PME-1 leads to abnormally short spindles and depletion of LCMT1 depletion leads to abnormally long spindles. (H) Quantification of metaphase spindle width (in μm) showing that depletion of PME-1 leads to abnormally short spindle widths, while depletion of LCMT1 had no significant effect on spindle width. (I) Quantification of metaphase spindle volume (in μm3) showing that depletion of PME-1 leads to a decrease in volume and depletion of LCMT1 leads to an increase in volume. (J) Quantification of the total fluorescence intensity of mitotic spindle microtubules for PME-1 or LCMT1-depleted cells, in arbitrary units (A.U.), showing that depletion of PME-1 leads to a decrease in total microtubule polymer, whereas depletion of LCMT1 leads to an increase in total microtubule polymer. (K) Model of the LCMT1-PME-1 methylation equilibrium that regulates spindle size and normal cell division. (C, D, F–J) Data represents average ± SDs of 3 independent experiments. * = P < 0.05, ** = P < 0.005, *** = P < 0.0005, ns = not statistically significant.
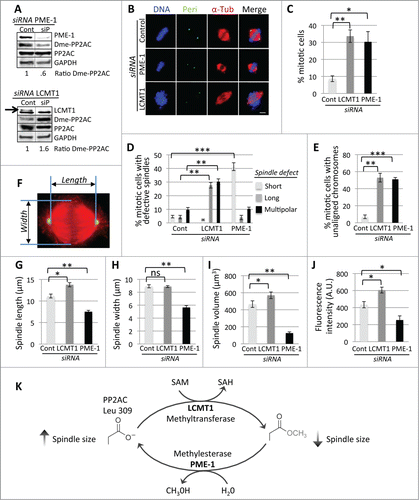
Since depletion of LCMT1 and PME-1 appeared to have opposing effects on spindle length, we analyzed this in more detail by measuring the pole-to-pole (PTP) distance of siControl, siLCMT1 or siPME-1 metaphase spindles (). siControl cells had a PTP distance of 11.2 μm ± .45, whereas siLCMT1 metaphase spindles were longer (13.8 μm ± .49, p = 0.0056) and those of siPME-1 were shorter (7.5 μm ± .32, p = 0.0041) (). However, siLCMT1 cells had a similar spindle width (8.9 μm ± .15) to siControl cells (8.9 μm ± .24), whereas the spindle width of siPME-1 cells was shorter (5.6 μm ± .3, p = 0.0007) (). Nonetheless, the total spindle volume was abnormally large for siLCMT1 mitotic spindles (569.7 μm3 ± 38.7, p = 0.0366) and abnormally small for siPME-1 mitotic spindles (125.7 μm3 ± 14.9, p = 0.0024), compared to siControl mitotic spindles (466.3 μm3 ± 38.8) (). These data indicated that LCMT1 and PME-1 were indeed regulating mitotic spindle size. Consistently, there was also an increase in the total amount of microtubule polymer (total fluorescence intensity of spindle microtubules in arbitrary units, A.U.) for siLCMT1 (606 A.U. ± 34, p = 0.025) and a decrease in microtubule polymer for siPME-1 (253 A.U. ± 50, p = 0.049) compared to siControl (434 A.U. ± 37) (). Together, these results indicated that a balance between LCMT1 methylation and PME-1 demethylation was responsible for regulating spindle size, potentially through the modulation of PP2AC methylation (). In support of this idea, siLCMT1 led to an increase in the ratio of demethylated PP2AC (siControl=1 ± .3, siLCMT1=1.6 ± .07) whereas siPME-1 led to a decrease in the ratio of demethylated PP2AC (siControl=1 ± .12, siPME-1= 0.6 ± .13), consistent with previous reports (; Fig. S3A and B).Citation4,9
Pharmacological inhibition of PME-1 leads to short mitotic spindles
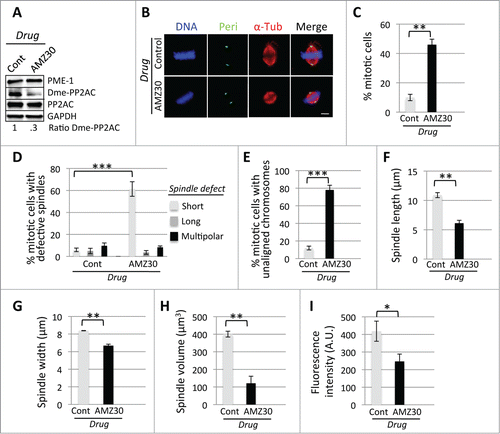
Due to the recent availability of a PME-1 specific inhibitor (AMZ30),Citation10,11 we sought to further test this hypothesis through pharmacological inhibition of PME-1. HeLa cells were synchronized in G1/S and released into the cell cycle in the presence of control DMSO or AMZ30 for 9 hours, and then processed for quantitative immunofluorescence analyses of spindle morphology, size, width, and volume as described above. Consistent with our previous results with siRNA-mediated depletion of PME-1, treatment of cells with AMZ30 led to a decrease in the ratio of demethylated PP2AC (Control=1 ± .06, AMZ30=0.3 ± .01) (; Fig. S3C), an increase in the percentage of cells arrested in mitosis (46 ± 3.7, p = 0.001) compared to DMSO (10 ± 2.2) (), an increase in the percentage of mitotic cells with spindle defects (predominantly abnormally small metaphase spindles (61.3 ± 6.6, p = 0 .0003) compared to DMSO (6.0 ± 1.6)) (), an increase in the percentage of cells with unaligned chromosomes (78 ± 5.4, p = 0.0001) compared to DMSO (12 ± 2.2) (; Fig. S2), a reduced PTP distance (6.1 μm ± .49, p = 0.014) compared to DMSO (10.9 μm ± .42) (), a reduced spindle width (6.7 μm ± .17, p = 0.0009) compared to DMSO (8.4 μm ± .02) (), a reduced spindle volume (121 μm3 ± 40, p = 0.0006) compared to DMSO (400.1 μm3 ± 16.5) (), and a decrease in the amount of microtubule polymer (total fluorescence intensity of spindle microtubules in arbitrary units, A.U.) (247 A.U. ± 42, p = 0.027) compared to DMSO (418 A.U. ± 57) (). Therefore, the results of inhibiting PME-1 pharmacologically were consistent with the results of depleting PME-1 and further supported the hypothesis that misregulation of the LCMT1-PME-1 methylation equilibrium led to an abnormal spindle size.
Figure 2. Pharmacological-mediated perturbation of the LCMT1-PME-1 methylation equilibrium leads to misregulation of spindle size and cell division. (A) Pharmacological inhibition of PME-1 with AMZ30 compared to DMSO vehicle control. Note that the levels of demethylated PP2AC decreased in cells treated with AMZ30. (B) Immunofluorescence microcopy showing that AMZ30-treated cells have abnormally short spindles. Bar = 5 μm. (C) Quantification of the percentage of cells in mitosis showing that inhibition of PME-1 with AMZ30 leads to a major increase in cells arrested in mitosis. (D) Quantification showing that treatment of cells with AMZ30 leads to a major increase in the percentage of mitotic cells with abnormal spindles (short, long, multipolar). (E) Quantification showing that treatment of cells with AMZ30 leads to a major increase in the percentage of unaligned chromosomes. (F) Quantification of metaphase spindle PTP distance (in μm) showing that AMZ30-treated cells have abnormally short spindles. (G) Quantification of metaphase spindle width (in μm) showing that AMZ30-treated cells have abnormally short spindle widths. (H) Quantification of metaphase spindle volume (in μmCitation3) showing that treatment with AMZ30 leads to a decrease in volume. (I) Quantification of the total fluorescence intensity of mitotic spindle microtubules for AMZ30-treated cells, in arbitrary units (A.U.), showing that AMZ30 treatment leads to a decrease in total microtubule polymer. (C–I) Data represents average ± SDs of 3 independent experiments. ** = P < 0.005, *** = P < 0.0005.
Perturbation of the LCMT1-PME-1 methylation equilibrium by overexpressing LCMT1 or PME-1 leads to an abnormal mitotic spindle size
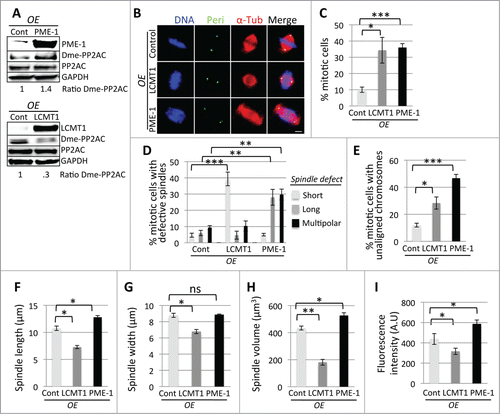
To further test this hypothesis, we generated doxycycline (Dox) inducible localization and affinity purification (LAP) tagged LCMT1 and PME-1 HeLa stable cell lines that expressed either LAP-LCMT1 or LAP-PME-1 from a single locus within the genome.Citation12 These cell lines were used to analyze the effects of overexpressing LAP-LCMT1 or LAP-PME-1 on spindle size and morphology. Briefly, cells were treated with Dox for 24 hours to induce LAP-LCMT1 or LAP-PME-1 overexpression. Cells were then harvested and protein extracts were analyzed by immunoblot analysis (). In parallel experiments, cells overexpressing LAP-LCMT1 or LAP-PME-1 were fixed, stained, and their mitotic defects, spindle size, and spindle volume were analyzed by immunofluorescence microscopy as described above. These analyses showed that overexpression of LAP-PME-1 led to longer spindles with spindle multipolarity and unaligned chromosomes (; Fig. S2). Conversely, overexpression of LAP-LCMT1 led to shorter spindles with chromosomes partially aligned at the metaphase plate (; Fig. S2). Quantitative analysis of these data showed that overexpression of LAP-LCMT1 or LAP-PME-1 led to a major increase in the percentage of cells arrested in mitosis (LAP-LCMT1= 34.3 ± 7.9 (pp = 0 .01) and LAP-PME-1= 36.0 ± 2.4 (p = 0.0002) compared to Control = 10.0 ± 1.6) (), an increase in the percentage of cells with abnormal mitotic spindles (short, long, multipolar) (predominantly short spindles for LAP-LCMT1= 39.3 ± 4.2 (p = 0.0028) compared to Control = 4.7 ± 1.2 and long spindles = 28.0 ± 4.9 (p = 0.0026) and multipolar spindles = 29.7 ± 3.4 (p = 0.0086) for LAP-PME-1 compared to Control = 6.0 ± 1.6 and 9.3 ± 1.2 respectively) (), and an increase in the percentage of cells with partially unaligned chromosomes (LAP-LCMT1= 28.3 ± 4.5 (p = 0.0052) and LAP-PME-1= 46.7 ± 2.9 (p = 0.0002) compared to Control = 12 ± 1.4) (). Consistent with our previous results, control cells had a PTP distance of 10.8 μm ± .41, whereas in cells overexpressing LAP-PME-1 metaphase spindles were longer (PTP distance = 12.8 μm ± .31, p = 0.02) and those overexpressing LAP-LCMT1 displayed shorter spindles (PTP distance = 7.3 μm ± .3, p = 0.0065) (). However, LAP-PME-1 cells had a similar spindle width (8.9 μm ± .1) to siControl cells (8.8 μm ± .25), whereas the spindle width of LAP-LCMT1 cells was shorter (6.8 μm ± .26, p = 0.0057) (). Interestingly, the spindle volume was abnormally large for cells overexpressing LAP-PME-1 (527 μm ± 20.5, p = 0.0066) and abnormally small for cells overexpressing LAP-LCMT1 (181 μm ± 21.5, p = 0.0012), compared to control spindles (434.3 μm ± 14.4) (). There was also a reduction in the amount of microtubule polymer (total fluorescence intensity of spindle microtubules in arbitrary units, A.U.) for cells overexpressing LAP-LCMT1 (317 A.U. ± 31, p = 0.05) and an increase in microtubule polymer for cells overexpressing LAP-PME-1 (587 A.U. ± 39, p = 0.03) compared to control (438 A.U. ± 53) (). In addition, overexpression of LAP-LCMT1 led to a decrease in the ratio of demethylated PP2AC (Control=1 ± .06, LAP-LCMT1=0.3 ± .02), whereas LAP-PME-1 overexpression led to an increase in the ratio of demethylated PP2AC (Control=1 ± .01, LAP-PME-1=1.4 ± .06) (; Fig. S3D and E). These results were consistent with the proposed model where a LCMT1-PME-1 methylation equilibrium was responsible for regulating spindle size through the modulation of PP2AC methylation ().
Figure 3. Overexpression-mediated perturbation of the LCMT1-PME-1 methylation equilibrium leads to misregulation of spindle size and cell division. (A) Overexpression of LAP-LCMT1 or LAP-PME-1 compared to non-induced control cells. Note that the levels of demethylated PP2AC decreased in cells overexpressing LAP-LCMT1 and increased in cells overexpressing LAP-PME-1. (B) Immunofluorescence microcopy showing that LAP-PME-1 overexpression leads to abnormally long spindles and LAP-LCMT1 overexpression leads to abnormally short spindles. Bar = 5 μm. (C) Quantification of the percentage of cells in mitosis showing that overexpression of LAP-PME-1 or LAP-LCMT1 leads to a major increase in cells arrested in mitosis. (D) Quantification showing that overexpression of LAP-LCMT1 or LAP-PME-1 leads to a major increase in the percentage of abnormal spindles (short, long, multipolar). (E) Quantification showing that overexpression of LAP-LCMT1 or LAP-PME-1 leads to a major increase in the percentage of unaligned chromosomes. (F) Quantification of metaphase spindle PTP distance (in μm) showing that LAP-PME-1 overexpression leads to abnormally long spindles and LAP-LCMT1 overexpression leads to abnormally short spindles. (G) Quantification of metaphase spindle width (in μm) showing that overexpression of LAP-LCMT1 leads to a decrease in spindle width, while overexpression of LAP-PME-1 had no significant effect on spindle width. (H) Quantification of metaphase spindle volume (in μm3) showing that overexpression of LAP-PME-1 leads to an increase in volume and LAP-LCMT1 overexpression leads to a decrease in volume. (I) Quantification of the total fluorescence intensity of mitotic spindle microtubules for LAP-PME-1 or LAP-LCMT1 overexpressing cells, in arbitrary units (A.U.), showing that overexpression of LAP-LCMT1 leads to a decrease in total microtubule polymer, whereas overexpression of LAP-PME-1 leads to an increase in total microtubule polymer. (C–I) Data represents average ± SDs of 3 independent experiments. * = P < 0.05, ** = P < 0.005, *** = P < 0.0005, ns = not statistically significant.
Perturbation of the LCMT1-PME-1 methylation equilibrium leads spindle assembly checkpoint activation, an induction of apoptosis and reduced cell viability
Since perturbation of the LCMT1-PME-1-methyaltion equilibrium led to an increase in unaligned chromosomes at the metaphase plate, we sought to understand whether these defects were due to defects in kinetochore-microtubule attachment. First, we measured the total amount of cold-stable microtubule polymer (total fluorescence intensity of cold-stable microtubules, which form proper kinetochore-microtubule attachments in arbitrary units (A.U.)) in LCMT1 or PME-1 depleted cells, PME-1 inhibited cells and LAP-LCMT1 or LAP-PME-1 overexpressing cells. While there was a statistically significant decrease in the fluorescence intensity of cold-stable microtubules in PME-1 depleted cells, PME-1 inhibited cells and LCMT1 overexpressing cells, there was only a small decrease in LCMT1-depleted and PME-1 overexpressing cells that was not statistically significant (Fig. S4A–C). However, the lack of a significant difference in LCMT1-depleted and PME-1 overexpressing cells could have been due to the fact that these cells had elongated spindles and thus more tubulin polymer to start with. Thus, we turned to an alternative assay to analyze kinetochore-microtubule attachment. Here, we asked if perturbation of the LCMT1-PME-1-methyaltion equilibrium could activate the spindle assembly checkpoint (SAC), which responds to unattached kinetochores or non-productive microtubule-kinetochore attachments, by monitoring the localization of the SAC kinase Bub1 (localizes to the kinetochore when the SAC is active). Indeed, depletion of LCMT1 or PME-1, inhibition of PME-1 and overexpression of LAP-LCMT1 or LAP-PME-1 led to SAC activation even in cells that appeared to have all their chromosomes aligned at the metaphase plate (). Together these data indicated that perturbation of the LCMT1-PME-1-methyaltion equilibrium leads to defects in microtubule-kinetochore attachment and activation of the SAC.
Figure 4. Analyzing the consequences of perturbing the LCMT1-PME-1 methylation equilibrium. (A–C) Fixed-cell immunofluorescence microcopy showing that the spindle assembly checkpoint is activated (Bub1 remains localized to kinetochores) in LCMT1 or PME-1 depleted cells (A), PME-1 inhibited cells (B) and LCMT1 or PME-1 overexpressing cells (C). Bar = 5 μm. (D–F) Quantification of normalized percent cell viability for LCMT1 or PME-1-depleted (D), AMZ30-treated (E), or LCMT1 or PME-1-overexpressing cells (F). Data represents average ± SDs of 3 independent experiments. * = P < 0.05, ** = P < 0.005.
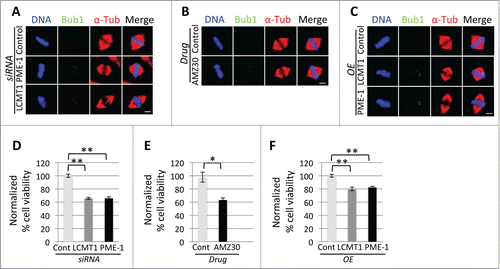
Next, we asked if the misregulation of spindle size had an effect on cell viability by measuring the effect of these treatments on cell viability using the CellTiter-Glo luminescent cell viability assay, which measured total ATP levels indicative of metabolically active cells. This analysis revealed that cell viability decreased in cells with a perturbed methylation equilibrium (normalized percent cell viability for siLCMT1= 66 ± 1.45, P < .005; siPME-1= 66 ± 2.24, P < .005; PME-1 inhibition = 62 ± 3.2, P < .05); LCMT1 overexpression = 80 ± 2.7, P < .005; PME-1 overexpression = 82 ± 1.8, P < .005) (). Additionally, we analyzed whether this decrease in cell viability was due to the activation of the apoptotic cell death pathway by immunoblotting cell lysates for cleaved Caspase 3. Indeed, perturbation of the methylation equilibrium (through inhibition/depletion or overexpression of LCMT1 or PME-1) led to an increase in Caspase 3 cleavage, indicative of apoptosis (Fig. S5A–C). Together these data indicated that perturbation of the LCMT1-PME-1-methylation equilibrium led to a caspase-mediated cell death.
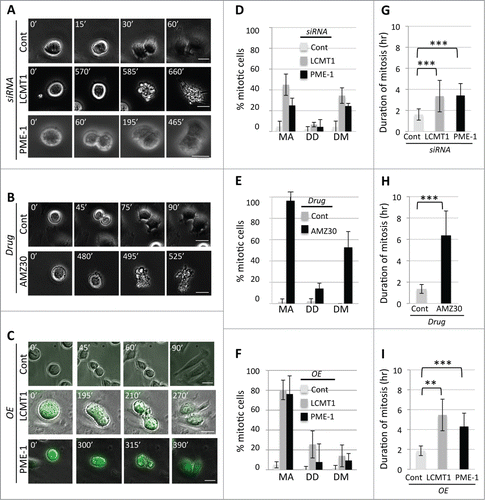
Finally we analyzed the consequences of perturbing the LCMT1-PME-1 methylation equilibrium by live-cell time-lapse microcopy. siControl, siLCMT1, siPME-1, control DMSO, AMZ30, uninduced, LAP-LCMT1 or LAP-PME-1 overexpressing HeLa cells were synchronized in G1/S (thymidine treatment) and released into the cell cycle. Six hours post-release, cells were imaged at 20X magnification every 15-minutes and images were processed into movie format ( and Supplemental Movies S1-S8). The movies were then analyzed to determine the percentage of cells that arrested in mitosis (MA), that displayed defective divisions (DD) or that died during mitosis (DM) (). Consistent with previous data, perturbation of the methylation equilibrium led to an increase in the percentage of cells that arrested during mitosis, that had defective divisions and that died during mitosis (). Additionally, we quantified the time spent in mitosis (time length from cell rounding to cell abscission) for each treatment (). Whereas control cells transitioned through mitosis within 2 hours, perturbation of the LCMT1-PME-1 methylation equilibrium led to an increase in the time (hours) cells spent in mitosis (siLCMT1 =1.61 ± .53 (p = 0.0001) and siPME-1 =3.36 ± 1.5 (p = 0.0001) compared to siControl = 8.7 ± 1.7 (); AMZ30= 6.37 ± 2.3 (p = 0.0001) compared to DMSO = 1.36 ± .42 (); LAP-LCMT1= 5.46. ± 1.59 (p = 0.002) and LAP-PME-1= 4.30 ± 1.3 (p = 0.001) compared to control = 1.86 ± .48) ()). These data were consistent with fixed-cell immunofluorescence microscopy data and further indicated that changes in spindle length can lead to increased mitotic arrest and increased cell death.
Figure 5. Analyzing the consequences of perturbing the LCMT1-PME-1 equilibrium by live-cell time-lapse microscopy. (A) Live-cell imaging of siControl, siLCMT1 or siPME-1 treated cells. (B) Live-cell imaging of control DMSO or AMZ30 treated cells. (C) Live-cell imaging of control, LAP-LCMT1 overexpressing or LAP-PME-1 overexpressing cells. (A–C) Bar = 20 μm. Time is in minutes. See also Supplemental Movies S1-S8. (D–F) Quantification of the live-cell imaging data from A-C for the percentage of cells undergoing mitotic arrest (MA), defective cell divisions (DD) and cell death in mitosis (DM). Data represents average ± SDs of 3 independent experiments. (G–I) Quantification of live-cell imaging data from A-C for the length of time cells spent in mitosis, cell rounding through cell abscission. Data represents average ± SDs of 3 independent experiments. ** = P < 0.005, *** = P < 0.0005.
Discussion
Our data indicate that LCMT1 and PME-1 are novel factors important for regulating spindle size and cell division. We propose that a balance between LCMT1 methylation and PME-1 demethylation is critical for controlling spindle size through the methylation of PP2AC and that misregulating this equilibrium leads to defective spindle assembly and decreased cell viability due to activation of the apoptotic pathway (). This study increases our understanding of the enzymatic machinery (LCMT1 and PME-1) that regulates mitotic spindle size and implicates methylation as an important regulatory posttranslational modification for establishing proper spindle size.
PP2A holoenzyme complexes have varied roles during mitotic entry, mitotic spindle assembly and mitotic exit.Citation13-16 Although much of the characterization of PP2A complexes has been carried out in model organisms like yeast and flies, humans have a larger number (∼15) of regulatory B-subunits (B, B′’, B″, B‴), which further complicates the analysis of the function of PP2A and studies analyzing the effect of depleting specific B-subunits, and not the catalytic PP2AC subunit, in mitosis have provided the most insight into the function of this enzyme.Citation2 Previously, we systematically depleted each B-subunit from human cells and analyzed their defects in early mitosis, among the B-subunits with defects in mitosis was the B type subunit PPP2R2B (R2B).Citation13 B type subunits (PPP2R2A, PPP2R2B, PPP2R2C, PPP2R2D) require PP2AC methylation by LCMT1 to bind to PP2AC and form active holoenzymes, whereas other B-subunits do not necessitate this posttranslational modification to form active holoenzymes.Citation2,4 Interestingly, the PP2AC/R1A/R2B holoenzyme was required for de-phosphorylating the Anaphase Promoting Complex/Cyclosome (APC/C) subunit Cdc27 to allow its association with mitotic spindle microtubules to regulate proper mitotic spindle formation.Citation13 Additionally, cells depleted of R2B also displayed elongated spindles and spindle multipolarity. Therefore it was possible that the LCMT1-PME-1 methylation equilibrium was indirectly controlling the phosphorylation state of the APC/C, and thereby mitotic spindle assembly, through PP2AC/R1A/R2B.Citation13 Consistent with this idea, wildtype cells arrested in mitosis with nocodazole maintained Cdc27 in its expected hyper-phosphorylated form, whereas in AMZ30 treated cells Cdc27 was dephosphorylated (hypo-phosphorylated) (Fig. S6). Although preliminary, these results indicate that the LCMT1-PME-1 methylation equilibrium could potentially act through regulating the assembly of the PP2AC/R1A/R2B complex and thereby the phosphorylation/dephosphorylation of the APC/C to control spindle size and should be explored further.
However, there are several other interpretations as to how PP2A may be regulating spindle size. For example, the B type subunit PPP2R2A (which is dependent on LCMT1 PP2AC methylation in order to assemble into the PP2AC/R1A/R2A holoenzyme) has been implicated in regulating the phosphorylation state of the microtubule-associated protein Tau, which may affect the stability of microtubules and thereby length.Citation17,18 Although B’ subunits have been implicated in the regulation of centromere cohesion and the formation of stable kinetochore-microtubule attachments that could lead to differences in spindle size, this is unlikely as B′ subunits are not dependent on PP2AC methylation for holoenzyme assembly.Citation4,19,20 Finally, molecular motors (like Kinesin-5), microtubule polymerization proteins (like XMAP215), microtubule depolymerization proteins (like Kinesin-8), and microtubule severing enzymes (like Katanin) have been shown to influence mitotic spindle size and the signaling pathways, posttranslational modifications and protein-protein interactions that regulate these factors remain poorly characterized.Citation21-25 Thus, although PP2AC is the only known direct substrate that is modified by the LCMT1-PME-1 methylation equilibrium, it is still possible that Kinesin-5, Kinesin-8, XMAP215, Katanin or other proteins that influence microtubule spindle length could be potential targets of LCMT1/PME-1.
Materials and Methods
Cell culture
HeLa cell culture and synchronizations were as described previously.Citation26 For pharmacological inhibition of PME-1, cells were treated with 20 μM AMZ30 for the indicated times.
RNAi
For RNA interference experiments, the following Dharmacon ONTARGETplus siRNAs: siControl (cat# D-001810-10), siLCMT1 (pool and individual oligos, cat# L-009425-00, -06, -07, -08, -09) or siPME-1 (pool and individual oligos, cat# L-005211-00, -05, -06, -07, -08) were used at 50nM to transfect HeLa cells using Lipofectamine RNAiMAX as described by the manufacturer (Invitrogen).
Cloning and generation of LAP-tagged stable cell lines
For full-length LCMT1 and PME-1 expression, full-length LCMT1 or PME-1 cDNA was fused to the c-terminus of EGFP (pGLAP1 vector) and vectors were used to generate doxycycline inducible HeLa Flp-In-T-REx LAP-LCMT1 or PME-1 stable cell lines that express these proteins from a single locus within the genome as described previously.Citation12
Antibodies
Immunofluorescence and immunoblotting were carried out using antibodies that recognize: GFP (Invitrogen cat#A-11120), Gapdh (Covance cat#MMS-580S), α-tubulin (Serotec cat#MCAP77), LCMT1 and PME-1 (Santa Cruz Biotechnology cat#SC-134675 and cat#SC-25278), PP2AC (Cell Signaling Technology cat#2038S), de-methylated PP2AC (EMD Millipore cat#05-577), Caspase 3 (Cell Signaling Technology cat#9665), Pericentrin (Novus Biologicals cat#NB100-61071), Bub1 (kind gift from Hongtao Yu). Secondary antibodies conjugated to FITC, Cy3, and Cy5 were from Jackson Immuno Research (Affinipure).
Fixed-cell and live-cell microscopy
Fixed-cell immunofluorescence microscopy was carried out as described previously.Citation13
Except that images were captured with a Leica DMI6000 microscope (Leica DFC360 FX Camera, 63x/1.40-0.60 NA oil objective, Leica AF6000 software). Images were deconvolved with Leica Application Suite 3D Deconvolution software and exported as TIFF files. Live-cell time-lapse microscopy was carried out as described previously.Citation27 Except that Z-stacks were captured every 1 μm for 10 μm at 20X magnification, and stacks were deconvolved with Leica Application Suite 3D Deconvolution software and compressed as maximum intensity projection images. Images were then converted to movies using QuickTime software (Apple). Each frame represents a 15-minute interval.
Cell viability and Caspase 3 cleavage assays
The cell viability of cells treated with indicated siRNAs for 72 hours, drugs for 24 hours or induced to overexpress LCMT1 or PME-1 for 48 hours was determined using the CellTiter-Glo Assay (Promega) as described previously.Citation28 To monitor Caspase 3 cleavage, cells were subjected to the above-mentioned treatments and protein extracts from these cells were analyzed by immunoblot analysis with anti-Caspase 3 antibodies.
Quantification of data and statistical analysis
For percent abnormal spindles, spindle defects (long, short, multipolar) were quantified for each treatment (using 100 spindles for each treatment and 3 independent experiments). For spindle size pole-to-pole measurements, a vector was drawn connecting the 2 pericentrin stained poles and the vector distance (μm) was quantified for each treatment (using 20 spindles for each treatment in each of 3 independent experiments). Spindle volume (V = αLAo) measurements in μm3 were quantified as described previously,Citation22 with 20 spindles for each treatment in each of 3 independent experiments. Spindle PTP distance and volume were measured using Leica AF6000 software. The total fluorescence intensity of spindle microtubules and cold-treated spindle microtubules was measured 10 spindles for each treatment in each of 3 independent experiments using Leica AF6000 software. For all measurements, data represent the average ± SD of 3 independent experiments. Statistical differences were calculated using a student's t-test. P < 0.05 was considered statistically significant.
Disclosure of Potential Conflicts of Interests
No potential conflicts of interest were disclosed.
1026487_Supplemental_Material.pdf
Download PDF (1.1 MB)Funding
This material is based upon work supported by the National Science Foundation under Grant Number MCB1243645 to JZT; any opinions, findings, and conclusions or recommendations expressed in this material are those of the authors and do not necessarily reflect the views of the National Science Foundation.
Supplemental Material
Supplemental data for this article can be accessed on the publisher's website
Related Research Data
References
- De Baere I, Derua R, Janssens V, Van Hoof C, Waelkens E, Merlevede W, Goris J. Purification of porcine brain protein phosphatase 2A leucine carboxyl methyltransferase and cloning of the human homologue. Biochemistry 1999; 38:16539–47; PMID:10600115; http://dx.doi.org/10.1021/bi991646a
- Virshup DM, Shenolikar S. From promiscuity to precision: protein phosphatases get a makeover. Mol Cell 2009; 33:537–45; PMID:19285938; http://dx.doi.org/10.1016/j.molcel.2009.02.015
- Sents W, Ivanova E, Lambrecht C, Haesen D, Janssens V. The biogenesis of active protein phosphatase 2A holoenzymes: a tightly regulated process creating phosphatase specificity. FEBS J 2013; 280:644–61; PMID:22443683; http://dx.doi.org/10.1111/j.1742-4658.2012.08579.x
- Longin S, Zwaenepoel K, Louis JV, Dilworth S, Goris J, Janssens V. Selection of protein phosphatase 2A regulatory subunits is mediated by the C terminus of the catalytic Subunit. J Biol Chem 2007; 282:26971–80; PMID:17635907; http://dx.doi.org/10.1074/jbc.M704059200
- Ogris E, Du X, Nelson KC, Mak EK, Yu XX, Lane WS, Pallas DC. A protein phosphatase methylesterase (PME-1) is one of several novel proteins stably associating with two inactive mutants of protein phosphatase 2A. J Biol Chem 1999; 274:14382–91; PMID:10318862; http://dx.doi.org/10.1074/jbc.274.20.14382
- Xing Y, Li Z, Chen Y, Stock JB, Jeffrey PD, Shi Y. Structural mechanism of demethylation and inactivation of protein phosphatase 2A. Cell 2008; 133:154–63; PMID:18394995; http://dx.doi.org/10.1016/j.cell.2008.02.041
- Lee JA, Pallas DC. Leucine carboxyl methyltransferase-1 is necessary for normal progression through mitosis in mammalian cells. J Biol Chem 2007; 282:30974–84; PMID:17724024; http://dx.doi.org/10.1074/jbc.M704861200
- Ortega-Gutierrez S, Leung D, Ficarro S, Peters EC, Cravatt BF. Targeted disruption of the PME-1 gene causes loss of demethylated PP2A and perinatal lethality in mice. PLoS One 2008; 3:e2486; PMID:18596935; http://dx.doi.org/10.1371/journal.pone.0002486
- Puustinen P, Junttila MR, Vanhatupa S, Sablina AA, Hector ME, Teittinen K, Raheem O, Ketola K, Lin S, Kast J, et al. PME-1 protects extracellular signal-regulated kinase pathway activity from protein phosphatase 2A-mediated inactivation in human malignant glioma. Cancer Res 2009; 69:2870–7; PMID:19293187; http://dx.doi.org/10.1158/0008-5472.CAN-08-2760
- Bachovchin DA, Mohr JT, Speers AE, Wang C, Berlin JM, Spicer TP, Fernandez-Vega V, Chase P, Hodder PS, Schurer SC, et al. Academic cross-fertilization by public screening yields a remarkable class of protein phosphatase methylesterase-1 inhibitors. Proc Natl Acad Sci U S A 2011; 108:6811–6; PMID:21398589; http://dx.doi.org/10.1073/pnas.1015248108
- Bachovchin DA, Zuhl AM, Speers AE, Wolfe MR, Weerapana E, Brown SJ, Rosen H, Cravatt BF. Discovery and optimization of sulfonyl acrylonitriles as selective, covalent inhibitors of protein phosphatase methylesterase-1. J Med Chem 2011; 54:5229–36; PMID:21639134; http://dx.doi.org/10.1021/jm200502u
- Torres JZ, Miller JJ, Jackson PK. High-throughput generation of tagged stable cell lines for proteomic analysis. Proteomics 2009; 9:2888–91; PMID:19405035; http://dx.doi.org/10.1002/pmic.200800873
- Torres JZ, Ban KH, Jackson PK. A specific form of phospho protein phosphatase 2 regulates anaphase-promoting complex/cyclosome association with spindle poles. Mol Biol Cell 2010; 21:897–904; PMID:20089842; http://dx.doi.org/10.1091/mbc.E09-07-0598
- Wurzenberger C, Gerlich DW. Phosphatases: providing safe passage through mitotic exit. Nat Rev Mol Cell Biol 2011; 12:469–82; PMID:21750572; http://dx.doi.org/10.1038/nrm3149
- Barr FA, Elliott PR, Gruneberg U. Protein phosphatases and the regulation of mitosis. J Cell Sci 2011; 124:2323–34; PMID:21709074; http://dx.doi.org/10.1242/jcs.087106
- Funabiki H, Wynne DJ. Making an effective switch at the kinetochore by phosphorylation and dephosphorylation. Chromosoma 2013; 122:135–58; PMID:23512483; http://dx.doi.org/10.1007/s00412-013-0401-5
- Sontag E, Luangpirom A, Hladik C, Mudrak I, Ogris E, Speciale S, White CL, 3rd. Altered expression levels of the protein phosphatase 2A ABalphaC enzyme are associated with Alzheimer disease pathology. J Neuropathol Exp Neurol 2004; 63:287–301; PMID:15099019
- Sontag E, Nunbhakdi-Craig V, Lee G, Brandt R, Kamibayashi C, Kuret J, White CL, 3rd, Mumby MC, Bloom GS. Molecular interactions among protein phosphatase 2A, tau, and microtubules. Implications for the regulation of tau phosphorylation and the development of tauopathies. J Biol Chem 1999; 274:25490–8; PMID:10464280; http://dx.doi.org/10.1074/jbc.274.36.25490
- Foley EA, Kapoor TM. Microtubule attachment and spindle assembly checkpoint signalling at the kinetochore. Nat Rev Mol Cell Biol 2013; 14:25–37; PMID:23258294; http://dx.doi.org/10.1038/nrm3494
- Chen F, Archambault V, Kar A, Lio P, D'Avino PP, Sinka R, Lilley K, Laue ED, Deak P, Capalbo L, et al. Multiple protein phosphatases are required for mitosis in Drosophila. Curr Biol 2007; 17:293–303; PMID:17306545; http://dx.doi.org/10.1016/j.cub.2007.01.068
- Sawin KE, LeGuellec K, Philippe M, Mitchison TJ. Mitotic spindle organization by a plus-end-directed microtubule motor. Nature 1992; 359:540–3; PMID:1406972; http://dx.doi.org/10.1038/359540a0
- Reber SB, Baumgart J, Widlund PO, Pozniakovsky A, Howard J, Hyman AA, Julicher F. XMAP215 activity sets spindle length by controlling the total mass of spindle microtubules. Nat Cell Biol 2013; 15:1116–22; PMID:23974040; http://dx.doi.org/10.1038/ncb2834
- Su X, Arellano-Santoyo H, Portran D, Gaillard J, Vantard M, Thery M, Pellman D. Microtubule-sliding activity of a kinesin-8 promotes spindle assembly and spindle-length control. Nat Cell Biol 2013; 15:948–57; PMID:23851487; http://dx.doi.org/10.1038/ncb2801
- Loughlin R, Wilbur JD, McNally FJ, Nedelec FJ, Heald R. Katanin contributes to interspecies spindle length scaling in Xenopus. Cell 2011; 147:1397–407; PMID:22153081; http://dx.doi.org/10.1016/j.cell.2011.11.014
- Goshima G, Scholey JM. Control of mitotic spindle length. Annu Rev Cell Dev Biol 2010; 26:21–57; PMID:20604709; http://dx.doi.org/10.1146/annurev-cellbio-100109-104006
- Torres JZ, Summers MK, Peterson D, Brauer MJ, Lee J, Senese S, Gholkar AA, Lo YC, Lei X, Jung K, et al. The STARD9/Kif16a Kinesin Associates with Mitotic Microtubules and Regulates Spindle Pole Assembly. Cell 2011; 147:1309–23; PMID:22153075; http://dx.doi.org/10.1016/j.cell.2011.11.020
- Senese S, Cheung K, Lo YC, Gholkar AA, Xia X, Wohlschlegel JA, Torres JZ. A unique insertion in STARD9's motor domain regulates its stability. Mol Biol Cell 2015; 26:440–52; PMID:25501367; http://dx.doi.org/10.1091/mbc.E14-03-0829
- Senese S, Lo YC, Huang D, Zangle TA, Gholkar AA, Robert L, Homet B, Ribas A, Summers MK, Teitell MA, et al. Chemical dissection of the cell cycle: probes for cell biology and anti-cancer drug development. Cell Death Dis 2014; 5:e1462; PMID:25321469; http://dx.doi.org/10.1038/cddis.2014.420