
Abstract
We recently demonstrated that conditioned media (CM) from osteocytes enhances myogenic differentiation of myoblasts, suggesting that signaling from bone may be important for skeletal muscle myogenesis. The effect of CM was closely mimicked by prostaglandin E2 (PGE2), a bioactive lipid mediator in various physiological or pathological conditions. PGE2 is secreted at high levels by osteocytes and such secretion is further enhanced under loading conditions. Although four types of receptors, EP1 to EP4, mediate PGE2 signaling, it is unknown whether these receptors play a role in myogenesis. Therefore, in this study, the expression of EPs in mouse primary myoblasts was characterized, followed by examination of their roles in myoblast proliferation by treating myoblasts with PGE2 or specific agonists. All four PGE2 receptor mRNAs were detectable by quantitative real-time PCR (qPCR), but only PGE2 and EP4 agonist CAY 10598 significantly enhance myoblast proliferation. EP1/EP3 agonist 17-phenyl trinor PGE2 (17-PT PGE2) and EP2 agonist butaprost did not have any significant effects. Moreover, treatment with EP4 antagonist L161,982 dose-dependently inhibited myoblast proliferation. These results were confirmed by cell cycle analysis and the gene expression of cell cycle regulators. Concomitant with the inhibition of myoblast proliferation, treatment with L161,982 significantly increased intracellular reactive oxygen species (ROS) levels. Cotreatment with antioxidant N-acetyl cysteine (NAC) or sodium ascorbate (SA) successfully reversed the inhibition of myoblast proliferation and ROS overproduction caused by L161,982. Therefore, PGE2 signaling via the EP4 receptor regulates myogenesis by promoting myoblast proliferation and blocking this receptor results in increased ROS production in myoblasts.
Abbreviations
| CDK | = | cyclin dependent kinase |
| NAC | = | N-acetyl cysteine |
| CM | = | conditioned media |
| Keap1/Nrf2 | = | Kelch-like ECH-associated protein 1/NF-E2-related factor 2 |
| PGD2 | = | prostaglandin D2 |
| PGE2 | = | prostaglandin E2 |
| PGF2α | = | prostaglandin F2α; PGI2, prostaglandin I2 |
| PGC-1α | = | proliferator-activated receptor gamma coactivator 1-α |
| qPCR | = | quantitative real-time PCR |
| RB | = | retinoblastoma protein |
| ROS | = | reactive oxygen species |
| SA | = | sodium ascorbate |
| SOD1 | = | superoxide dismutase 1 |
Introduction
In recent studies exploring the new concepts of bone-muscle biochemical crosstalk, we found that CM derived from either MLO-Y4 osteocyte-like cells or mouse primary osteocytes have the ability to accelerate myogenic differentiation of C2C12 and primary myoblasts. Interestingly, the effects induced by CM were closely mimicked by treatment of myoblasts with nanomolar levels of PGE2. Since PGE2 is secreted at high levels by osteocytes and such secretion is further enhanced by mechanical loadings, such as fluid flow sheer stress, it has been considered as one of the candidates responsible for bone to muscle signaling. However, the mechanisms underlying the effect of PGE2 on skeletal muscle myogenesis are not clear.
Skeletal muscle myogenesis is a highly orchestrated biological process, which includes muscle precursor cell proliferation. In response to increased physiological muscle loading or injury, quiescent satellite cells, resident in the muscle basal laminae, are activated and re-enter the cell cycle to generate satellite cell-derived myoblasts. Myoblasts then proliferate extensively before commitment to differentiation, followed by fusion to repair damaged myofibers or form new myofibers.Citation1 During proliferation, a group of regulators are critical for cell cycle progression. In early G1 phase, cyclin D binds to and activates cyclin dependent kinase 4 or 6 (CDK4/ 6), which subsequently phosphorylates and inactivates proliferation inhibitory substrates, such as retinoblastoma protein (RB), a potent inhibitor of G1-S phase transition. Inactivation of RB induces transcriptional activation of cyclin E, cyclin A, Cdc6, and other factors to promote cell cycle progression. In contrast, p21Cip1, p27Kip1, and p57Kip2 can negatively regulate cell cycle by interacting with cyclin/Cdk complex.Citation2,3
Previous studies have shown that a variety of factors participate in the regulation of myoblast proliferation and cell cycle progression. For instance, interleukin-6 induces myoblast proliferation by activating Janus kinase/signal transducers and activators of the transcription 3 pathway.Citation4 Myostatin, a potent negative regulator of muscle mass, inhibits myoblast proliferation by inducing the degradation of cyclin D and p300.Citation5,6 Inhibition of cyclin E/Cdk2 may also contribute to the inhibitory effect of myostatin.Citation7 Unlike many other factors, ROS have 2 distinct functions in cell proliferation. Transient production or low level of ROS can stimulate cell proliferation, while oxidative stress caused by overproduction of ROS leads to cell cycle arrest. Citation8-Citation11
Prostaglandins, including prostaglandin D2 (PGD2), PGE2, prostaglandin F2α (PGF2α), and prostaglandin I2 (PGI2), have been shown to play important roles in the regulation of myogenesis. PGF2α prevents myoblast apoptosis and enhances fusion.Citation12,13 PGI2 promotes fusion through inhibiting myoblast migration,Citation14 whereas PGD2 promotes myoblast proliferation, but reduces myoblast fusion.Citation15 PGE2, the most abundant PG in mammalian tissues, is necessary for the increased proliferation of myoblasts after stretching, and accelerates myogenic differentiation and fusion.Citation16,17 However, the mechanisms behind the effects of PGE2 in myoblast proliferation and differentiation are unknown. Furthermore, given that our results have shown that PGE2 is a potential candidate molecule mediating biochemical signaling from bone to muscle, it is essential to determine the specific roles of PGE2 on different steps of myogenic differentiation. Such knowledge could provide insights for improving both bone and muscle health and also open new venues for the development of new pharmacological interventions to target bone-muscle crosstalk.
PGE2 induces intracellular signal transduction through binding to 4 subtypes of G-protein coupled receptors, EP1, EP2, EP3, and EP4. In general, the EP1 receptor is coupled to Gq to increase intracellular calcium levels. Activation of either EP2 or EP4 will stimulate cyclic AMP production through Gs. In contrast, the EP3 receptor inhibits adenylate cyclase by coupling to Gi.Citation18,19 Nevertheless, the roles of EP subtypes in cell proliferation are different, and could be cell type-dependent.Citation20-Citation24
To study the role of PGE2 in myoblast proliferation, the expression of EPs in mouse primary myoblasts was determined showing that all EPs are expressed in myoblasts. However, PGE2 along with only an agonist for the EP4 receptor promoted myoblast proliferation, whereas EP1/3 and EP2 agonists did not show any significant effects. In addition, treatment with an EP4 antagonist L161,982 resulted in inhibition of myoblast proliferation and cell cycle arrest. Cotreatment with antioxidant NAC or SA attenuated or abolished the inhibition of myoblast proliferation caused by L161,982. These results demonstrate the importance of EP4 receptor signaling in myogenesis and deepen our understanding of the molecular machinery underlying the modulatory effects of PGE2 on muscle myogenesis through its specific effects on myoblast proliferation.
Results
The expression of EP receptors in primary myoblasts
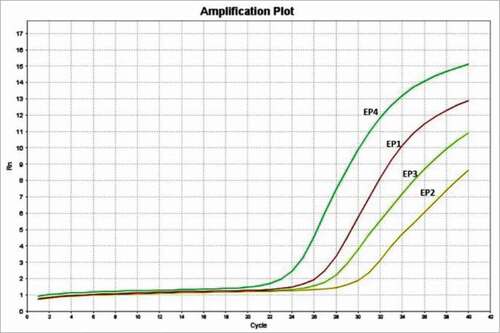
The mRNA expression of the 4 known EP subtypes in primary myoblasts was determined by qPCR. All four receptors were detected with EP4>EP1>EP3>EP2 (). This finding, to our knowledge is the first time of EP receptor expression has been quantitated in skeletal muscle.
Figure 1. The expression of EP receptors in mouse primary myoblast. The qPCR results showed that all 4 EP receptors are detectable in mouse primary myoblast, with the Ct values of 25.0 (EP1), 29.6 (EP2), 26.4 (EP3), and 22.2 (EP4).
The Effect of PGE2, EP agonists and EP antagonists on myoblast proliferation
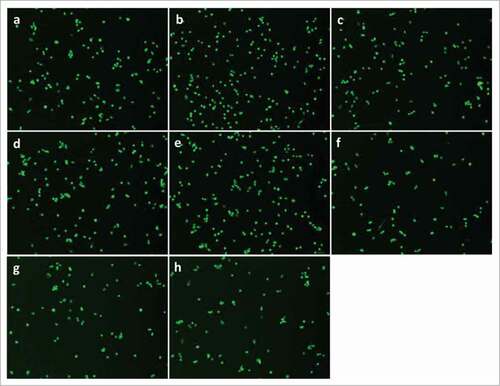
To determine the effect of PGE2 signaling on primary myoblast proliferation, cells were treated with 5 and 50 nM PGE2, 17-PT PGE2 (EP1/EP3 agonist), butaprost (EP2 agonist), or CAY 10598 (EP4 agonist) in growth medium with 20% FBS. At 24 h time point, no significant difference on myoblast proliferation was observed with any treatment (). However, after 48 h, treatment with 50 nM PGE2 significantly increased myoblast proliferation by 21 ± 6.3% () and EP4 agonist CAY 10598 increased proliferation by 17 ± 6.2 % (), which is not significantly different from PGE2. However, the agonists that act through EP1, EP2 or EP3 did not exert any significant or noticeable effects. Therefore, EP4 signaling may play a major role in promoting myoblast proliferation induced by PGE2. Next, a concentration-dependent effect of EP4 antagonist L161,982 (10, 20, and 30 μM) on myoblast proliferation was tested. At 24 and 48 h, L161,982 dose-dependently inhibited myoblast proliferation (), and co-treatment with L161,982 abolished the effect of PGE2 and CAY 10598 on primary myoblast proliferation (). These data further confirm the importance of PGE2 and EP4 signaling in myoblast proliferation.
Figure 2. PGE2 signaling through EP4 receptor increases mouse primary myoblast proliferation. A, No significant change was observed after treatment with PGE2, 17-PT PGE2 (EP1/EP3 agonist), butaprost (EP2 agonist), or CAY 10598 (EP4 agonist) for 24h; B, PGE2 and EP4 agonist CAY 10598 significantly promoted primary myoblast proliferation at 48 h; C, EP4 antagonist L161,982 inhibited primary myoblast proliferation dose-dependently at 24 and 48 h; D, Cotreatment with L161,982 blocked the effect of PGE2 and CAY 10598 on primary myoblast proliferation at 48 h. N = 4–5, *: P < 0.05. E, Representative images of MyoD staining for a: Control; b: PGE2; c: 17-PT PGE2; d: Butaprost; e: CAY 10598; f: L161,982; g: L161,982+PGE2; h: L161,982+CAY 10598.
Figure 2. (Continued)
Cell cycle analysis
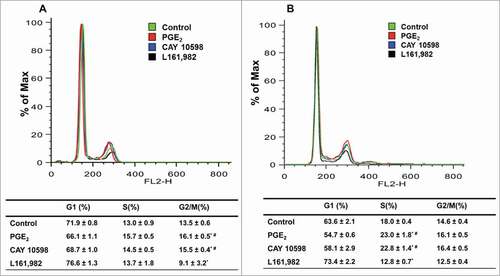
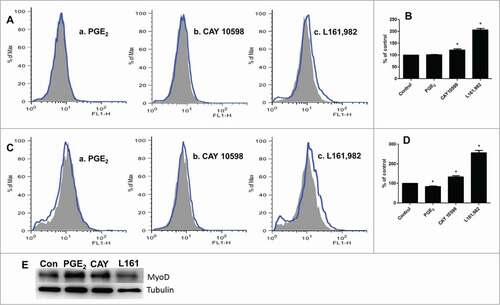
Next we determined whether the changes in proliferation are associated with modulation of cell cycle. After treatment with PGE2 or EP4 agonist CAY 10598 for 24 h, a time point that allowed cells to complete one cell cycle, increased G2/M phase and decreased G1 phase cells were observed. Treatment with L161,982 resulted in fewer cells in G2/M phase and more cells in G1 phase (). At 36 h, when myoblasts are undergoing G1-S phase transition, treatment with PGE2 or EP4 agonist CAY 10598 increased the number of cells in S phase and decreased G1 phase cells, whereas treatment with L161,982 significantly increased the percentage of cells in G1 phase by ˜10% (). These data suggest that PGE2 or EP4 signaling regulates the G1-S phase transition in primary myoblasts.
Figure 3. PGE2/EP4 signaling is important for G1-S phase cell cycle transition in primary myoblasts. Representative cell cycle profile at 24 h (A) and 36 h (B), with respective quantification of cell distribution in cell cycle. N = 3, *: P < 0.05 compared with control; #: P < 0.05 compared with L161,982.
Effects of PGE2, CAY10598, and L161,982 on gene expression of cell cycle regulators
As mentioned previously, G1-S phase transition is regulated by cyclins, Cdks, cell cycle inhibitors p21Cip1 and p27Kip1, and the muscle specific regulator myostatin. To investigate how PGE2 signaling could modify the expression of these genes, mRNA was extracted from primary myoblasts treated with 50 nM PGE2, 50 nM CAY 10598, and 30 μM L161,982 for 36 h, followed by determination of gene expression using qPCR. Compared with control, PGE2 and CAY10598 significantly upregulated cyclin E1 expression, and downregulated p21Cip1 and myostatin expressions. As expected, L161,982 exerted different effects in gene expression compared with PGE2 and CAY 10598, by significantly upregulating p21Cip1 and myostain expression, but downregulating cyclin E1 expression (). qPCR data support the results for both proliferation and cell cycle analyses. Moreover, western blot data also indicated that L161,982 treatment increases p21Cip1 protein level ().
Figure 4. (A) Real-time gene expression of regulators of G1-S phase transition in cell cycle. After treatment for 36 h, PGE2 and CAY 10598 upregulated cyclin E1 expression, but downregulated myostatin and p21Cip1 expressions. In contrast L161,982 increased p21Cip1 and myostatin expression, but inhibited cyclin E1 expression. These results support our finding in cell cycle analysis. N = 5, *: P < 0.05. (B) Representative Western blot from 2 replicate experiments illustrating that p21Cip1 protein content increased after L161,982 treatment. Bands from left to right: Control, PGE2, CAY 10598, and L161,982.
Treatment with L161,982 increased ROS production in myoblasts
Since various factors or pathways are involved in the regulation of cell proliferation, Mouse Signal Transduction PathwayFinder PCR Array, which allows us to monitor simultaneously 84 genes belonging to 10 essential signaling pathways, was used to identify the potential molecular mechanism(s) responsible for the effects of PGE2 signaling on myoblast proliferation. Hmox1 and Nqo1 are the only 2 genes significantly upregulated after L161,982 treatment for 12 h (2-fold cutoff) (). Since these 2 genes are induced by increased ROS production, these results suggest that PGE2 signaling could be regulating ROS in myoblast proliferation.
Figure 5. Mouse PathwayFinder PCR Gene Array results demonstrate that the gene expression of antioxidant enzymes Hmox1 and Nqo1 were significantly upregulated after treatment with L161,982.
Myoblasts were stained with chloromethyl 2′,7′-dichlorodihydrofluorescein diacetate (CM-H2DCFDA) to quantitate ROS production using flow cytometry. Our results indicated that L161,982 treatment significantly increased intracellular ROS levels at 12 and 36 h by 106% and 139%, respectively (). PGE2 treatment did not show any noticeable effects on ROS production at 12 h, but induced 18% reduction of ROS at 36 h (). Different from PGE2, CAY 10598 treatment enhanced ROS production by 22% and 37% at 12 and 36 h, respectively (). Since it has been previously shown that ROS overproduction leads to MyoD degradation,Citation25 we measured the content of MyoD and confirmed that its content was reduced after L161,982 treatment ().
Figure 6. ROS production after treatment with PGE2, CAY 10598, or L161,982. Gray solid area: Control; Blue curve: treatment. (A) ROS production after treatment for 12 h. a: PGE2; b: CAY 10598; c: L161,982. (B) quantification of ROS production in A. (C) ROS production after treatment for 36 h. a: PGE2; b: CAY 10598; c: L161,982. (D) quantification of ROS production in C. N = 3, *: P < 0.05. (E) Representative Western blot from 3 repetitions illustrating that MyoD protein content decreased after L161,982 treatment. Bands from left to right: Control, PGE2, CAY 10598, and L161,982.
Cotreatment with antioxidant NAC and SA reverses the inhibition of proliferation of myoblasts by L161,982
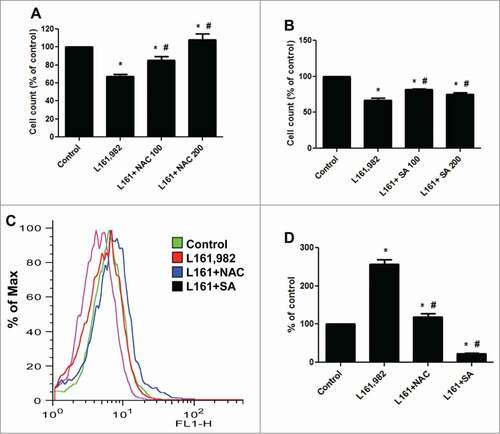
To further study the role of ROS in the inhibition of myoblast proliferation caused by L161,982, cells were cotreated with 100 and 200 μM antioxidant NAC or SA (). NAC showed a dose-dependent recovery in myoblast proliferation and reversal of the effects of L161,982. 200 μM NAC restored myoblast proliferation to control level (). SA significantly improved myoblast proliferation, however 100 μM SA showed better recovery than 200 μM (). ROS analysis indicated that cotreatment with 200 μM NAC significantly reduced the ROS production compared with L161,982 treatment alone (). In the presence of NAC, L161,982 treatment only increased ROS level by 18%. Moreover, SA showed a stronger antioxidant effect by reducing ROS production by 73% compared with control (). These data suggest that at least one of the molecular mechanisms underlying the effect of PGE2 signaling in myoblast proliferation is through the balancing of ROS levels with antioxidants.
Figure 7. Cotreatment with antioxidants NAC and SA reversed the effect of L161,982 on myoblast proliferation and ROS production. (A and B) Cotreatment with NAC (A) or SA (B) successfully reversed the inhibition of myoblast proliferation caused by L161,982; (C) cotreatment with NAC and SA inhibited the overproduction of ROS induced by L161,982. (D) quantification of ROS production in C. N = 3, *: P < 0.05 compared with control; #: P < 0.05 compared with L161,982.
Discussion
The traditional view of the muscle-bone relationship is a relatively simple and mechanical relationship, which is that bones provide attachment sites for skeletal muscles, and muscles induce mechanical loading to the skeleton. Recently, it has come to light that bone and muscle are endocrine organs, and muscle diseases, such as muscle atrophy or sarcopenia, and osteoporosis develop concomitantly in elderly patients. Therefore, it is very possible that there are biochemical communications between bone and muscle, and the knowledge gained by studying the bone-muscle crosstalk would be used for the development of new methods to treat muscle atrophy/sarcopenia and osteoporosis at the same time.
Since bone can release large amounts of PGE2, and PGE2 can mimic the effect of osteocyte CM on C2C12 myogenic differentiation, it has been considered as a potential factor signaling from bone to muscle. Our data have shown that PGE2 signaling is important for both myoblast proliferation and differentiation, the 2 critical steps for muscle development or regeneration. Four receptors responsible for intracellular signaling induced by PGE2 that have been identified, namely EP1 to EP4, but the expression of these receptors in skeletal muscle was previously unknown. In this study, we demonstrated that all 4 receptors are detectable in mouse primary myoblasts. In addition, treatment with PGE2 or the EP4 agonist CAY 10598 enhanced myoblast proliferation. Consistent with these results, antagonism of EP4 receptor using L161,982 inhibited myoblast growth. Our data suggest that PGE2 regulates myoblast proliferation via activation of the EP4 receptor.
Cell proliferation depends on cell cycle progression, which is tightly controlled by cyclins, specific kinases, and cell cycle inhibitors.Citation3 PGE2 signaling has been shown to promote cell cycle progression, especially in cancer cells, by acceleration of G1-S phase transition.Citation26 With regards to the role of the EP4 receptor in cell cycle progression, its effect could be cell type-dependent. In the human colon cancer cell line HT-29, EP4 positively regulate G1-S phase transition,Citation27 but acts as a negative regulator in the proliferation of B cells.Citation23 In our studies using mouse primary myoblasts, treatment with PGE2 or EP4 agonist CAY 10598 promoted G1-S phase transition, whereas EP4 antagonist L161,982 caused G0/G1 cell cycle arrest. Cyclin D and E are 2 major cyclins monitoring G1-S phase transition. Transcriptional induction of cyclin D starts at early G1 phase. Formation of cyclin D-Cdk4/6 complex phosphorylates cell cycle suppressors, such as retinoblastoma tumor suppressor protein, to initiate the expression of target genes, including cyclin E to promote cell cycle progression.Citation3 p21Cip1 can inhibit the activities of cyclin D-Cdk4/6 and cyclin E-Cdk2 to prevent cell cycle advancement.Citation28 The effect of PGE2 signaling on G1-S phase transition could be through regulating the expression of cyclin E and p21Cip1. Treatment with PGE2 or EP4 agonist significantly increased cyclin E expression, and decreased p21Cip1 expression. In contrast, EP4 antagonist inhibited cyclin E expression, but enhanced p21Cip1 expression. These results support our findings in cell counts and cell cycle analysis. In addition, the effect of PGE2, EP4 agonist, and EP4 antagonist on the expression of myostatin, a potent inhibitor of myoblast proliferation and differentiation, is similar to that on p21Cip1 expression. Since myostatin can induce cyclin D degradation,Citation6 upregulation of myostatin by an EP4 antagonist could be responsible for the downregulation of cyclin E. Myostatin has been recognized as a major target for the treatment of muscle wasting, however, the mechanisms controlling the expression of myostatin in skeletal muscle are not clear. In this study, we have shown that PGE2 and EP4 signaling could play an important role in the regulation of myostatin expression.
To determine the possible pathway(s)/mechanism(s) responsible for the effect of PGE2 signaling on myoblast proliferation, mouse PathwayFinder PCR arrays were utilized. Treatment with L161,982 induced the expression of Hmox1 and Nqo1, suggesting increased production of ROS in myoblasts.Citation29 Excessive production of ROS has been linked to the development of many diseases, such as cancer and cardiovascular diseases.Citation30,31 ROS can cause DNA damage, which subsequently leads to cell death or cell cycle arrest.Citation32 On the other hand, ROS also acts as a second messenger in mediating signal transduction. The effect of insulin-like growth factor-I on the proliferation of vascular smooth muscle cells is ROS-dependent,Citation33 and ROS plays an important role in promoting proliferation of haematopoietic progenitor cells and pulmonary epithelial cells.Citation34,35 In skeletal muscle, low levels of ROS are beneficial for mitochondrial biogenesis and muscle adaption, whereas oxidative stress causes muscle atrophy.Citation36 Following treatment of myoblasts with the EP4 antagonist L161,982, ROS levels significantly increased, suggesting that ROS could be the mediator for G0/G1 cycle arrest. Co-treatment with the antioxidants, NAC or SA substantially reversed the inhibition of myoblast proliferation caused by L161,982 treatment. In fact, the effects of ROS overproduction were confirmed at the protein level in our results since we demonstrated that MyoD was reduced after EP4 receptor antagonist treatment. Furthermore, cotreatment with 200 µM NAC restored the proliferation of myoblasts to normal levels, which was accompanied by significant reduction in ROS production compared with L161,982 treatment alone. Interestingly, SA was more potent than NAC, but cotreatment with SA could not totally rescue the inhibitory effect of L161,982 in myoblast proliferation. These results imply that there could be a window of ROS levels that is optimal for promoting myoblast proliferation. Moreover, it is possible that other pathways or mechanisms are also involved in recovery of myoblast proliferation induced by NAC and SA.
Mitochondria are the major sites of ROS production in cells. Previous studies have shown that PGE2 can activate Bcl−2 or Bax to regulate mitochondrial function.Citation37,38 Our previous data also indicated that PGE2 increases peroxisome proliferator-activated receptor gamma coactivator 1-α (PGC-1α), and superoxide dismutase 1 (SOD1) expression in differentiating C2C12 myoblasts.Citation16 It is possible that PGE2 stimulates mitochondria biogenesis, which will increase production of ROS. When EP4 receptor is functional, SOD1 will also be upregulated to neutralize ROS. However, inhibition of EP4 receptor may inhibit the expression of SOD1 resulting in the overproduction of ROS and the upregulation of Hmox1 and Nqo1, which implies the activation of the Kelch-like ECH-associated protein 1 (Keap1)/NF-E2-related factor 2 (Nrf2) pathway.Citation39 Further studies are necessary to understand how PGE2 regulates mitochondrial function and ROS production in mitochondria in myoblasts, and the relationship between PGE2 signaling and Keap1/Nrf2 pathway.
In summary, our data demonstrate that PGE2 promotes primary myoblast proliferation by accelerating G1-S phase transition in cell cycle. Although all the 4 types of PGE2 receptor are detectable in myoblasts, EP4 receptor could play a major role in this process. Moreover, PGE2 signaling could be an important modulator of oxidative stress in skeletal muscle, which could have significant implications in a number of pathological disorders, such as muscle atrophy, muscular dystrophies, and aging sarcopenia.
Materials and Methods
Myoblast isolation and culture
Primary myoblasts were isolated from hindlimb muscles of 5-month old C57BL/6 mice. Collected muscles were minced, and digested using 0.1% pronase (EMD Millipore). Isolated cells (fibroblasts and myoblasts) were maintained and expanded in collagen-I (BD Bioscience) coated T-75 flask in growth medium consisted of Ham's F-10 (Corning), 20% fetal bovine serum (FBS, Atlanta Biologicals), 5 ng/ml basic recombinant human fibroblast growth factor (Promega), 100 µg/ml streptomycin (Thermo Scientific) and 100 U/ml penicillin G (Thermo Scientific) for 3 to 4 weeks for purification. Myoblasts with ≥ 99% purity as confirmed by immunostaining for MyoD were used for the experiments in this study.
qPCR
Total RNA was extracted from primary myoblasts using Direct-zol RNA MiniPrep (Zymo Research) according to the manufacturer's instruction, and was quantified in a Nanodrop 2000 spectrophotometer (Thermo Scientific). An aliquot of RNA sample (1µg) with the A260/280 nm absorbance ratio of 1.8 or above was reverse transcribed in a 20 µl reaction volume using a High Capacity cDNA Reverse Transcription Kit (Applied Biosystem).
The real-time PCR reaction mixture contained 2 µl cDNA (100 ng), 12.5 µl of the RT2 Real-Time TM SYBR Green/Rox PCR master mix (Qiagen), 0.4 µl of primer pairs (10 µM) and 10.1 µl of RNase free water to a complete reaction volume of 25 µl. qPCR was performed using Step-One Plus TM Real-Time PCR System (ABI), and results were normalized to the reference gene GAPDH. The following primer sequences (Forward and reverse) were used in this study:
EP1: CTAAGATTCGGGCTCTCCATAAA, GTGGGTAGAAGGTGTTGAGATT;
EP2: GGCCTCATTGGAGAAGTGTAAG, GCAGCCCAAACTACCTCATAAA;
EP3: GGTTCCTGTGAAGACTGAAGAC, AAGGTTCTGAGGCTGGAGATA;
EP4: CGGTTCCGAGACAGCAAA, CGGTTCGATCTAGGAATGG;
Myostatin: ATCCACCACGGTGCTAATG, GGGAGAGAGAGACTCGTACTT;
Cylin D1: CAGAGGCGGATGAGAACAAG, GAGGGTGGGTTGGAAATGAA;
Cylin E1: AATTGGGGCAATAGAGAAGAGGT, TGGAGCTTATAGACTTCGCACA;
Cdk2: CAGGACTTTGCCCTCACTAA, GCCCTCTGACAACTCAAGAA;
Cdk4: CTGATGGATGTCTGTGCTACTT, AGGTGCTTTGTCCAGGTATG;
p21Cip1: CCACAGCGATATCCAGACATTC, GAAGAGACAACGGCACACTT;
p27Kip1: CCTTCCGCCTGCAGAAAT, CTGACTCGCTTCTTCCATATCC.
The Mouse PathwayFinder PCR Gene Array (PAMM-014Z, Qiagen) was used to monitor changes in gene expression of 10 signaling pathways. For this purpose, cDNA was synthesized using RT2 first strand kit (Qiagen). Then the arrays were conducted according to the manufacturer's instruction. Ct values were normalized to one of the build-in housekeeping genes GAPDH, and data were analyzed using RT2 Profiler™ PCR Array Data Analysis Software (Qiagen). A 2-fold up/downregulation is considered as statistically significant.Citation40
Proliferation and cell cycle assays
Primary myoblasts were plated at 1.5×10⁵ cells/well in collagen-I coated 6-well plates in growth medium overnight, followed by induction of cell cycle arrest in G0/G1 phase by switching the medium to Ham's F-10 with 1% FBS for 10 h. For cell cycle analysis, cells were then treated with growth medium, PGE2 (Cayman Chemical), 17-PT PGE2 (EP1/EP3 agonist, Cayman Chemical), butaprost (EP2 agonist, Cayman Chemical), CAY 10598 (EP4 agonist, Cayman Chemical), or L161,982 (EP4 antagonist, Cayman Chemical ) in growth medium. At specified time points, cells were harvested with trypsin and counted with the Muse cell analyzer using a cell count and viability kit (EMD Millipore) or fixed in 70% ethanol for cell cycle analysis.Citation41 After fixing, cells were incubated with propidium iodide/RNase staining buffer (BD Biosciences) for 30 minutes for cell cycle analysis using FACScan flow cytometry (FL2 bandpass filter: 580 ± 50 nm). Cell cycle population analysis was performed using FloJo® software (Tree Star).
Immunohistochemistry
For MyoD staining, primary myoblasts were fixed in 10% neutral buffered formalin solution (NBF, Sigma-Aldrich) for 15 min. After removal of NBF, cells were washed 4 times with PBS, followed by permeabilization with 0.1% Triton-X-100 in PBS for 15 min. Cells were then incubated with primary MyoD antibody (1:150, 18943–1-AP, Proteintech) overnight at 4°C. After 3 washes with PBS, FITC–conjugated goat anti-rabbit secondary antibody (1:100, Proteintech) was added for incubation for 1 h at room temperature. Images were taken with Leica DMI 4000B microscope using Leica Application Suite Advance Imaging fluorescence software package (Leica Microsystems).
Protein sample preparation and Western blotting
Primary myoblasts cultured in 6-well plates were washed 3-times with ice-cold Dulbecco's phosphate buffered saline before being lysed by RIPA buffer [1× Tris-buffered saline (TBS), 1% Nonidet P-40, 0.5% sodium deoxycholate, 0.1% SDS, 0.004% sodium azide] (Santa Cruz) with 1% cocktail of proteinase and phosphatase inhibitors (Sigma-Aldrich). Lysates were then collected and incubated in ice for 20 min, followed by centrifugation at 12,000 ×g for 10 min at 4°C. Supernatants were collected for protein assy.
Protein assay was performed using Micro BCA Protein Assay Kit (Thermo Scientific) according to the manufacturer's instructions. Protein samples then were mixed with 5× Western blot loading buffer (Thermo Scientific) and denatured at 100°C for 5 min.
For Western blots, 10 µg of total protein were fractionated by SDS-PAGE gels, and transferred to polyvinylidenedifluoride (PVDF) membranes (EMD Millipore). Membranes were blocked in 5% non-fat dry milk in 1× TBS with 0.1% Tween 20 (TBST) for 2 h at room temperature (RT). After incubation with rabbit anti-mouse primary p21Cip1 (1:600, 10355–1-AP, Proteintech) or MyoD (1:2,000, 18943–1-AP, Proteintech) antibody in 5% nonfat dry milk in TBST at 4°C overnight, horseradish peroxidase-conjugated secondary goat anti-rabbit Ab (1:10,000, Proteintech) was applied to membranes for 1 h at RT. After three 10 min washes in TBST, membranes were incubated with ECL reagents, and signals were detected by Fuji LAS-4000 imaging system (Fujifilm). Tubulin was used as a loading control in the experiments.
Measurement of intracellular ROS
Cell culture and treatments with PGE2, CAY 10598, and L161, 982 for determination of ROS were performed as in the proliferation and cell cycle assays. After treatment for 12 or 36 h, culture media were removed, and 800 µl of 4 µM CM-H2DCFDA (Life Technologies) in Hank's balanced salt solution was added to each well, followed by incubation at 37°C for 20 min. Cells were then harvested with trypsin, and collected for ROS analysis using flow cytometry (FASCAN, FL1 bandpass filter: 530 ± 30 nm).
Statistical analysis
The results are expressed as mean ± standard error of means (SEM). Data were analyzed by one- way analysis of variance, followed by Bonferrroni's posthoc test. For all tests, P < 0.05 was considered as statistically significant difference.
Disclosure of Potential Conflicts of Interest
No potential conflicts of interest were disclosed.
Funding
This study is supported by NIH-National Institutes of Aging PO1 AG039355 (LB and MB), and Dale and Dorothy Thompson Endowment Fund (MB).
Related Research Data
References
- Zammit PS, Partridge TA, Yablonka-Reuveni Z. The skeletal muscle satellite cell: the stem cell that came in from the cold. J Histochem Cytochem 2006; 54:1177-91; PMID:16899758; https://doi.org/10.1369/jhc.6R6995.2006
- Bertoli C, Skotheim JM, de Bruin RA. Control of cell cycle transcription during G1 and S phases. Nat Rev Mol Cell Biol 2013; 14:518-28; PMID:23877564; https://doi.org/10.1038/nrm3629
- Vermeulen K, Van Bockstaele DR, Berneman ZN. The cell cycle: a review of regulation, deregulation and therapeutic targets in cancer. Cell Prolif 2003; 36:131-49; PMID:12814430; https://doi.org/10.1046/j.1365-2184.2003.00266.x
- Serrano AL, Baeza-Raja B, Perdiguero E, Jardi M, Munoz-Canoves P. Interleukin-6 is an essential regulator of satellite cell-mediated skeletal muscle hypertrophy. Cell Metab 2008; 7:33-44; PMID:18177723; https://doi.org/10.1016/j.cmet.2007.11.011
- Ji M, Zhang Q, Ye J, Wang X, Yang W, Zhu D. Myostatin induces p300 degradation to silence cyclin D1 expression through the PI3K/PTEN/Akt pathway. Cell Signal 2008; 20:1452-8; PMID:18472397; https://doi.org/10.1016/j.cellsig.2008.03.013
- Yang W, Zhang Y, Li Y, Wu Z, Zhu D. Myostatin induces cyclin D1 degradation to cause cell cycle arrest through a phosphatidylinositol 3-kinase/AKT/GSK-3 β pathway and is antagonized by insulin-like growth factor 1. J Biol Chem 2007; 282:3799-808; PMID:17130121; https://doi.org/10.1074/jbc.M610185200
- Langley B, Thomas M, McFarlane C, Gilmour S, Sharma M, Kambadur R. Myostatin inhibits rhabdomyosarcoma cell proliferation through an Rb-independent pathway. Oncogene 2004; 23:524-34; PMID:14724580; https://doi.org/10.1038/sj.onc.1207144
- Tormos AM, Talens-Visconti R, Nebreda AR, Sastre J. p38 MAPK: a dual role in hepatocyte proliferation through reactive oxygen species. Free Radic Res 2013; 47:905-16; PMID:23906070; https://doi.org/10.3109/10715762.2013.821200
- Macleod KF. The role of the RB tumour suppressor pathway in oxidative stress responses in the haematopoietic system. Nat Rev Cancer 2008; 8:769-81; PMID:18800074; https://doi.org/10.1038/nrc2504
- Zaccagnini G, Martelli F, Magenta A, Cencioni C, Fasanaro P, Nicoletti C, Biglioli P, Pelicci PG, Capogrossi MC. p66(ShcA) and oxidative stress modulate myogenic differentiation and skeletal muscle regeneration after hind limb ischemia. J Biol Chem 2007; 282:31453-9; PMID:17726026; https://doi.org/10.1074/jbc.M702511200
- Luczak K, Balcerczyk A, Soszynski M, Bartosz G. Low concentration of oxidant and nitric oxide donors stimulate proliferation of human endothelial cells in vitro. Cell Biol Int 2004; 28:483-6; PMID:15223026; https://doi.org/10.1016/j.cellbi.2004.03.004
- Jansen KM, Pavlath GK. Prostaglandin F2alpha promotes muscle cell survival and growth through upregulation of the inhibitor of apoptosis protein BRUCE. Cell Death Differ 2008; 15:1619-28; PMID:18566603; https://doi.org/10.1038/cdd.2008.90
- Horsley V, Pavlath GK. Prostaglandin F2(α) stimulates growth of skeletal muscle cells via an NFATC2-dependent pathway. J Cell Biol 2003; 161:111-8; PMID:12695501; https://doi.org/10.1083/jcb.200208085
- Bondesen BA, Jones KA, Glasgow WC, Pavlath GK. Inhibition of myoblast migration by prostacyclin is associated with enhanced cell fusion. FASEB J 2007; 21:3338-45; PMID:17488951; https://doi.org/10.1096/fj.06-7070com
- Velica P, Khanim FL, Bunce CM. Prostaglandin D2 inhibits C2C12 myogenesis. Mol Cell Endocrinol 2010; 319:71-8; PMID:20109525; https://doi.org/10.1016/j.mce.2010.01.023
- Mo C, Romero-Suarez S, Bonewald L, Johnson M, Brotto M. Prostaglandin E2: from clinical applications to its potential role in bone- muscle crosstalk and myogenic differentiation. Recent Pat Biotechnol 2012; 6:223-9; PMID:23092433; https://doi.org/10.2174/1872208311206030223
- Otis JS, Burkholder TJ, Pavlath GK. Stretch-induced myoblast proliferation is dependent on the COX2 pathway. Exp Cell Res 2005; 310:417-25; PMID:16168411; https://doi.org/10.1016/j.yexcr.2005.08.009
- Rundhaug JE, Simper MS, Surh I, Fischer SM. The role of the EP receptors for prostaglandin E2 in skin and skin cancer. Cancer Metastasis Rev 2011; 30:465-80; PMID:22012553; https://doi.org/10.1007/s10555-011-9317-9
- Breyer RM. Prostaglandin EP(1) receptor subtype selectivity takes shape. Mol Pharmacol 2001; 59:1357-9; PMID:11353793
- De Keijzer S, Meddens MB, Torensma R, Cambi A. The Multiple Faces of Prostaglandin E2 G-Protein Coupled Receptor Signaling during the Dendritic Cell Life Cycle. Int J Mol Sci 2013; 14:6542-55; PMID:23528886; https://doi.org/10.3390/ijms14046542
- Mori A, Ito S, Morioka M, Aso H, Kondo M, Sokabe M, Hasegawa Y. Effects of specific prostanoid EP receptor agonists on cell proliferation and intracellular Ca(2+) concentrations in human airway smooth muscle cells. Eur J Pharmacol 2011.
- Loffler I, Grun M, Bohmer FD, Rubio I. Role of cAMP in the promotion of colorectal cancer cell growth by prostaglandin E2. BMC Cancer 2008; 8:380; PMID:19099561; https://doi.org/10.1186/1471-2407-8-380
- Murn J, Alibert O, Wu N, Tendil S, Gidrol X. Prostaglandin E2 regulates B cell proliferation through a candidate tumor suppressor, Ptger4. J Exp Med 2008; 205:3091-103; PMID:19075289; https://doi.org/10.1084/jem.20081163
- Kimura M, Osumi S, Ogihara M. Prostaglandin E(2) (EP(1)) receptor agonist-induced DNA synthesis and proliferation in primary cultures of adult rat hepatocytes: the involvement of TGF-α. Endocrinology 2001; 142:4428-40; PMID:11564707
- Barbieri E, Sestili P. Reactive oxygen species in skeletal muscle signaling. J Signal Transduct 2012; 2012:982794; PMID:22175016; https://doi.org/10.1155/2012/982794
- Xia D, Holla VR, Wang D, Menter DG, DuBois RN. HEF1 is a crucial mediator of the proliferative effects of prostaglandin E(2) on colon cancer cells. Cancer Res 2010; 70:824-31; PMID:20068165; https://doi.org/10.1158/0008-5472.CAN-09-2105
- Doherty GA, Byrne SM, Molloy ES, Malhotra V, Austin SC, Kay EW, Murray FE, Fitzgerald DJ. Proneoplastic effects of PGE2 mediated by EP4 receptor in colorectal cancer. BMC Cancer 2009; 9:207; PMID:19558693; https://doi.org/10.1186/1471-2407-9-207
- Stewart ZA, Leach SD, Pietenpol JA. p21(Waf1/Cip1) inhibition of cyclin E/Cdk2 activity prevents endoreduplication after mitotic spindle disruption. Mol Cell Biol 1999; 19:205-15; PMID:9858545
- Kansanen E, Kuosmanen SM, Leinonen H, Levonen AL. The Keap1-Nrf2 pathway: Mechanisms of activation and dysregulation in cancer. Redox Biol 2013; 1:45-9; PMID:24024136; https://doi.org/10.1016/j.redox.2012.10.001
- Li X, Fang P, Mai J, Choi ET, Wang H, Yang XF. Targeting mitochondrial reactive oxygen species as novel therapy for inflammatory diseases and cancers. J Hematol Oncol 2013; 6:19; PMID:23442817; https://doi.org/10.1186/1756-8722-6-19
- Lin JK, Tsai SH. Chemoprevention of cancer and cardiovascular disease by resveratrol. Proc Natl Sci Counc Repub China B 1999; 23:99-106; PMID:10492890
- Pizarro JG, Folch J, Vazquez De la Torre A, Verdaguer E, Junyent F, Jordan J, Pallas M, Camins A. Oxidative stress-induced DNA damage and cell cycle regulation in B65 dopaminergic cell line. Free Radic Res 2009; 43:985-94; PMID:19657808; https://doi.org/10.1080/10715760903159188
- Meng D, Shi X, Jiang BH, Fang J. Insulin-like growth factor-I (IGF-I) induces epidermal growth factor receptor transactivation and cell proliferation through reactive oxygen species. Free Radic Biol Med 2007; 42:1651-60; PMID:17462533; https://doi.org/10.1016/j.freeradbiomed.2007.01.037
- Hole PS, Pearn L, Tonks AJ, James PE, Burnett AK, Darley RL, Tonks A. Ras-induced reactive oxygen species promote growth factor-independent proliferation in human CD34+ hematopoietic progenitor cells. Blood 2010; 115:1238-46; PMID:20007804; https://doi.org/10.1182/blood-2009-06-222869
- Chess PR, O'Reilly MA, Sachs F, Finkelstein JN. Reactive oxidant and p42/44 MAP kinase signaling is necessary for mechanical strain-induced proliferation in pulmonary epithelial cells. J Appl Physiol (1985) 2005; 99:1226-32; PMID:15890751; https://doi.org/10.1152/japplphysiol.01105.2004
- Barbieri E, Sestili P. Reactive oxygen species in skeletal muscle signaling. J Signal Transduct 2012; 2012:982794; PMID:22175016; https://doi.org/10.1155/2012/982794
- Lalier L, Cartron PF, Pedelaborde F, Olivier C, Loussouarn D, Martin SA, Meflah K, Menanteau J, Vallette FM. Increase in PGE2 biosynthesis induces a Bax dependent apoptosis correlated to patients' survival in glioblastoma multiforme. Oncogene 2007; 26:4999-5009; PMID:17369862; https://doi.org/10.1038/sj.onc.1210303
- Sheng H, Shao J, Morrow JD, Beauchamp RD, DuBois RN. Modulation of apoptosis and Bcl−2 expression by prostaglandin E2 in human colon cancer cells. Cancer Res 1998; 58:362-6; PMID:9443418
- Taguchi K, Motohashi H, Yamamoto M. Molecular mechanisms of the Keap1-Nrf2 pathway in stress response and cancer evolution. Genes Cells 2011; 16:123-40; PMID:21251164; https://doi.org/10.1111/j.1365-2443.2010.01473.x
- Huang J, Hsu YH, Mo C, Abreu E, Kiel DP, Bonewald LF, Brotto M, Karasik D. METTL21C is a potential pleiotropic gene for osteoporosis and sarcopenia acting through the modulation of the NF-kappaB signaling pathway. J Bone Miner Res 2014; 29:1531-40; PMID:24677265; https://doi.org/10.1002/jbmr.2200
- Khan A, Gillis K, Clor J, Tyagarajan K. Simplified evaluation of apoptosis using the Muse cell analyzer. Postepy Biochem 2012; 58:492-6; PMID:23662443