
Abstract
Diabetes mellitus type 2 (T2DM), insulin therapy, and hyperinsulinemia are independent risk factors of liver cancer. Recently, the use of a novel inhibitor of insulin degrading enzyme (IDE) was proposed as a new therapeutic strategy in T2DM. However, IDE inhibition might stimulate liver cell proliferation via increased intracellular insulin concentration. The aim of this study was to characterize effects of inhibition of IDE activity in HepG2 hepatoma cells and to analyze liver specific expression of IDE in subjects with T2DM. HepG2 cells were treated with 10 nM insulin for 24 h with or without inhibition of IDE activity using IDE RNAi, and cell transcriptome and proliferation rate were analyzed. Human liver samples (n = 22) were used for the gene expression profiling by microarrays. In HepG2 cells, IDE knockdown changed expression of genes involved in cell cycle and apoptosis pathways. Proliferation rate was lower in IDE knockdown cells than in controls. Microarray analysis revealed the decrease of hepatic IDE expression in subjects with T2DM accompanied by the downregulation of the p53-dependent genes FAS and CCNG2, but not by the upregulation of proliferation markers MKI67, MCM2 and PCNA. Similar results were found in the liver microarray dataset from GEO Profiles database. In conclusion, IDE expression is decreased in liver of subjects with T2DM which is accompanied by the dysregulation of p53 pathway. Prolonged use of IDE inhibitors for T2DM treatment should be carefully tested in animal studies regarding its potential effect on hepatic tumorigenesis.
Abbreviations
| CCNG2, Cyclin G2 gene | = | CDKN1A/P21, Cyclin-dependent kinase inhibitor 1A (p21, Cip1) gene |
| CDKN1B/P27, | = | Cyclin-dependent kinase inhibitor 1B (p27, Kip1) gene |
| FAS, | = | Fas cell surface death receptor gene |
| FBS | = | Fetal bovine serum |
| IDE | = | Insulin-degrading enzyme |
| MCM2, | = | Minichromosome maintenance complex component 2 gene |
| MKI67, | = | Marker of proliferation Ki-67 gene |
| NAS | = | Non-alcoholic fatty liver disease score |
| NAFLD | = | Non-alcoholic fatty liver disease |
| OGTT | = | Oral glucose tolerance test |
| PCNA, | = | Proliferating cell nuclear antigen gene |
| qRT-PCR | = | Quantitative real-time PCR |
| SESN1, | = | Sestrin 1 gene |
| TP53, | = | Tumor protein p53 gene |
| TP53I3, | = | Tumor protein p53 inducible protein 3 gene |
| T2DM | = | Type 2 diabetes mellitus. |
Introduction
Insulin degrading enzyme (IDE) is a major enzyme responsible for insulin degradation in the liver. Animal models and genetic association studies in humans suggest that IDE is an important player in the pathogenesis of type 2 diabetes (T2DM).Citation1,2 Recently, Maianti et al.Citation3 proposed the use of an IDE inhibitor, 6bK, as a new therapeutic strategy to treat T2DM. This conclusion was based on the 6bK mediated decrease of postprandial glucose concentrations after oral glucose administration (OGTT) in lean and obese mice. Whether inhibition of IDE activity is also efficient as an antidiabetic strategy in humans still remains to be established, and several opposite findings need to be taken into account.
In particular, the inhibition of IDE activity results in increased extracellular and intracellular insulin concentration Citation4 which might be crucial for insulin-dependent regulation of gene expression and cell proliferation. T2DM is an independent risk factor of hepatocellular carcinoma (HCC)Citation5 possibly because of chronic hyperinsulinemia. A non-alcoholic fatty liver disease (NAFLD) frequently associated with insulin resistance and hyperinsulinemiaCitation6 was also shown to be a HCC risk factor.Citation7 Moreover, some antidiabetic treatments such as insulin and insulin secretagogues, sulfonylureas and glinides, increased the risk for overall cancer probably via the same mechanism.Citation8
Therefore, modulating IDE activity may represent a key link between T2DM and liver cancer. To evaluate the effects of IDE inhibition in vitro, we here characterized the effects of IDE knockdown on the transcriptome and proliferation rate of HepG2 hepatoma cells. To study the IDE regulation in humans, we additionally analyzed the IDE expression and its association with the expression of proliferation and p53-related markers in liver samples of subjects with and without T2DM.
Results
Effects of IDE knockdown on the HepG2 cell transcriptome
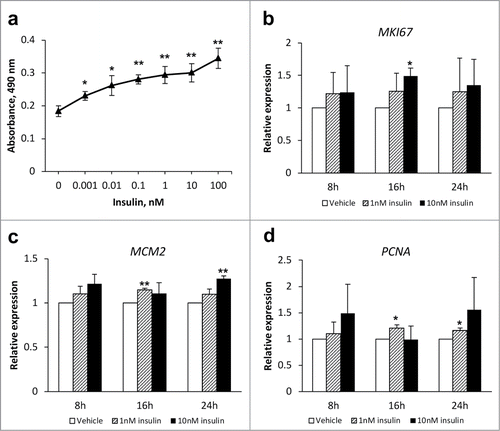
Insulin increased the proliferation () as well as the mRNA expression of proliferative markers MKI67, MCM2 and PCNA () in HepG2 cells. To study effects of the inhibition of IDE activity in vitro, HepG2 cells were transfected with siRNA for IDE (IDE RNAi) or control siRNA (Ctrl RNAi) and treated with vehicle or 10 nM insulin for 24 h.
Figure 1. Insulin increases proliferation of HepG2 cells. (A) Concentration-dependent effects of insulin on the HepG2 proliferation. Cells were treated with vehicle or various concentration of insulin for 24 h. Cell proliferation was measured using CellTiter 96® AQueous One Solution Cell Proliferation Assay. (B-D) HepG2 cells were treated with vehicle (white bars), 1 nM insulin (striped bars) or 10 nM insulin (black bars) for 8h, 16h or 24 h. Expression of mRNA of proliferative markers MKI67 (B), MCM2 (C), and PCNA (D) was measured using qRT-PCR and normalized to the expression of the housekeeper gene HPRT1. Data: mean ± SD; *P < 0.05, **p < 0.01 vs. vehicle in 2-tail Student's t-test.
IDE knockdown resulted in a significant IDE reduction on the mRNA and protein level (). Insulin treatment induced alterations of only 3 genes in cells transfected with non-targeting control siRNA, and all of them were lower than 1.3-fold (Table S1). However, in cells with IDE knockdown, insulin cause expression changes of 249 genes, and 19 of them were greater than 1.3-fold (Table S1). Pathway analysis revealed the single pathway regulated in these conditions, the cell cycle pathway, involved CDC6, GINS4, CDC20, and CENPI genes.
Figure 2. Effects of the IDE knockdown on proliferative and apoptotic markers in HepG2 cells. HepG2 cells were transfected with siRNA for IDE or AllStars Negative Control siRNA (Ctrl RNAi) and treated with vehicle (white bars) or 10 nM insulin (black bars) for 24 h. (A) Expression of IDE mRNA and protein. Representative western blots for IDE and β-actin are shown. (B) Selected annotation of affected biological processes (control RNAi vs. IDE RNAi) performed using DAVID database. Full classification is shown in Table S2. (C) qRT-PCR validation of microarray data for genes of p53 pathway. Target gene expression was normalized to the expression of the housekeeper gene HPRT1. (D) mRNA expression of proliferative markers MKI67, MCM2 and PCNA. *P < 0.05 for IDE RNAi vs. Ctrl RNAi in vehicle- (white bars) or insulin-treated (black bars) cells, respectively, in 2-tail Student's t-test. (E) Proliferation of Ctrl RNAi and IDE RNAi transfected HepG2 cells in proliferation medium (DMEM + 10% FBS) measured using CellTiter 96® AQueous One Solution Cell Proliferation Assay. Absorbance values (490 nm) are shown. P = 0.007 for time effect, p = 0.037 for siRNA effect, and p = 0.198 for time*siRNA in RM ANOVA. *P < 0.05 vs. control RNAi in 2-tail Student's t-test. Data: mean ± SD.
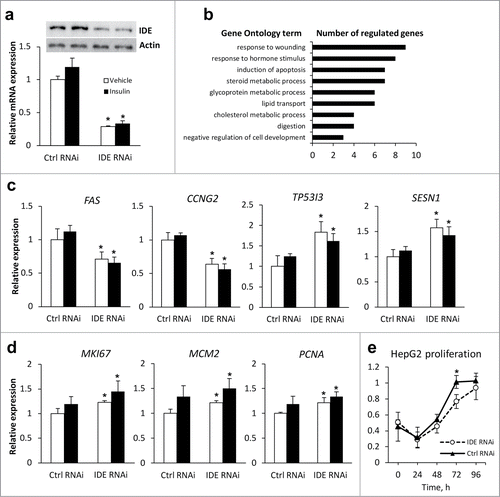
Furthermore, we analyzed transcriptomic changes in HepG2 hepatoma cells upon IDE knockdown. DAVID analysis revealed that induction of apoptosis () and p53 pathway (not shown) are one of most biological processes and signaling pathways, respectively, altered upon IDE knockdown. Interestingly, the expression of p53-dependent pro-apoptotic genes FAS and CCNG2 was decreased, whereas TP53I3 and SESN1 increased upon IDE RNAi which was confirmed by qRT-PCR (). We additionally measured expression of the TP53 gene and the expression of 2 prognostic markers for NASH-related HCC,Citation9,10 p21 and p27, by qRT-PCR and found no significant alterations (data not shown). Proliferation markers MKI67, MCM2 and PCNA were up-regulated in IDE knockdown cells (). Moreover, pAkt phosphorylation was slightly increased and expression of insulin-targeted gluconeogenesis genes G6PC and PEPCK decreased upon inhibition of IDE activity (Fig. S1) which points out the activation of Akt signaling pathway. Nevertheless, in serum-supplemented medium, the proliferation rate was lower in IDE knockdown cells in comparison to cells transfected with control siRNA ().
IDE expression in liver cancer cells lines with different proliferative capacity
To analyze possible association between IDE expression level and cell proliferation, we measured mRNA expression of IDE gene in liver cancer cells lines with different proliferative capacity (HepG2, HCC-M, HCC-T, Hep3B, HLF, PLC, FLC4, HLE and Huh7). The IDE expression in studied HCC cell lines was expressed as the n-fold difference relative to HepG2 samples. We could identify 2 groups of HCC cell lines, one with high IDE expression which included Huh7 and HCC-T cells, and another with relatively low levels of IDE mRNA including HepG2, HCC-M, Hep3B, HLF, PLC, FLC4 and HLE cells (Fig. S2). No correlation of IDE expression with proliferation markers MKI67 and cyclin B2 or tumor suppressor gene E-cadherin were found (data not shown).
IDE expression in the liver of subjects with T2DM
Because the published data about the IDE activity in subjects with T2DM are controversial, we further analyzed the IDE expression in liver samples from 3 groups of patients – NAFLD with T2DM, NAFLD without T2DM, and metabolically healthy subjects without NAFLD or T2DM (). For this, gene expression profiling of liver samples was performed using Illumina microarrays. In diabetic subjects with NAFLD, liver IDE expression was decreased in comparison with non-diabetic subjects with NAFLD (p = 6×10⁻⁵, after multiple testing correction p = 0.0044) or metabolic healthy subjects (p = 0.0027, after multiple testing correction p = 0.0357) (). This was accompanied by the decrease of TP53 expression, as well as expression of p53-target genes FAS, TP53I3, and SESN1 (). Unexpectedly, the expression of HCC markers p21 and p27, as well as of proliferation marker PCNA was also downregulated in subjects with T2DM. No expression differences of indicated genes between non-diabetic subjects with NAFLD and metabolically healthy subjects were found ().
Table 1. Clinical characteristics of study subjects
Table 2. Gene expression in liver of subjects with and without T2DM
Interestingly, IDE expression strongly and positively correlated with expression levels all abovementioned proliferation markers (r = 0.580, p = 0.005 for MKI67; r = 0.643, p = 0.001 for MCM2; r = 0.706, p < 0.001 for PCNA), p53-associated genes (r = 0.880 for FAS, r = 0.886 for CCNG2, r = 0.863 for TP53I3, r = 0.835 for SESN1, r = 0.868 for TP53, p < 0.001 for all genes), and HCC markers (r = 0.709, p < 0.001 and r = 0.825, p < 0.001 for p21 and p27, respectively). No association of expression of hepatic IDE or other markers with fasting insulin levels were found (Table S3). IDE expression levels also did not correlate with NAFLD activity score and liver fibrosis (Table S3).
Moreover, we analyzed 2 presently public available liver microarray data sets from patients with T2DM using the GEO Profiles database. In the first datasetCitation11 (GSE15653), we found the decrease of liver-specific IDE expression in obese patients with T2DM compared to lean non-diabetic subjects accompanied by the decrease of MKI67, FAS, CCNG2, and SESN1 expression, as well as by the increase of p21 expression (Table S4). Obese subjects without T2DM showed similar trends of hepatic gene expression (Table S4). IDE expression levels correlated with FAS (r = 0.509, p = 0.031), CCNG2 (r = 0.674, p = 0.002), TP53I3 (r = −0.472, p = 0.048), p21 (r = −0.657, p = 0.003), and p27 (r = 0.709, p = 0.001) expression. In the second data setCitation12 (GSE23343), no difference of liver-specific IDE expression was found between subjects with and without T2DM (data not shown).
Discussion
Our investigation indicates the decrease of IDE expression in the liver of subjects with T2DM. Indeed, in diabetic subjects with NAFLD, liver IDE expression was decreased in comparison with non-diabetic subjects with NAFLD or metabolic healthy subjects. Moreover, in one of 2 analyzed GEO datasets, we found the decrease of liver-specific IDE expression in obese patients with T2DM compared to lean non-diabetic subjects. Interestingly, obese subjects without T2DM showed similar trends of hepatic IDE expression suggesting that the decrease of IDE activity could be the primarily defect in some metabolic diseases.
Indeed, decreased hepatic insulin degradation is an early marker of a disturbed insulin metabolism,Citation13,14 and some polymorphisms of the IDE gene are associated with reduced insulin clearance and diabetes susceptibility.Citation2 Chronically exposed hyperinsulinemia increases insulin resistance and impairs insulin secretion.Citation2 Decreased IDE activity was described in adipocytes from subjects with diabetes.Citation15 Moreover, hyperglycemia abolishes an insulin-induced increase of IDE activity.Citation16 Obviously, the treatment of diabetic subjects with IDE inhibitors will not have a beneficial impact, if such treatment will be at all tolerable.
Furthermore, our in vitro data suggest that IDE knockdown dysregulates expression of genes involved in the cell cycle and apoptosis induction. Obviously, the IDE inhibition in vitro led to the amplification of the insulin-induced effects which are quickly switched off in intact cells because of prompt insulin degradation. It can explain why only 3 genes were changed in control cells 24h after the insulin stimulation, whereas 249 genes were regulated in IDE knockdown cells. Furthermore, proliferation markers MKI67, MCM2 and PCNA were significantly upregulated in IDE knockdown cells. The up-regulation of proliferation induced by IDE inhibition was demonstrated in skeletal myoblasts.Citation17
Unexpectedly, in HepG2 cells, we detected the decrease of cell proliferation upon IDE knockdown. No correlation between expression of IDE and proliferative markers was found in liver cancer cells lines with different proliferative capacity. In human liver samples, the decrease of IDE expression was not accompanied by the upregulation of proliferation markers. Moreover, the IDE expression in human liver positively correlated with expression levels of MKI67, PCNA, and MCM2. Thus, the decrease of IDE expression in vivo is not accompanied by the increase of the cell proliferation. A number of unknown molecular mechanisms might contribute to this effect.
Particularly, we found that the IDE knockdown in HepG2 cells led to the dysregulation of p53 pathway. Indeed, the expression of some p53-dependent pro-apoptotic genes, FAS and CCNG2, was decreased, whereas the expression of other p53-dependent genes, TP53I3 and SESN1, was increased upon IDE RNAi. Analysis of microarray data sets confirmed that the decrease of IDE expression was accompanied by the downregulation of FAS and CCNG2 genes, and their expression levels positively correlated with IDE expression. Interestingly, the hepatic expression of p53-dependent HCC marker p21 was upregulated in T2DM subjects in one of analyzed liver studies and downregulated in another study. Previously published data received from human brain samples confirm our finding about the link between the IDE and p53 pathway. In sporadic Alzheimer's disease, decrease of IDE expression was accompanied by the enhanced p53 expression.Citation18
Other side effects of IDE inhibition should be mentioned. IDE degrades a variety of metabolically active substrates, including glucagon, amylin, IGF-1, ANP etc.Citation3 The IDE substrate degradation is hypothesized to occur at rates that depend on their relative concentrations during secretory bursts.Citation3 Consistent with this hypothesis, the acute IDE inhibition improved glucose tolerance after OGTT in miceCitation3 because of a proportionally larger insulin release as compared to glucagon. However, in T2DM subjects, the glucagon level is increased and an “incretin effect” on insulin secretion is abolished. Thus, the IDE inhibition in case of such insulin-to-glucagon imbalance may result in slower degradation of glucagon, and in this way intensify glucose intolerance via increase of postprandial gluconeogenesis.Citation3
Moreover, IDE inhibition may lead to amyloid deposition and cytotoxicity in pancreatic β-cellsCitation19 and dysregulate other cellular processes such as proteosomal degradation.Citation20 Therefore, effects of prolonged treatment with IDE inhibitors should be necessarily tested in animal studies. Notably, older IDE knockout mice exhibited a severe diabetic phenotype characterized by increased body weight and pronounced glucose and insulin intolerance which presents compensatory response to chronic hyperinsulinemia.Citation1
In conclusion, our data suggest that IDE expression is decreased in liver of diabetic humans which is accompanied by the dysregulation of p53 pathway but not by the upregulation of proliferation markers. Whether the treatment with IDE inhibitors can induce hepatocellular carcinoma should be elucidated in animal studies. Moreover, IDE inhibition could intensify instead of improve glucose disturbances in T2DM. Alternatively, enhanced degradation of insulin by an IDE activator, accompanied by insulin sensitization in peripheral tissues, may be a perspective strategy for T2DM treatment and needs further investigation.
Materials and Methods
Cell culture
The human HCC cell lines (HepG2, HCC-M, HCC-T, Hep3B, HLF, PLC4, FLC4, HLE and Huh7) were grown in DMEM supplemented with 10% fetal bovine serum (FBS) (both from Life Technologies, Germany) and 1% penicillin/streptomycin (Sigma Aldrich, Germany). Cells were incubated in a humidified atmosphere of 5% CO2 at 37°C.
To inhibit IDE activity in HepG2 cells, IDE silencing (RNAi) were used. In preliminary experiments, we tested 4 predesigned FlexiTube IDE siRNAs from Qiagen (Hs_IDE_1, Hs_IDE_2, Hs_IDE_5, and Hs_IDE_6; more information is available at the QIAGEN's GeneGlobe Web portal). Shortly, we attested silencing efficiency of 4 IDE siRNAs (separately and as a pool) to establish the best experimental set-up (Fig. S3). In main experiments, cells (3×10⁵/well) were seeded on 6-well plates (TPP, Germany) covered with L-ornithine (Sigma Aldrich, Germany). After 24h, cells were transfected with a pool of 2 siRNA for IDE (Hs_IDE_5 and Hs_IDE_6, 96 nM of each siRNA) or with an equivalent amount of AllStars Negative Control siRNA (Qiagen, Germany) in OptiMEM medium (Life Technologies, Germany) using 7.5 µl/well Lipofectamine 2000 (Life Technologies, Germany). 16 h after transfection, cells were treated with vehicle or 10 nM insulin (Sigma Aldrich, Germany) for 24 h in serum starvation condition. All experiments were repeated 3 times.
Human liver study
We included 22 subjects from the cross-sectional INSIGHT (German Clinical Trials-Register: DRKS00005450) study who gave informed consent. The study was conducted in accordance with the Declaration of Helsinki as reflected in a priori approval by the institution's human research committee. Detailed medical history and physical examination data were obtained from all subjects. Blood samples were obtained after overnight fasting and clinical chemistry was assessed using standard methods in certified Clinical Chemistry laboratories.Citation21 T2DM was defined following the criteria of the American Diabetes Association.Citation22 Liver specimens were taken from a non-pathologic liver segment during hepatic surgery. Samples were flash-frozen in liquid nitrogen and stored at −80°C until RNA extraction procedure. A part of the liver sample was used for histopathological analysis after fixing in 4% formalin (Histofix, Roth, Germany), embedding in paraffin, and staining with hematoxylin and eosin. The unweighted sum of points for the intensity of liver steatosis, lobular inflammation and hepatocellular ballooning was used to calculate the NAS. Exclusively healthy liver tissue was used for analyses, as a blinded clinical expert pathologist considered all harvested liver samples to be histologically normal with respect to pathologies except for NAFLD.Citation21 For the gene expression profiling, subjects were categorized according to 3 groups – NAFLD with T2DM (n = 6), NAFLD without T2DM (n = 8), and metabolically healthy subjects without NAFLD and T2DM (n = 8).
Microarray analysis
Total RNA was purified using the RNeasy Mini Kit (Qiagen, Germany). RNA quality was assessed by Agilent 2100 bioanalyzer using Agilent RNA 6000 Nano Kit (Agilent Technologies, Germany). For HepG2 samples, biotinylated cRNA were prepared according to the standard Affymetrix protocol from 1 µg total RNA. Fragmented cRNA was hybridized to GeneChip Human Gene 1.0 ST Arrays (Affymetrix, Germany) for 16h at 45°C. GeneChips were washed and stained in the Affymetrix Fluidics Station 450. Microarrays were scanned with an Affymetrix scanner controlled by Affymetrix Microarray Suite software.
Human liver gene expression patterns were studied on the Illumina HumanHT-12 v4.0 BeadChip array.Citation23 Sample preparation from human liver was performed as described at the Illumina® TotalPrep TM-96 RNA Amplification Kit (Revision Date: October 15, 2009) (Ambion, Darmstadt, Germany).Citation23
Quantitative real-time PCR (qRT-PCR)
Synthesis of cDNA was performed using the High Capacity cDNA Reverse Transcription Kit (Applied Biosystems, Germany). QRT-PCR was carried out using Power SYBR Green PCR Master Mix and specific primers (Suppl. Table 2) in ABI Prism 7700 sequence detection system (Applied Biosystems, Germany).
Western blotting
HepG2 protein extracts were prepared in the cell lysis buffer (Life Technologies, Germany). Semi-dry immunoblots were performed with rabbit IDE antibody (1:1000, Hofheim, Germany), rabbit phospho-Akt (Ser473) antibody (1:1000, Life Technologies, Germany), rabbit β-actin antibody (1:2000, Sigma Aldrich, Germany), and anti-rabbit horseradish peroxidase-conjugated secondary antibody (1:2000, Life Technologies, Germany), and quantified using the CCD camera, Image Reader LAS-1000 Pro v 2.1 software (Fujifilm, Japan) and the AIDA Image Analyzer (Raytest, Germany).
Cell proliferation assay
HepG2 cells (5 × 10³ cells/well) were seeded into 96-well culture plates, grown for 24 h, and treated with various concentrations of insulin for 24 h. In RNAi experiments, cells (8 × 10³ cells/well) were maintained in proliferation medium (DMEM+10% FBS), and the proliferation assay was performed 24h, 48h, 72h and 96 h after transfection. For this, the CellTiter 96® AQueous One Solution Cell Proliferation Assay (Promega, Germany) was used. The absorbance was read at 490 nm using Wallac VICTOR2 1420 Multilabel plate reader.
Microarray processing and statistical analysis
For analysis of HepG2 microarray data, raw fluorescence intensity values were normalized applying quantile normalization, and gene expression values were converted to a log2 scale. CustomCDF Version 14 with Entrez based gene definitions was used for gene annotation. Differences in gene expression were analyzed with JMG Genomics Version 6.0 from SAS (SAS Institute, Cary, NC, USA). Genes with mean expression changes greater than 1.3 fold (log2 greater than 0.3785 and lower than −0.3785) and which were significant after a false-discovery rate correction (p < 0.05) were selected as regulated by experimental conditions and subjected for gene ontology (GO) and pathway analyses. This was done with DAVID (Database for Annotation, Visualization, and Interpreted Discovery; http://david.abcc.ncifcrf.gov/). Microarray data were deposited in Gene Expression Omnibus database (accession no. GSE61142).
For analysis of human liver microarray data, R software version 3.0.2 (2013-09-25) was used. The data was log transformed and quantile normalization was performed. Significance testing was performed using the Bioconductor-package limma.Citation24 All models were adjusted for sex, age and BMI. The significance level was adjusted according to Benjamini-Hochberg.Citation25 For correlation analysis, Spearman's rank correlation coefficient was used.
Analysis of public available microarray datasets from the GEO Profiles database (http://www.ncbi.nlm.nih.gov/geoprofiles/) was provided as described.Citation26 In the first data set (GSE15653), surgical liver biopsies from 13 obese (9 with T2DM) and 5 control subjects were studied.Citation11 In the second dataset (GSE23343), percutaneous needle liver biopsies from 10 people with T2DM and 7 normal subjects were analyzed.Citation12 If multiple probe sets were associated with the same gene, the probe with a maximum estimated fold change was used for analysis.
In vitro data were analyzed using 2-tailed Student's t-test or repeated measurement ANOVA (RM ANOVA), and p-value < 0.05 was considered as statistically significant. Statistical analyses were performed with SPSS 20.0 (Chicago, USA). All values are expressed as means ± SD.
Disclosure of Potential Conflicts of Interest
No potential conflicts of interest were disclosed.
1046647_suplpemental_files.zip
Download Zip (451.9 KB)Funding
The study was supported by a grant from German Diabetic Association (Allgemeine Projektförderung der DDG 2011, OP and NR; Allgemeine Projektförderung der DDG 2012, CvL and SDö) and from German Ministry of Education and Science (BMBF, ROS10-058 GERUSSFIT, A.P. and N.R.).
Supplemental Material
Supplemental data for this article can be accessed on the publisher's website.
Related Research Data
References
- Abdul-Hay SO, Kang D, McBride M, Li L, Zhao J, Leissring MA. Deletion of insulin-degrading enzyme elicits antipodal, age-dependent effects on glucose and insulin tolerance. PloS one 2011; 6:e20818; PMID:21695259; http://dx.doi.org/10.1371/journal.pone.0020818
- Rudovich N, Pivovarova O, Fisher E, Fischer-Rosinsky A, Spranger J, Mohlig M, Schulze MB, Boeing H, Pfeiffer AF. Polymorphisms within insulin-degrading enzyme (IDE) gene determine insulin metabolism and risk of type 2 diabetes. J Mol Med 2009; 87:1145-51; PMID:19809796; http://dx.doi.org/10.1007/s00109-009-0540-6
- Maianti JP, McFedries A, Foda ZH, Kleiner RE, Du XQ, Leissring MA, Tang WJ, Charron MJ, Seeliger MA, Saghatelian A, et al. Anti-diabetic activity of insulin-degrading enzyme inhibitors mediated by multiple hormones. Nature 2014; 511:94-8; PMID:24847884; http://dx.doi.org/10.1038/nature13297
- Leissring MA, Malito E, Hedouin S, Reinstatler L, Sahara T, Abdul-Hay SO, Choudhry S, Maharvi GM, Fauq AH, Huzarska M, et al. Designed inhibitors of insulin-degrading enzyme regulate the catabolism and activity of insulin. PloS one 2010; 5:e10504; PMID:20498699; http://dx.doi.org/10.1371/journal.pone.0010504
- Blonski W, Kotlyar DS, Forde KA. Non-viral causes of hepatocellular carcinoma. World J Gastroenterol 2010; 16:3603-15; PMID:20677332; http://dx.doi.org/10.3748/wjg.v16.i29.3603
- Vuppalanchi R, Chalasani N. Nonalcoholic fatty liver disease and nonalcoholic steatohepatitis: Selected practical issues in their evaluation and management. Hepatology 2009; 49:306-17; PMID:19065650; http://dx.doi.org/10.1002/hep.22603
- Michelotti GA, Machado MV, Diehl AM. NAFLD, NASH and liver cancer. Nat Rev Gastroenterol Hepatol 2013; 10:656-65; PMID:24080776; http://dx.doi.org/10.1038/nrgastro.2013.183
- Chang CH, Lin JW, Wu LC, Lai MS, Chuang LM. Oral insulin secretagogues, insulin, and cancer risk in type 2 diabetes mellitus. J Clin Endocrinol Metab 2012; 97:E1170-5; PMID:22563104; http://dx.doi.org/10.1210/jc.2012-1162
- Valenti L, Dongiovanni P. CDKN1A: a double-edged sword in fatty liver? Cell cycle 2014; 13:1371-2; PMID:24699009; http://dx.doi.org/10.4161/cc.28754
- Matsuda Y, Wakai T, Hirose Y, Osawa M, Fujimaki S, Kubota M. p27 Is a critical prognostic biomarker in non-alcoholic steatohepatitis-related hepatocellular carcinoma. Int J Mol Sci 2013; 14:23499-515; PMID:24351862; http://dx.doi.org/10.3390/ijms141223499
- Pihlajamaki J, Boes T, Kim EY, Dearie F, Kim BW, Schroeder J, Mun E, Nasser I, Park PJ, Bianco AC, et al. Thyroid hormone-related regulation of gene expression in human fatty liver. J Clin Endocrinol Metab 2009; 94:3521-9; PMID:19549744; http://dx.doi.org/10.1210/jc.2009-0212
- Misu H, Takamura T, Takayama H, Hayashi H, Matsuzawa-Nagata N, Kurita S, Ishikura K, Ando H, Takeshita Y, Ota T, et al. A liver-derived secretory protein, selenoprotein P, causes insulin resistance. Cell Metab 2010; 12:483-95; PMID:21035759; http://dx.doi.org/10.1016/j.cmet.2010.09.015
- Rudovich NN, Rochlitz HJ, Pfeiffer AF. Reduced hepatic insulin extraction in response to gastric inhibitory polypeptide compensates for reduced insulin secretion in normal-weight and normal glucose tolerant first-degree relatives of type 2 diabetic patients. Diabetes 2004; 53:2359-65; PMID:15331546; http://dx.doi.org/10.2337/diabetes.53.9.2359
- Pivovarova O, Bernigau W, Bobbert T, Isken F, Mohlig M, Spranger J, Weickert MO, Osterhoff M, Pfeiffer AF, Rudovich N. Hepatic insulin clearance is closely related to metabolic syndrome components. Diabetes Care 2013; 36:3779-85; PMID:24026549; http://dx.doi.org/10.2337/dc12-1203
- Fawcett J, Sang H, Permana PA, Levy JL, Duckworth WC. Insulin metabolism in human adipocytes from subcutaneous and visceral depots. Biochem Biophys Res Commun 2010; 402:762-6; PMID:21036154; http://dx.doi.org/10.1016/j.bbrc.2010.10.104
- Pivovarova O, Gogebakan O, Pfeiffer AF, Rudovich N. Glucose inhibits the insulin-induced activation of the insulin-degrading enzyme in HepG2 cells. Diabetologia 2009; 52:1656-64; PMID:19396426; http://dx.doi.org/10.1007/s00125-009-1350-7
- Epting CL, King FW, Pedersen A, Zaman J, Ritner C, Bernstein HS. Stem cell antigen-1 localizes to lipid microdomains and associates with insulin degrading enzyme in skeletal myoblasts. J Cell Physiol 2008; 217:250-60; PMID:18506847; http://dx.doi.org/10.1002/jcp.21500
- Alves da Costa C, Sunyach C, Pardossi-Piquard R, Sevalle J, Vincent B, Boyer N, Kawarai T, Girardot N, St George-Hyslop P, Checler F. Presenilin-dependent gamma-secretase-mediated control of p53-associated cell death in Alzheimer's disease. J Neurosci 2006; 26:6377-85; PMID:16763046; http://dx.doi.org/10.1523/JNEUROSCI.0651-06.2006
- Bennett RG, Hamel FG, Duckworth WC. An insulin-degrading enzyme inhibitor decreases amylin degradation, increases amylin-induced cytotoxicity, and increases amyloid formation in insulinoma cell cultures. Diabetes 2003; 52:2315-20; PMID:12941771; http://dx.doi.org/10.2337/diabetes.52.9.2315
- Fawcett J, Permana PA, Levy JL, Duckworth WC. Regulation of protein degradation by insulin-degrading enzyme: analysis by small interfering RNA-mediated gene silencing. Arch Biochem Biophys 2007; 468:128-33; PMID:17964527; http://dx.doi.org/10.1016/j.abb.2007.09.019
- Docke S, Lock JF, Birkenfeld AL, Hoppe S, Lieske S, Rieger A, Raschzok N, Sauer IM, Florian S, Osterhoff MA, et al. Elevated hepatic chemerin mRNA expression in human non-alcoholic fatty liver disease. Eur J Endocrinol 2013; 169:547-57; PMID:23935128; http://dx.doi.org/10.1530/EJE-13-0112
- American Diabetes A. Diagnosis and classification of diabetes mellitus. Diabetes care 2010; 33 Suppl 1:S62-9.
- Schurmann C, Heim K, Schillert A, Blankenberg S, Carstensen M, Dorr M, Endlich K, Felix SB, Gieger C, Grallert H, et al. Analyzing illumina gene expression microarray data from different tissues: methodological aspects of data analysis in the metaxpress consortium. PloS one 2012; 7:e50938; PMID:23236413; http://dx.doi.org/10.1371/journal.pone.0050938
- Gentleman R, Carey V, Dudoit S, Irizarry R, Huber W. Limma: linear models for microarray data. New York, Springer, 2005.
- Benjamini Y, Hochberg Y. Controlling the False Discovery Rate - a Practical and Powerful Approach to Multiple Testing. J Roy Stat Soc B Met 1995; 57:289-300.
- Pivovarova O, Jurchott K, Rudovich N, Hornemann S, Lu Y, Mockel S, Murahovschi V, Kessler K, Seltmann AC, Maser-Gluth C, et al. Changes of dietary fat and carbohydrate content alter central and peripheral clock in humans. J Clin Endocrinol Metab 2015:jc20143868; PMID:25822100.