
Abstract
Although cellular senescence is accompanied by global alterations in genome architecture, how the genome is restructured during the senescent processes is not well understood. Here, we show that the hCAP-H2 subunit of the condensin II complex exists as either a full-length protein or an N-terminus truncated variant (ΔN). While the full-length hCAP-H2 associates with mitotic chromosomes, the ΔN variant exists as an insoluble nuclear structure. When overexpressed, both hCAP-H2 isoforms assemble this nuclear architecture and induce senescence-associated heterochromatic foci (SAHF). The hCAP-H2ΔN protein accumulates as cells approach senescence, and hCAP-H2 knockdown inhibits oncogene-induced senescence. This study identifies a novel mechanism whereby condensin drives senescence via nuclear/genomic reorganization.
Abbreviations
| SAHF | = | senescence-associated heterochromatic foci |
| SADS | = | senescence-associated distension of satellites |
| SMC | = | structural maintenance of chromosomes |
| hCAP-H2 | = | human chromosome-associated protein H2 |
| NCAPH2 | = | non-SMC chromosome-associated protein H2 gene |
| RPE-1 | = | hTERT-immortalized retinal pigment epithelial cell line |
| hTERT | = | human telomerase reverse transcriptase |
| uORF | = | upstream open reading frame |
| BrdU | = | bromodeoxyuridine |
| SA-β-gal | = | senescence-associated β-galactosidase |
| Rb | = | retinoblastoma protein |
| CDK | = | cyclin dependent kinase |
| DAPI | = | 4,6-diamidino-2-phenylindole |
| shRNA | = | short-hairpin RNA. |
Introduction
Protein complexes consisting of structural maintenance of chromosomes (SMC) proteins are essential for the faithful segregation of chromosomes. Two of the best-studied SMC complexes are condensin and cohesin, which are required for mitotic chromosome assembly and for holding sister chromatids together, respectively.Citation1-3 These SMC complexes function as connectors between 2 chromatin fibers.Citation4 Recent studies have revealed that cohesin can mediate interactions between gene promoters and enhancers.Citation5 Condensin is also known to function in higher-order genome organization in yeast and is involved in the gene regulation in Caenorhabditis elegans.Citation6-9 Condensin I and II complexes exist in humans, where the condensin II complex binds to promoters and enhancers, and participates in gene regulation.Citation10,11 Therefore, condensin likely regulates gene expression in a variety of organisms through its role in higher-order genome organization.
Cellular senescence was originally defined by Hayflick, who demonstrated that normal human fibroblasts could not proliferate indefinitely, but reach their “Hayflick limit” and senesce.Citation12 Currently, cellular senescence is defined as the state of stable cell-cycle arrest caused by exhausting the capacity of DNA replication or by various cellular stresses including DNA damage, chemotherapeutic drug treatment, and excessive growth stimulus by overexpression of oncogenic Ras.Citation13,14 It is accompanied by diverse changes in gene expression and is associated with significant alterations in the global genome architecture.Citation15,16 Senescence-associated heterochromatin foci (SAHF) and senescence-associated distension of satellites (SADS) are characteristic of senescent cells.Citation17-19
Several chromatin factors including a histone H2A variant (macroH2A), histone chaperons (ASF1 and HIRA), and the High-Mobility Group A (HMGA) proteins are involved in SAHF formation during cellular senescence.Citation20,21 Lamin B1, a structural component of the nuclear lamina, has also been implicated in the senescent processes.Citation22 Since heterochromatic histone modifications such as H3 lysine 9 and 27 tri-methylation are dispensable for SAHF formation, heterochromatic histone marks are not entirely responsible for SAHF formation.Citation23 Senescence appears to be a cellular event orchestrated by numerous cellular factors, but how SAHF are assembled during senescence and contribute to the senescent processes remains unclear.
In this study, we have shown that 2 hCAP-H2 isoforms of the condensin II subunit exist in human cells. The relative expression of these hCAP-H2 isoforms is regulated during the cell cycle and upon starvation. We find that the small upstream open reading frame (uORF) plays a role in regulating the translation of the hCAP-H2 isoforms and that the N-terminus truncated variant, hCAP-H2ΔN, accumulates in quiescent and senescent cells. We show that hCAP-H2ΔN exists as a part of the insoluble nuclear architecture, while the full-length protein associates with mitotic chromosomes. Overexpression of this single condensin subunit, hCAP-H2, is sufficient to induce the formation of the condensin-mediated nuclear architecture and SAHF. This study demonstrates that the condensin II complex facilitates a nuclear/genomic reorganization leading to cellular senescence.
Results
Identification of 2 isoforms of hCAP-H2 condensin II subunit
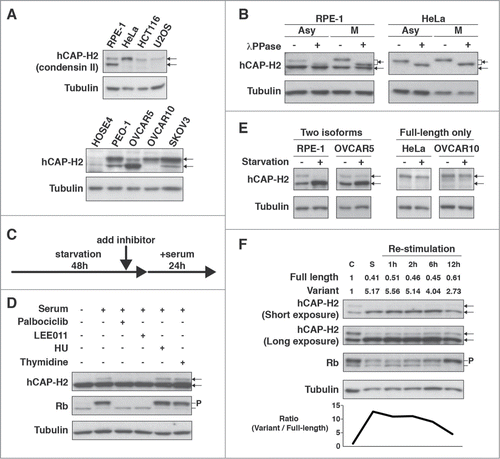
To understand how condensin expression is regulated in human cells, we investigated several components of the condensin I and II complexes in 3 cancer cell lines (HeLa, HCT116, and U2OS) and RPE-1 (hTERT-immortalized retinal pigment epithelial) cells, which exhibit a stable diploid karyotype and are therefore often used for chromosome research. We observed that SMC4 (SMC subunit) and hCAP-H (kleisin subunit of condensin I) proteins were less abundant in HCT116 cells (Fig. S1A). Unexpectedly, 2 different sizes of proteins (84 and 91 kDa) were detected by the hCAP-H2 antibody in RPE-1 cells, but not in the cancer cell lines (top panels in ). These two proteins were both depleted by the short-hairpin RNA (shRNA) directed against NCAPH2 transcripts, indicating that both proteins are derived from the NCAPH2 gene (Fig. S1B). Based on the protein sizes, the top and bottom bands represent the full-length hCAP-H2 and a smaller variant, respectively. Since the 3 cancer cell lines expressed only the full-length hCAP-H2, we investigated whether this is a common feature of cancer cells. While the 2 hCAP-H2 isoforms were detected in primary human ovarian surface epithelial cells (HOSE4), both were also detected in the ovarian cancer cell lines (PEO-1, OVCAR5, and SKOV3), suggesting that the absence of the bottom band is not necessarily indicative of cancer cells or their proliferative potential (bottom panels in ). For instance, the OVCAR5 and OVCAR10 cell lines had the different expression patterns of the hCAP-H2 isoforms, but showed similar rates of BrdU incorporation (; Fig. S1C). Moreover, retinoblastoma (Rb) tumor suppressor proteins were predominantly phosphorylated in both the RPE-1 and cancer cell lines (except for HeLa cells, where Rb was absent), indicating that the expression pattern of the 2 hCAP-H2 isoforms does not directly reflect cell proliferation (Fig. S1D and E).
Figure 1. Full-length hCAP-H2 and its variant detected in human cell lines. (A) hCAP-H2 proteins in RPE-1, HeLa (cervical cancer), HCT116 (colon cancer), U2OS (osteosarcoma), HOSE4, and ovarian cancer cell lines (PEO-1, OVCAR5, OVCAR10, and SKOV3) were assessed by immunoblot analysis. Arrows indicate the full-length hCAP-H2 and its smaller variant. Tubulin serves as a loading control. (B) Asynchronous (Asy) and mitotic (M) RPE-1 and HeLa cells were subjected to Western blot analysis to detect hCAP-H2 proteins. Mitotic cells were prepared by mitotic shake-off. Cell lysates were treated with lambda protein phosphatase (λPPase). (C) Schematic protocol for the inhibitor treatments employed in panel D. (D) RPE-1 cells grown in normal medium were subsequently cultured for 48 hours in starvation medium, which consists of 20 times less fetal bovine serum (FBS) than normal. CDK4/6 inhibitors (Palbociclib and LEE011), DNA replication inhibitors (HU and Thymidine), or DMSO (control) were added to starvation medium 2 hours before serum re-stimulation. Cells were further cultured for 24 hours in normal medium (serum +) containing the inhibitors, and lysates were subjected to immunoblot analysis. P indicates phosphorylated Rb proteins. (E) The indicated cell lines were cultured for 2 days in normal (starvation −) or starvation medium (starvation +), followed by Western blot analysis. (F) RPE-1 cells grown in normal medium (C, control) were subsequently cultured for 2 days in starvation medium (S, Starvation). After the starvation treatment, cells were further cultured in normal medium for the indicated periods of time (Re-stimulation). Cell lysates derived from the respective culturing steps were subjected to immunoblot analysis. Band intensities (top) and expression ratio (bottom) of the hCAP-H2 isoforms are shown.
Cell cycle-dependent regulation of hCAP-H2 isoforms
Next, we examined how expression of the hCAP-H2 isoforms is regulated during the cell cycle. We found that the full-length hCAP-H2 became more abundant in RPE-1 cells during mitosis compared to asynchronous cells, while the smaller hCAP-H2 variant was relatively decreased in mitotic cells (). In contrast, expression levels were similar between mitotic and asynchronous HeLa cells, where only the full-length hCAP-H2 was present. We also found that λPPase treatment converted the full-length hCAP-H2 from both asynchronous and mitotic cells to faster migrating bands (). Moreover, the full-length hCAP-H2 bands from mitotic RPE-1 and HeLa cells were located slightly above those from asynchronous cells (). These results indicate that hCAP-H2 is phosphorylated during interphase and additionally phosphorylated during mitosis (). Phosphorylation of hCAP-H2 during mitosis was previously reported.Citation24,25 A similar band shift was not detected for the smaller variant, indicating that the phosphorylation is specific to the full-length hCAP-H2 ().
We next performed serum re-stimulation assays with the CDK4/6 and DNA replication inhibitors (). Starvation treatment arrests the cell cycle during G1/G0 phase, and serum re-stimulation with the CDK4/6 and DNA replication inhibitors allows the cell cycle to synchronously progress until midG1 and S phases, respectively. In RPE-1 cells treated by the CDK4/6 inhibitors, the full-length hCAP-H2 was not detected, while it was detected in cells treated by the DNA replication inhibitors (). Furthermore, when the full-length hCAP-H2 was detected, Rb proteins were predominantly phosphorylated. These results suggest that the full-length hCAP-H2 accumulates between the midG1 and S phase, and that phosphorylation of Rb and accumulation of the full-length hCAP-H2 might be coordinated. Since the full-length hCAP-H2 is enriched during mitosis (), our current hypothesis is that full-length proteins translated around the midG1-S phase are likely sustained until mitosis. Alternatively, it is also possible that the stability of hCAP-H2 proteins is regulated during the cell cycle. Together, these results indicate that protein levels of the hCAP-H2 isoforms are regulated during the cell cycle.
Regulation of hCAP-H2 isoforms upon starvation
We observed that the hCAP-H2 variant was increased in RPE-1 and OVCAR5 cells after serum starvation, while the full-length protein was decreased (). In contrast, the full-length hCAP-H2 was not affected by the starvation treatment in the HeLa and OVCAR10 cell lines, which contained only the full-length protein (). In addition, re-stimulation of cell growth after the starvation treatment gradually increased and decreased the full-length hCAP-H2 and its variant, respectively, and an increase in Rb phosphorylation was evident (). These results suggest that when both of the hCAP-H2 isoforms are present, cell proliferation is associated with an increase of the full-length hCAP-H2 and a reduction of the variant, although the basal expression pattern of the isoforms does not directly represent cell proliferation and is dependent upon cell lines (). We also observed that NCAPH2 gene transcription was not affected by the starvation treatment in RPE-1 cells (Fig. S1F). These results indicate that expression of the hCAP-H2 isoforms is regulated upon starvation in a post-transcriptional manner, and that the variant accumulates in quiescent cells induced by starvation.
Regulatory role of the uORF in translation of hCAP-H2 isoforms
The mouse Ncaph2 gene is known to produce splicing variants.Citation26 Therefore, we hypothesized that alternative splicing might be responsible for the synthesis of the hCAP-H2 protein isoforms. However, we did not observe splicing variants of NCAPH2 in RPE-1 and HeLa cells, indicating that the hCAP-H2 variant protein is not derived from alternative splicing (Fig. S2A).
Small upstream open reading frames (uORFs) have been identified in about half of human transcripts and are known to control the translation of downstream ORFs.Citation27,28 A uORF is present in the NCAPH2 mRNA and is conserved among mammalian species ().Citation26 NetStart software predicts that hCAP-H2 translation initiates from the first (AUG1) and second (AUG2) start codons ().Citation29 We hypothesized that the uORF might regulate translational initiation from the 2 start codons. To test this hypothesis, we made several constructs and observed that the wild-type construct expressed the 2 hCAP-H2 isoforms (). The size difference between these 2 proteins was 7 kDa, which is exactly the same as for the endogenous hCAP-H2 isoforms (). In contrast, the ΔuAUG mutation that prevents translation of the uORF inhibited the production of the smaller protein. The ΔAUG1 mutation, which removes the first start codon, resulted in the expression of only the smaller protein. The ΔAUG2 mutation prevented the production of the smaller protein, and it resulted in the expression of an additional, even smaller protein, suggesting that there is an additional potential translational start site downstream of the second start codon. These results indicate that the translation of the larger and smaller proteins are initiated from the AUG1 and AUG2 codons, respectively, and that the uORF is required for efficient translational initiation from the AUG2 start codon. Small uORFs are known to modulate translation of the downstream ORFs through a reinitiation mechanism.Citation30 It has recently been shown that the NIPBL gene encoding a cohesin loading factor has an uORF, which regulates NIPBL translation in a cell cycle-dependent manner.Citation31 Therefore, it is possible that the uORF in the NCAPH2 gene might contribute to the observed regulation of the hCAP-H2 isoforms during the cell cycle ().
Figure 2. Role of the uORF in expression of the hCAP-H2ΔN variant. (A) The nucleotide sequence of the 5′ region of NCAPH2 mRNA. The small upstream ORF (uORF) contains start codon (uAUG, red) and stop codon (UGA, blue). The first AUG (AUG1) and second AUG (AUG2), responsible for translational initiation of hCAP-H2, are also highlighted in red. (B) Prediction of translational start sites for hCAP-H2. The NetStart 1.0 server was used for a prediction of translation start. Probability of translational initiation is scored between 0 and 1, and more than 0.5 represents typical start sites. (C) Schematic representation of the NCAPH2 constructs (wild type, ΔuAUG, ΔAUG1, and ΔAUG2). Expression of hCAP-H2 proteins fused to EYFP is under control of the CMV promoter. The mutated start codons are shown in red. (D) The NCAPH2 constructs shown in panel C were transfected into RPE-1 cells. Negative control (N.C.) indicates no transfection. hCAP-H2 proteins fused to EYFP were detected by Western blotting using hCAP-H2 antibody. An asterisk indicates an additional band observed in cells carrying the ΔAUG2 construct. (E) The full-length NCAPH2 (FL) and ΔN genes starting from the AUG1 and AUG2 codons, respectively, were cloned into pCMV6-Entry plasmids and expressed in RPE-1 cells. N.C. indicates RPE-1 cells without exogenous expression of the NCAPH2 genes. Cell lysates from RPE-1 and HeLa cells were subjected to immunoblot analysis. (F) Co-IP analysis testing the interaction between hCAP-H2 (FL, ΔN, and ΔC) and the other components of the condensin complex. hCAP-H2ΔC lacks the 130 a.a. of the hCAP-H2 C-terminus. Expression of Flag-tagged hCAP-H2 proteins was induced by doxycycline (Materials and Methods).
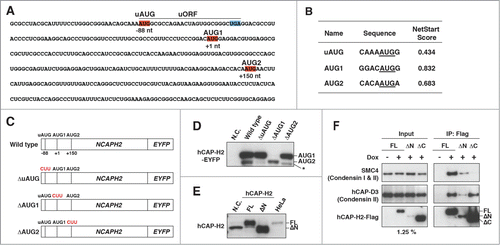
We next expressed non-tagged full-length hCAP-H2 and ΔN proteins from plasmids in RPE-1 cells and compared the sizes of these proteins to the endogenous hCAP-H2 isoforms (). In this system, the translation of the exogenous full-length hCAP-H2 and ΔN variant is initiated from the AUG1 and AUG2 start codons, respectively. We observed that the size of the exogenous full-length hCAP-H2 was similar to the endogenous counterpart in HeLa cells (). In addition, the size of the ΔN protein was similar to the endogenous hCAP-H2 variant in RPE-1 cells. These results collectively suggest that the translation of the full-length hCAP-H2 and ΔN variant is initiated from the AUG1 and AUG2 start codons and regulated by the uORF.
hCAP-H2 isoforms exist in the condensin complex
The kleisin subunits of the SMC complexes are conserved from bacteria to humans and consist of the winged-helix motifs at their N- and C-terminal domains.Citation32,33 The N-terminal winged-helix motif of hCAP-H2 was highly conserved among vertebrates and homologous to the kleisin subunits of the condensin I complex (Fig. S2B and C). The methionine encoded by the second start codon (AUG2) was positioned just before the third helix within the winged-helix motif (Fig. S2C and D). Since the hCAP-H2ΔN lacks a part of the conserved winged-helix domain (Fig. S2D), we tested whether the ΔN protein can form the condensin complex. We found that both the full-length hCAP-H2 and ΔN variant interacted with the other condensin II subunits such as SMC4 and hCAP-D3 (). As a negative control, we expressed the hCAP-H2ΔC protein, which is known to be defective in the interaction between hCAP-H2 and SMC4, and found that ΔC proteins were completely deficient for the interaction ( and S2D).Citation34 These results suggest that the N-terminal region (50 a.a.) missing in hCAP-H2ΔN is likely dispensable for the formation of the condensin II complex. In support of this notion, it has been shown that the third helix within the winged-helix motif of the Scc1 kleisin subunit of cohesin is important for its binding to the Smc1 subunit.Citation35
hCAP-H2 isoforms induce DAPI-dense chromatin foci
Remarkably, DAPI-dense chromatin foci were formed in RPE-1 cells expressing EYFP-tagged full-length hCAP-H2, although EYFP alone did not induce the formation of DAPI-dense foci (Fig. S3A). We also observed that DAPI-dense chromatin foci were formed in 45% and 41% of RPE-1 cells expressing the full-length hCAP-H2 and ΔN variant, respectively, but DAPI-dense chromatin foci were formed in only 1% of cells expressing the hCAP-H condensin I subunit (). Because the expression levels of hCAP-H and H2 proteins were comparable, it is likely that DAPI-dense foci are specifically induced by hCAP-H2 rather than by an artifact from protein overexpression.
Figure 3. Overexpression of hCAP-H2 induces formation of DAPI-dense chromatin foci. (A) hCAP-H and hCAP-H2 (FL and ΔN) proteins fused to the Flag epitope were expressed in RPE-1 cells for 2 days and visualized by IF analysis. Scale bar indicates 10 µm. (B) Histone H3 di- and tri-methylated Lys9 were visualized by IF in RPE-1 cells expressing the full-length hCAP-H2. Inset shows enlarged views. Scale bar indicates 5 µm. (C) hCAP-H2 (FL and ΔN) proteins fused to the Flag epitope were expressed in RPE-1 cells and visualized by IF. These microscopic images, at a relatively high resolution, were captured by a Leica SP5 II laser scanning confocal microscope. Scale bar indicates 1 µm. (D) Chromatin-unbound (Fr. 1), DNase-extractable (Fr. 2), high salt-extractable (Fr. 3), and high salt-resistant (Fr. 4) fractions were prepared from asynchronous (Asy) and mitotic (M) RPE-1 cells (See Materials and Methods) and subjected to Western blotting. WCL indicates whole cell lysate. (E and F) The same fractionation was performed using RPE-1 cells expressing Flag-tagged hCAP-H2 proteins (FL and ΔN). The fractions were subjected to immuno blotting (E). The high salt-resistant fraction was further applied for IF analysis to co-visualize hCAP-H2 and lamin A/C proteins (F). Scale bar indicates 5 µm. (G) RPE-1 cells were transfected with plasmids encoding EYFP-tagged hCAP-H2 proteins (FL and ΔN) and culture for 2 days. Cells were subjected to IF analysis to stain CENP-B proteins, which bind to centromeric satellites. RPE-1 cells were infected with a retrovirus encoding H-RasV12 (Ras) or a control virus without H-RasV12 (Con) and subjected to IF analysis 8 days after the infection. Scale bar indicates 5 µm.
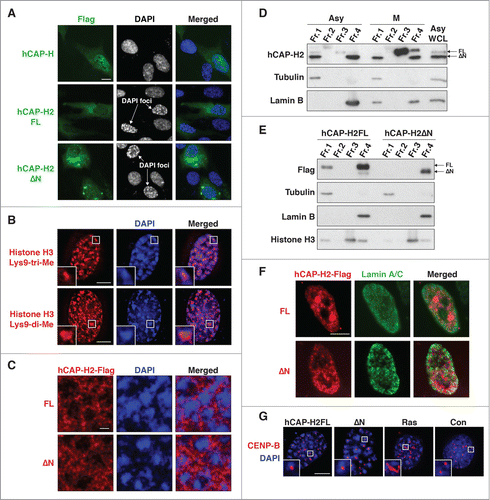
Since DAPI-dense foci are reminiscent of senescence-associated heterochromatic foci (SAHF), we asked whether DAPI-dense foci we observed have the same characteristics as SAHF. We observed that DAPI-dense foci associated with histone H3 di- and tri-methylated Lys9, which are heterochromatic epigenetic marks (). As previously reported, H3 tri-methylated Lys9 was located at the center of SAHF, while di-methylated Lys9 was more enriched near the surface of SAHF (). Histone H3 tri-methylated Lys9 was more scattered in the nuclei without DAPI-dense foci (Fig. S3B).Citation23 In contrast, histone H3 di/tri-methylated Lys4 (euchromatic mark) was present outside of the DAPI-dense foci, consistent with the previous observation (Fig. S3C).Citation17 These results indicate that DAPI-dense chromatin foci induced by expression of the hCAP-H2 isoforms have charateristics of SAHF.
hCAP-H2ΔN exists as a part of the insoluble nuclear architecture
To begin to understand the roles of the hCAP-H2 isoforms in the formation of DAPI-dense foci, we visualized these proteins and found that they were localized to the intervening region surrounding DAPI-dense foci (). To further characterize hCAP-H2 localization, we performed cellular fractionation analysis (See Materials and Methods) and found that endogenous hCAP-H2ΔN proteins were enriched in the insoluble fraction (fraction 4) in both asynchronous and mitotic cells (). This insoluble fraction is also referred to as a nuclear matrix. The full-length hCAP-H2, but not the ΔN variant, was found in the high salt-extractable fraction (fraction 3) during mitosis. Proteins tightly bound to DNA are mainly enriched in fraction 3. This result indicates that the condensin II complex containing the full-length hCAP-H2 preferentially interacts with mitotic chromosomes to mediate chromosome compaction,Citation36,37 while the complex with the ΔN variant exists as a part of the insoluble nuclear architecture. As a control, we observed that tubulin was enriched in the chromatin-unbound soluble fraction 1, while lamin B was detected in fraction 4. Since this fractionation analysis monitors hCAP-H2 proteins without overexpression, it is likely that the endogenous hCAP-H2 isoforms have distinct functions in chromosome compaction and the nuclear architecture.
Exogenous full-length hCAP-H2 and ΔN proteins highly expressed from plasmids as well as endogenous lamin B proteins were enriched in fraction 4, while histone H3 proteins were mainly detected in fraction 3 (). When fraction 4 was subjected to IF analysis to visualize the hCAP-H2 isoforms, we observed that these proteins and lamin A/C were associated with the nucleus (). These results demonstrate that, when overexpressed, both the hCAP-H2 isoforms exist as a part of the nuclear architecture. This is consistent with previous observations that several components of the condensin II complex are present in the nuclear matrix.Citation38
Since senescence-associated distension of satellites (SADS), which occurs during the senescence process, is a more consistent phenomenon in human and mouse cells than SAHF,Citation18 we investigated whether the expression of the hCAP-H2 isoforms triggers SADS. To visualize SADS, we performed CENP-B staining, which specifically visualizes centromeric satellites and has previously been used for detection of SADS.Citation18 Consistent with the previous finding, 45% of RPE-1 cells showed SADS at the late senescent phase (day 8) when oncogenic Ras was expressed (). On the other hand, expression of the hCAP-H2 isoforms induced DAPI-dense chromatin foci 2 days after transfection, but 0% of the cells showed SADS at the same time point (). This result suggests that overexpression of the hCAP-H2 isoforms can cause the formation of DAPI-dense chromatin foci, likely SAHF, without SADS. Together, these results suggest that overexpressed hCAP-H2 proteins facilitate the formation of the condensin-associated insoluble nuclear architecture and SAHF.
hCAP-H2 functions in cellular senescence
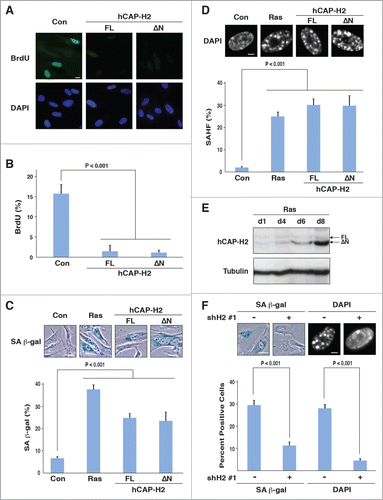
To investigate whether hCAP-H2 plays a role in cellular senescence, we expressed the hCAP-H2 isoforms in IMR90 human fibroblasts, which are commonly used for senescence research. Overexpression of the full-length hCAP-H2 and ΔN variant induced senescence, as indicated by decrease in BrdU incorporation (cell cycle/growth marker), senescence-associated β-galactosidase (SA-β-gal) staining, and SAHF formation, all of which were statistically significant (P < 0.001; ). We also observed that hCAP-H2ΔN expression was increased during senescence induced by oncogenic Ras (). Moreover, Ras-induced senescence was significantly impaired by hCAP-H2 knockdown using shH2#1, as indicated by the reduced percentages of cells positive for SA-β-gal activity and SAHF formation (P < 0.001; ). hCAP-H2 knockdown using 2 different shRNAs (shH2#2 and #3) also inhibited Ras-induced senescence (Fig. S3D and E). These results collectively indicate that the condensin II complex functions during oncogene-induced senescence, and that the complex with the ΔN variant likely participates in the senescent process.
Figure 4. hCAP-H2 facilitates cellular senescence. (A and B) IMR90 cells were infected with retroviruses encoding the full-length hCAP-H2 or ΔN variant, or a control virus without encoding these proteins. BrdU incorporation and visualization were performed 8 days after the infection (A). Scale bar indicates 10 µm. Percentages of IMR90 cells showing BrdU staining were scored 8 days after retrovirus infection (B). (C and D) IMR90 cells were infected by retroviruses encoding the H-RasV12, full-length hCAP-H2, or ΔN variant, or a control virus, and subjected to SA-β-gal staining 8 days after the infection (C). Infected cells were stained by DAPI to assess SAHF formation (D). Scale bars in panels C and D indicate 50 µm and 5 µm, respectively. (E) hCAP-H2 levels were monitored from day 1 (d1) to day 8 (d8), after IMR90 cells were infected with a retrovirus encoding H-RasV12. Tubulin serves as a loading control. (F) IMR90 cells were infected with a retrovirus encoding H-RasV12 as well as a lentivirus encoding shRNA against NCAPH2 mRNA (shH2#1), and assessed for SA-β-gal activity and SAHF formation 8 days after the infection. Scale bars indicate 50 (left) and 5 µm (right).
Discussion
While there are the 2 hCAP-H2 isoforms present in the non-cancerous cell lines (RPE-1 and HOSE4), some cancer cell lines contain only the full-length protein, suggesting that the presence of the 2 isoforms is likely the normal situation for growing cells. We show that expression of the 2 hCAP-H2 isoforms is modulated during the cell cycle and upon starvation, and that the uORF plays a regulatory role in the translation of the hCAP-H2 isoforms. We also find that the condensin II complex containing the full-length hCAP-H2 preferentially associates with mitotic chromosomes to mediate chromosome compaction, while the complex with the ΔN variant exists as a component of the insoluble nuclear architecture (). Only the hCAP-H2ΔN variant is accumulated in quiescent and senescent cells induced by starvation and oncogenic Ras, respectively (). This makes sense because these cells do not progress through mitosis and thus do not need the full-length isoform to induce chromosome compaction. Therefore, non-growing cells express the ΔN variant, which contributes to the formation of a nuclear environment favorable for growth arrest.
When overexpressed, both of the hCAP-H2 isoforms associate with the specific nuclear architecture and induce DAPI-dense chromatin foci (). We also show that the protein level of the endogenous hCAP-H2ΔN variant is increased as cells approach senescence, and that hCAP-H2 knockdown inhibits SAHF formation and oncogene-induced senescence (). Taken all together, our current hypothesis is that the specific nuclear architecture built by the condensin II complex containing the ΔN variant promotes SAHF formation, which in turn facilitates senescence. It has recently been shown that lamin B1 knockdown induces dissociation of heterochromatin from the nuclear periphery and SAHF formation.Citation39 Therefore, the lamina and the condensin-mediated nuclear architectures likely play opposing roles in SAHF formation. Consequently, overexpression of hCAP-H2 might be necessary to induce SAHF in the presence of the nuclear lamina. In case of senescence induced by oncogenic Ras, lamin B1 is down-regulated, and hCAP-H2ΔN expression is enhanced ().Citation22
We also found that the Rb tumor suppressor associates with the nuclear architecture assembled by the condensin II complex (Fig. S3F). Interestingly, Rb foci were almost always detected at the surface of the condensin architecture and outside of DAPI-dense signals. It has previously been shown that Rb interacts with the hCAP-D3 subunit of the condensin II complex in human cells.Citation40 Therefore, Rb associates with the condensin II nuclear architecture likely through the interaction between Rb and hCAP-D3. Consistent with this interpretation, Rb is known to be present in the insoluble nuclear fraction.Citation41 It has also been shown that Rb binds to and represses E2F-target genes, thereby contributing to cellular senescence.Citation17 Based on these results, we speculate that Rb associates the E2F-targtet genes with the condensin II nuclear architecture, which might play a role in the gene repression for the E2F-target genes. As a similar example, SATB1 forms a nuclear architecture in mouse cells and regulates many genes by tethering those genes to the SATB1 nuclear architecture.Citation42 Since senescence is accompanied by altered expression of many genes,Citation15,16 the condensin-mediated nuclear architecture might contribute to the gene expression program during senescent processes.
Materials and Methods
Cell culture
RPE-1 cells (ATCC) were cultured in DMEM/F12 medium (Life Technologies, 11330032) supplemented with 10% tet-system approved fetal bovine serum (FBS; Clontech Laboratories, 631106), 100 U/ml penicillin, 100 μg/ml streptomycin, and 0.01 mg/ml hygromycin B. HeLa, HCT116, and U2OS cells were cultured in DMEM medium (Mediatech, MT10-013-CV) supplemented with 10% FBS, 100 U/ml penicillin, and 100 μg/ml streptomycin. PEO-1, OVCAR5, OVCAR10, and SKOV3 cells were cultured in RPMI1640 medium (Life Technologies, 22400089) supplemented with 10% FBS, 100 U/ml penicillin, and 100 μg/ml streptomycin. HOSE4 cells were cultured as previously described.Citation43 IMR90 cells were cultured in DMEM medium supplemented with 10% FBS, 100 U/ml penicillin, 100 μg/ml streptomycin, 0.15% sodium bicarbonate, 2 mM L-glutamine, 1 mM sodium pyruvate, and 1 × MEM non-essential amino acids (Life Technologies, 11120052).
Expression of hCAP-H2 and its variants
NCAPH2 cDNA in pCMV6-Entry vector (OriGene) was used to generate the NCAPH2ΔN and ΔC genes by a PCR-based method. hCAP-H2 (full length, ΔN, and ΔC) proteins fused to the Flag epitope were expressed from either pCMV6-Entry or pTRE3G plasmids (Clontech Laboratories). For co-immunoprecipitation (co-IP) assay, pTRE3G plasmids carrying NCAPH2 (full length, ΔN, or ΔC) and pCMV-Tet3G were co-transected into cells, and NCAPH2 expression was induced by 1 µg/ml doxycycline for 48 hours. hCAP-H2 (full length and ΔN) proteins fused to EYFP were expressed from pEYFP-N1 plasmids (Clontech Laboratories). Cells were transfected with plasmids using the Fugene HD reagent (Promega, E2311).
Retrovirus and lentivirus infections
DNA fragments encoding hCAP-H2 (full length and ΔN) fused to the Flag epitope were inserted into pBABE-neo vector.Citation20 pBABE-neo plasmids carrying either H-rasV12, NCAPH2, or NCAPH2ΔN were used for retrovirus packaging, and virus infection was performed as described previously.Citation20 Cells were cultured with selection medium containing 500 µg/ml G418. pTRIPZ plasmid containing NCAPH2 shRNA (Thermo Scientific Open Biosystems) was used for lentivirus production. Doxycycline (1 µg/ml) was added to culture medium every 48 hours for shRNA expression. Cells were cultured in medium containing 3 µg/ml puromycin.
Senescence-associated β-galactosidase (SA-β-gal) and BrdU assays
SA-β-gal staining was performed as described previously.Citation44 For BrdU incorporation experiments, cells were plated on coverslips and labeled with 100 µg/ml 5-Bromo-2′-deoxyuridine (BrdU, Sigma-Aldrich, B5002) for 30 minutes. The cells were fixed by 4% paraformaldehyde (pFA) for 15 minutes and permeabilized by PBS buffer containing 0.2% Triton X-100. The cells were further fixed for 30 minutes by 1% pFA in PBS buffer containing 0.01% Tween-20 and treated with 5 units of RQ1 RNase-free DNase I (Promega, M6101) or 2 N HCl. The cells were then incubated with 1:10-diluted FITC-labeled mouse monoclonal anti-BrdU (BD Biosciences, 556028) for 30 minutes. Nuclei were stained with 1 µg/ml 4,6-diamidino-2-phenylindole (DAPI) solution for 5 minutes.
Fractionation analysis
Fractionation analysis was performed as previously described with slight modifications.Citation45 Cells were lysed at 4°C for 30 minutes with 400 µl CSK buffer [10 mM PIPES (pH 6.8), 100 mM NaCl, 300 mM sucrose, 3 mM MgCl2, 1 mM EGTA, 1 mM DTT, 0.25 mM PMSF, 10 mM NaF, 0.1 mM ATP, and Complete protease inhibitor cocktail (Roche, 11836170001)] containing 0.3% Triton X-100. Soluble fraction (fraction 1, chromatin-unbound fraction) and insoluble fraction were separated by centrifugation at 2,300 × g for 10 minutes. The insoluble fraction was incubated with 100 units of RQ1 RNase-free DNase I at room temperature for 30 minutes. After centrifugation at 16,000 × g for 10 minutes, the supernatant was recovered as fraction 2 (DNase-extractable fraction). The pellet was then suspended in 200 µl CSK buffer containing 0.3% Triton X-100 and 2 M NaCl, and the suspension was rotated at 4°C for 30 minutes. After centrifugation at 16,000 × g for 10 minutes, the supernatant was recovered as fraction 3 (high salt-extractable fraction), and the pellet was boiled with 50 µl Laemmli sample buffer (fraction 4, high salt-resistant fraction).
Western blotting
Cells were suspended with Laemmli sample buffer (Bio-Rad Laboratories, 1610737) and boiled at 100°C for 5 minutes. Primary antibodies used in this study were the following: 1:1000-diluted rabbit polyclonal anti-SMC4 (Abcam, ab17958), 1:2000-diluted rabbit polyclonal anti-hCAP-H (Sigma-Aldrich, HPA003008), 1:500-diluted rabbit polyclonal anti-hCAP-H2 (Abgent, AP1973A), 1:200-diluted mouse monoclonal anti-hCAP-D2 (Santa Cruz Biotechnology, sc-166878), 1:1000-diluted rabbit polyclonal anti-hCAP-D3 (Abcam, ab70349), 1:2000-diluted mouse monoclonal anti-hCAP-G (Novus Biologicals, H00064151-M01), 1:1000-diluted mouse monoclonal anti-Rb (Cell Signaling Technology, #9309), 1:500-diluted goat polyclonal anti-Lamin B (Santa Cruz Biotechnology, sc-6217), 1:20000-diluted mouse monoclonal anti-α-tubulin (Sigma-Aldrich, T6199), 1:1000-diluted mouse monoclonal anti-Flag (Sigma-Aldrich, F1804), and 1:2000-diluted rabbit monoclonal anti-histone H3 (Cell Signaling Technology, #4499). Secondary antibodies, such as horseradish peroxidase (HRP)-conjugated sheep anti-mouse IgG, HRP-conjugated donkey anti-rabbit IgG (GE Healthcare, NA931, NA934), and HRP-conjugated rabbit anti-goat IgG (Kirkegaard & Perry Laboratories, 14-13-06), were used for detection of target proteins by ECL or ECL plus kits (GE Healthcare, RPN2109, RPN2133).
Immunoprecipitation
Cells were suspended in 1 ml IP buffer [50 mM HEPES (pH 7.6), 75 mM KCl, 0.1% NP-40, 20% Glycerol, 1 mM EDTA, 10 mM NaF, 10 mM β-glycerophosphate, and Complete protease inhibitor cocktail]. Cell lysate was mixed with MgCl2 (final 5 mM) and 50 units of RQ1 RNase-free DNase I were added. DNase I reaction was performed at 37°C for 30 minutes and terminated by adding EDTA (final 10 mM). Soluble fraction of the cell lysate was incubated with anti-Flag M2 magnetic beads (Sigma-Aldrich, M8823). The beads were washed with 400 μl of IP buffer 5 times and boiled with 20 μl Laemmli sample buffer to elute proteins.
Immunofluorescence microscopy
Cells plated on coverslips were fixed with 2% pFA for 15 minutes. Fixed cells were permeabilized with PBS containing 0.5% Triton X-100 for 5 minutes and incubated with TBST (Tris-buffered saline plus 0.1% Tween-20) containing 1% BSA for 1 hour. Cells were then incubated for 1 hour with primary antibodies: 1:200-diluted mouse or rat monoclonal anti-Flag (Agilent Technologies, 200471, 200473), 1:500-diluted mouse monoclonal anti-histone H3 di-methyl Lys9 (Abcam, ab1220), 1:1000-diluted rabbit polyclonal anti-histone H3 tri-methyl Lys9 (Abcam, ab8898), 1:200-diluted mouse monoclonal anti-histone H3 di/tri-methyl Lys4 (Abcam, ab6000), 1:1000-diluted rabbit polyclonal anti-CENPB (Abcam, ab25734), 1:200-diluted rabbit polyclonal anti-lamin A/C (Cell Signaling Technology, #2032), and 1:200-diluted mouse monoclonal anti-Rb (Cell Signaling Technology). Cells were subsequently incubated for 1 hour with secondary antibodies, such as 1:500-diluted Alexa Flour 488-conjugated anti-mouse IgG, 1:400-diluted Alexa Flour 594-conjugated anti-mouse IgG, 1:400-diluted Alexa Flour 594-conjugated anti-rat IgG, 1:400-diluted Alexa Flour 488-conjugated anti-rabbit IgG, 1:400-diluted Alexa Flour 594-conjugated anti-rabbit IgG, and 1:4000-diluted Cy3-conjugated anti-rabbit IgG. Nuclei were stained with 1 µg/ml DAPI solution for 5 minutes. Immunofluorescent (IF) images were captured by a Zeiss Axioimager Z1 fluorescence microscope with an oil immersion objective lens (Plan Apochromat, 63×, NA 1.4, Zeiss), unless otherwise indicated. The images were acquired at 0.2 µm intervals in the z-axis controlled by Axiovision 4.6.3 software (Zeiss). To visualize hCAP-H2 and lamin A/C proteins in fraction 4, cells attached to coverslips were treated by CSK buffer, DNase I, and 2 M NaCl, as described in the fractionation procedure. The cells were then fixed by 2% pFA, followed by the same IF procedure.
RT-PCR and qRT-PCR
RNA was extracted from human cells using RNeasy Plus Mini Kit (Qiagen, 74134). RNA samples were subjected to RT-PCR using onestep RT-PCR kit (Qiagen, 210212) or SYBR green one-step kit (Bio-Rad, 172-5151). Alternatively, RNA samples were subjected to cDNA synthesis using high-capacity cDNA reverse transcription kit (Life Technologies, 4368814), followed by qPCR analysis using SYBR green qPCR kit (Sigma-Aldrich, KCQS00). Primer sequences are indicated in Table S1.
Disclosure of Potential Conflicts of Interest
No potential conflicts of interest were disclosed.
1049778_supplemental_files.docx
Download MS Word (1.3 MB)Acknowledgments
We would like to thank Meenhard Herlyn, Kazuko Nishikura, Ashani Weeraratna, and Susan Janicki for experimental materials; the Wistar Institute Molecular Screening Facility for lentivirus preparation; and the Imaging Facility for microscopic analysis. We also thank Maureen Murphy, Michael Showe, and Louise Showe for critically reading the manuscript and Sylvie Shaffer for editorial assistance.
Funding
This work was supported by the National Institutes of Health (NIH) grant CA010815, the W. W. Smith Charitable Trust, the V Foundation, the Edward Mallinckrodt, Jr. Foundation, and the Wistar Pilot Project Funds to KN.
Related Research Data
References
- Koshland D, Strunnikov A. Mitotic chromosome condensation. Annu Rev Cell Dev Biol 1996; 12:305-33; PMID:8970729; http://dx.doi.org/10.1146/annurev.cellbio.12.1.305
- Hirano T. Chromosome cohesion, condensation, and separation. Annu Rev Biochem 2000; 69:115-44; PMID:10966455; http://dx.doi.org/10.1146/annurev.biochem.69.1.115
- Nasmyth K, Haering CH. The structure and function of SMC and kleisin complexes. Annu Rev Biochem 2005; 74:595-648; PMID:15952899; http://dx.doi.org/10.1146/annurev.biochem.74.082803.133219
- Hirano T. At the heart of the chromosome: SMC proteins in action. Nat Rev Mol Cell Biol 2006; 7:311-22; PMID:16633335; http://dx.doi.org/10.1038/nrm1909
- Kagey MH, Newman JJ, Bilodeau S, Zhan Y, Orlando DA, van Berkum NL, Ebmeier CC, Goossens J, Rahl PB, Levine SS, et al. Mediator and cohesin connect gene expression and chromatin architecture. Nature 2010; 467:430-5; PMID:20720539; http://dx.doi.org/10.1038/nature09380
- Chuang PT, Albertson DG, Meyer BJ. DPY-27: A chromosome condensation protein homolog that regulates C. elegans dosage compensation through association with the X chromosome. Cell 1994; 79:459-74; PMID:7954812; http://dx.doi.org/10.1016/0092-8674(94)90255-0
- Haeusler RA, Pratt-Hyatt M, Good PD, Gipson TA, Engelke DR. Clustering of yeast tRNA genes is mediated by specific association of condensin with tRNA gene transcription complexes. Genes Dev 2008; 22:2204-14; PMID:18708579; http://dx.doi.org/10.1101/gad.1675908
- Iwasaki O, Tanaka A, Tanizawa H, Grewal SIS, Noma KI. Centromeric localization of dispersed Pol III genes in fission yeast. Mol Biol Cell 2010; 21:254-65; PMID:19910488; http://dx.doi.org/10.1091/mbc.E09-09-0790
- Tanaka A, Tanizawa H, Sriswasdi S, Iwasaki O, Chatterjee AG, Speicher DW, Levin HL, Noguchi E, Noma KI. Epigenetic regulation of condensin-mediated genome organization during the cell cycle and upon DNA damage through histone H3 lysine 56 acetylation. Mol Cell 2012; 48:532-46; PMID:23084836; http://dx.doi.org/10.1016/j.molcel.2012.09.011
- Ono T, Losada A, Hirano M, Myers MP, Neuwald AF, Hirano T. Differential contributions of condensin I and condensin II to mitotic chromosome architecture in vertebrate cells. Cell 2003; 115:109-21; PMID:14532007; http://dx.doi.org/10.1016/S0092-8674(03)00724-4
- Dowen JM, Bilodeau S, Orlando DA, Hübner MR, Abraham BJ, Spector DL, Young RA. Multiple structural maintenance of chromosome complexes at transcriptional regulatory elements. Stem Cell Reports 2013; 1:371-8; PMID:24286025; http://dx.doi.org/10.1016/j.stemcr.2013.09.002
- Hayflick L. The limited in vitro lifetime of human diploid cell strains. Exp Cell Res 1965; 37:614-36; PMID:14315085; http://dx.doi.org/10.1016/0014-4827(65)90211-9
- Campisi J. Aging, cellular senescence, and cancer. Annu Rev Physiol 2013; 75:685-705; PMID:23140366; http://dx.doi.org/10.1146/annurev-physiol-030212-183653
- Salama R, Sadaie M, Hoare M, Narita M. Cellular senescence and its effector programs. Genes Dev 2014; 28:99-114; PMID:24449267; http://dx.doi.org/10.1101/gad.235184.113
- Shelton DN, Chang E, Whittier PS, Choi D, Funk WD. Microarray analysis of replicative senescence. Curr Biol 1999; 9:939-45; PMID:10508581; http://dx.doi.org/10.1016/S0960-9822(99)80420-5
- Debacq-Chainiaux F, Pascal T, Boilan E, Bastin C, Bauwens E, Toussaint O. Screening of senescence-associated genes with specific DNA array reveals the role of IGFBP-3 in premature senescence of human diploid fibroblasts. Free Radic Biol Med 2008; 44:1817-32; PMID:18329388; http://dx.doi.org/10.1016/j.freeradbiomed.2008.02.001
- Narita M, Nũnez S, Heard E, Narita M, Lin AW, Hearn SA, Spector DL, Hannon GJ, Lowe SW. Rb-mediated heterochromatin formation and silencing of E2F target genes during cellular senescence. Cell 2003; 113:703-16; PMID:12809602; http://dx.doi.org/10.1016/S0092-8674(03)00401-X
- Swanson EC, Manning B, Zhang H, Lawrence JB. Higher-order unfolding of satellite heterochromatin is a consistent and early event in cell senescence. J Cell Biol 2013; 203:929-42; PMID:24344186; http://dx.doi.org/10.1083/jcb.201306073
- De Cecco M, Criscione SW, Peckham EJ, Hillenmeyer S, Hamm EA, Manivannan J, Peterson AL, Kreiling JA, Neretti N, Sedivy JM. Genomes of replicatively senescent cells undergo global epigenetic changes leading to gene silencing and activation of transposable elements. Aging Cell 2013; 12:247-56; PMID:23360310; http://dx.doi.org/10.1111/acel.12047
- Zhang R, Poustovoitov MV, Ye X, Santos HA, Chen W, Daganzo SM, Erzberger JP, Serebriiskii IG, Canutescu AA, Dunbrack RL, et al. Formation of MacroH2A-containing senescence-associated heterochromatin foci and senescence driven by ASF1a and HIRA. Dev Cell 2005; 8:19-30; PMID:15621527; http://dx.doi.org/10.1016/j.devcel.2004.10.019
- Narita M, Narita M, Krizhanovsky V, Nuñez S, Chicas A, Hearn SA, Myers MP, Lowe SW. A novel role for high-mobility group a proteins in cellular senescence and heterochromatin formation. Cell 2006; 126:503-14; PMID:16901784; http://dx.doi.org/10.1016/j.cell.2006.05.052
- Shimi T, Butin-Israeli V, Adam SA, Hamanaka RB, Goldman AE, Lucas CA, Shumaker DK, Kosak ST, Chandel NS, Goldman RD. The role of nuclear lamin B1 in cell proliferation and senescence. Genes Dev 2011; 25:2579-93; PMID:22155925; http://dx.doi.org/10.1101/gad.179515.111
- Chandra T, Kirschner K, Thuret JY, Pope BD, Ryba T, Newman S, Ahmed K, Samarajiwa SA, Salama R, Carroll T, et al. Independence of repressive histone marks and chromatin compaction during senescent heterochromatic layer formation. Mol Cell 2012; 47:203-14; PMID:22795131; http://dx.doi.org/10.1016/j.molcel.2012.06.010
- Olsen JV, Vermeulen M, Santamaria A, Kumar C, Miller ML, Jensen LJ, Gnad F, Cox J, Jensen TS, Nigg EA, et al. Quantitative phosphoproteomics reveals widespread full phosphorylation site occupancy during mitosis. Sci Signal 2010; 3:ra3; PMID:20068231; http://dx.doi.org/10.1126/scisignal.2000475
- Abe S, Nagasaka K, Hirayama Y, Kozuka-Hata H, Oyama M, Aoyagi Y, Obuse C, Hirota T. The initial phase of chromosome condensation requires Cdk1-mediated phosphorylation of the CAP-D3 subunit of condensin II. Genes Dev 2011; 25:863-74; PMID:21498573; http://dx.doi.org/10.1101/gad.2016411
- Theodoratos A, Wilson LOW, Gosling KM, Fahrer AM. Splice variants of the condensin II gene Ncaph2 include alternative reading frame translations of exon 1. FEBS J 2012; 279:1422-32; PMID:22333158; http://dx.doi.org/10.1111/j.1742-4658.2012.08530.x
- Calvo SE, Pagliarini DJ, Mootha VK. Upstream open reading frames cause widespread reduction of protein expression and are polymorphic among humans. Proc Natl Acad Sci U S A 2009; 106:7507-12; PMID:19372376; http://dx.doi.org/10.1073/pnas.0810916106
- Wethmar K, Smink JJ, Leutz A. Upstream open reading frames: molecular switches in (patho)physiology. Bioessays 2010; 32:885-93; PMID:20726009; http://dx.doi.org/10.1002/bies.201000037
- Pedersen AG, Nielsen H. Neural network prediction of translation initiation sites in eukaryotes: perspectives for EST and genome analysis. Proc Int Conf Intell Syst Mol Biol 1997; 5:226-33; PMID:9322041.
- Kozak M. Pushing the limits of the scanning mechanism for initiation of translation. Gene 2002; 299:1-34; PMID:12459250; http://dx.doi.org/10.1016/S0378-1119(02)01056-9
- Stumpf C, Moreno M, Olshen A, Taylor B, Ruggero D. The translational landscape of the mammalian cell cycle. Mol Cell 2013; 52:574-82; PMID:24120665; http://dx.doi.org/10.1016/j.molcel.2013.09.018
- Schleiffer A, Kaitna S, Maurer-Stroh S, Glotzer M, Nasmyth K, Eisenhaber F. Kleisins: A superfamily of bacterial and eukaryotic SMC protein partners. Mol Cell 2003; 11:571-5; PMID:12667442; http://dx.doi.org/10.1016/S1097-2765(03)00108-4
- Fennell-Fezzie R, Gradia SD, Akey D, Berger JM. The MukF subunit of Escherichia coli condensin: architecture and functional relationship to kleisins. EMBO J 2005; 24:1921-30; PMID:15902272; http://dx.doi.org/10.1038/sj.emboj.7600680
- Onn I, Aono N, Hirano M, Hirano T. Reconstitution and subunit geometry of human condensin complexes. EMBO J 2007; 26:1024-34; PMID:17268547; http://dx.doi.org/10.1038/sj.emboj.7601562
- Haering CH, Schoffnegger D, Nishino T, Helmhart W, Nasmyth K, Löwe J. Structure and stability of cohesin's Smc1-kleisin interaction. Mol Cell 2004; 15:951-64; PMID:15383284; http://dx.doi.org/10.1016/j.molcel.2004.08.030
- Ono T, Fang Y, Spector DL, Hirano T. Spatial and temporal regulation of Condensins I and II in mitotic chromosome assembly in human cells. Mol Biol Cell 2004; 15:3296-308; PMID:15146063; http://dx.doi.org/10.1091/mbc.E04-03-0242
- Hirota T, Gerlich D, Koch B, Ellenberg J, Peters JM. Distinct functions of condensin I and II in mitotic chromosome assembly. J Cell Sci 2004; 117:6435-45; PMID:15572404; http://dx.doi.org/10.1242/jcs.01604
- Takata H, Nishijima H, Ogura SI, Sakaguchi T, Bubulya PA, Mochizuki T, Shibahara KI. Proteome analysis of human nuclear insoluble fractions. Genes Cell 2009; 14:975-90; PMID:19695025; http://dx.doi.org/10.1111/j.1365-2443.2009.01324.x
- Sadaie M, Salama R, Carroll T, Tomimatsu K, Chandra T, Young ARJ, Narita M, Pérez-Mancera P, Bennett DC, Chong H, et al. Redistribution of the Lamin B1 genomic binding profile affects rearrangement of heterochromatic domains and SAHF formation during senescence. Genes Dev 2013; 27:1800-8; PMID:23964094; http://dx.doi.org/10.1101/gad.217281.113
- Longworth MS, Herr A, Ji JY, Dyson NJ. RBF1 promotes chromatin condensation through a conserved interaction with the Condensin II protein dCAP-D3. Genes Dev 2008; 22:1011-24; PMID:18367646; http://dx.doi.org/10.1101/gad.1631508
- Reyes JC, Muchardt C, Yaniv M. Components of the human SWI/SNF complex are enriched in active chromatin and are associated with the nuclear matrix. J Cell Biol 1997; 137:263-74; PMID:9128241; http://dx.doi.org/10.1083/jcb.137.2.263
- Cai S, Han HJ, Kohwi-Shigematsu T. Tissue-specific nuclear architecture and gene expression regulated by SATB1. Nat Genet 2003; 34:42-51; PMID:12692553; http://dx.doi.org/10.1038/ng1146
- Bellacosa A, Godwin AK, Peri S, Devarajan K, Caretti E, Vanderveer L, Bove B, Slater C, Zhou Y, Daly M, et al. Altered gene expression in morphologically normal epithelial cells from heterozygous carriers of BRCA1 or BRCA2 mutations. Cancer Prev Res (Phila) 2010; 3:48-61; PMID:20051372; http://dx.doi.org/10.1158/1940-6207.CAPR-09-0078
- Dimri GP, Lee X, Basile G, Acosta M, Scott G, Roskelley C, Medrano EE, Linskens M, Rubelj I, Pereira-Smith O, et al. A biomarker that identifies senescent human cells in culture and in aging skin in vivo. Proc Natl Acad Sci U S A 1995; 92:9363-7; PMID:7568133; http://dx.doi.org/10.1073/pnas.92.20.9363
- Takemoto A, Kimura K, Yokoyama S, Hanaoka F. Cell cycle-dependent phosphorylation, nuclear localization, and activation of human condensin. J Biol Chem 2004; 279:4551-9; PMID:14607834; http://dx.doi.org/10.1074/jbc.M310925200