
Abstract
The nucleolus is considered to be a stress sensor and rDNA-based regulation of cellular senescence and longevity has been proposed. However, the role of rDNA in the maintenance of genome integrity has not been investigated in detail. Using genomically diverse industrial yeasts as a model and array-based comparative genomic hybridization (aCGH), we show that chromosome level may be balanced during passages and as a response to alcohol stress that may be associated with changes in rDNA pools. Generation- and ethanol-mediated changes in genes responsible for protein and DNA/RNA metabolism were revealed using next-generation sequencing. Links between redox homeostasis, DNA stability, and telomere and nucleolus states were also established. These results suggest that yeast genome is dynamic and chromosome homeostasis may be controlled by rDNA.
Introduction
It is widely accepted that genomes of bacteria, yeast and human cancer cells are plastic and responsive to changing environment.Citation1 Stress-induced mutagenesis and other changes in the genome may promote evolution of microbial pathogenesis and antibiotic-resistance, industrial yeast strain resistance to fermentation conditions, and tumor progression and chemotherapy resistance.Citation1
Among 700 known yeast species, the most useful and widely exploited species are those from the Saccharomyces genus, especially S. cerevisiae and its relatives used in numerous fermentation processes such as baking, brewing, distilling, winemaking and cider production. Under fermentation conditions, industrial strains are subjected to both abiotic and biotic stresses, e.g., high sugar, high alcohol, high osmotic and hydrostatic pressure, temperature fluctuations, low pH, variable nutrient availability, anaerobiosis and microbial competition that is associated with transcriptional and translational responses.Citation2-5 Industrial strains are more genomically and genetically unstable than laboratory strains.Citation6 Natural wine yeasts are usually aneuploid strains with disomies, trisomies and tetrasomies,Citation7,8 whereas bottom-fermenting lager yeasts are allotetraploid strains with hybrid genome with varying numbers of S. cerevisiae and non-S. cerevisiae chromosomes.Citation9 Aneuploidy and polyploidy may be adaptive and advantageous by increasing the number of copies of beneficial genes or by protecting the yeasts against recessive lethal or deleterious mutations,Citation7,10 e.g., lager yeasts are able to grow at low temperatures (7–13°C) and to tolerate high osmotic pressure, high hydrostatic pressure, and high ethanol and CO2 concentrations.
Stress-induced changes in repetitive sequences, e.g., at the telomeres and at the rDNA gene locus on chromosome XII, of laboratory and industrial yeast strains have been already documentedCitation11,12 and repetitive loci have been implicated in adaptive evolution mediated by transposable elements.Citation13 More recently, it has been proposed that rDNA instability may maintain genome integrity through checkpoint control induction.Citation14 The stability and/or copy number of rDNA may regulate cellular functions such as senescence and damage resistance being both a sensor for DNA damage and a shock absorber that protects the genome from damage.Citation14 Indeed, we have previously shown that rDNA instability is associated with chronological aging in yeast and the rDNA content of chronologically aged cells may be a factor determining the subsequent replicative lifespan.Citation15
As very little information is available about rDNA stability, the maintenance of genome integrity and adaptive responses in industrially relevant yeast strains, we have comprehensively studied generation- and ethanol-mediated effects on the genome, especially we have focused on rDNA locus. We have found that chromosome level may be balanced during selection that may be promoted by changes in rDNA pools.
Results
Genomic diversity of industrial yeast during passages
Eighteen industrial yeast strains (baker's, brewer's and wine strains) () were studied in order to establish generation- and ethanol-mediated changes in their karyotypes (). Ethanol concentration of 5% was selected to not cause acute cytotoxic effects (spot assay; data not shown).
Figure 1. Karyotype analysis using PFGE separation according to the manufacturer's instructions (BIORAD). Upper panel: yeasts from 1 to 9 are shown, lower panel: yeasts from 10 to 18 are shown. The chromosome marker (BIORAD) is also shown (lane M). Lanes 0: control conditions, lanes 100: 100 generations, lanes 100EtOH: 100 generations in the presence of 5% EtOH.
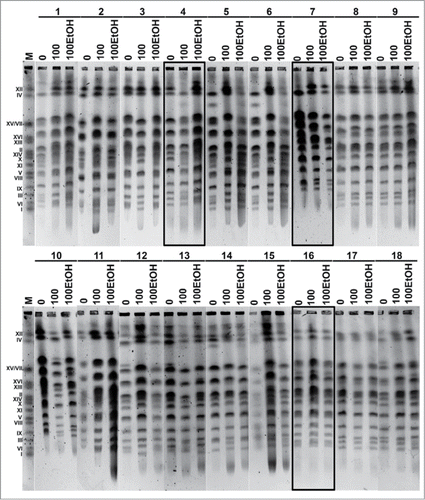
Table 1. Strains used in this study
Three strains were selected for further analysis on the basis of observed changes in their karyotypes (). Some of chromosomes of strains 4 and 7, namely chromosome I, VI, X, XI, XVI, XV/VII and XII, were affected after 100 generations in the presence and absence of 5% ethanol (). Moreover, some additional bands occurred that may be due to generation- and ethanol-stimulated translocations. The changes in DNA level were also observed that may be a consequence of selection-associated changes in the ploidy. Strain 16 served as an example of low level of chromosome variability (). Firstly, the ploidy of selected strains was characterized ().
Figure 2. Generation- and ethanol-mediated viability, vitality and changes in the cell cycle. (A) Fluorescence-activated cell sorting (FACS)-based analysis of DNA content of selected strains (4, 7 and 16). Haploid, diploid, triploid and tetraploid reference strains are also shown. The graphs show superimposed plots of at least 10 independent samples analyzed for each strain. (B) Morphology, live/dead analysis and kinetic growth assay. Left panel: strain 4, middle panel: strain 7, right panel: strain 16. (C) Cell cycle analysis using FACS.
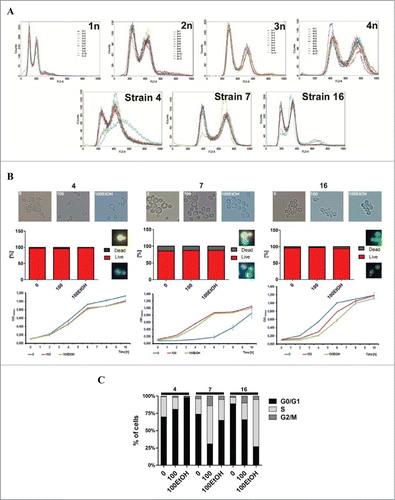
FACS-based analysis of DNA content revealed that strain 7 is tetraploid, whereas strain 16 is diploid with some noticeable cellular heterogeneity (). Most of the histograms for strain 4 show DNA content resembling but higher than diploid, however some of the tested samples show additional abnormalities in the cell cycle profile visible even in asynchronous cells cultures. Two of them accumulate cells in G2 phase of cell cycle, one of them displays enrichment of cells in S phase and shift to higher ploidy (). After 100 generations and alcohol exposure, no significant changes in cell morphology and viability were noticed (). However, growth rate was affected (). Proliferative potential of strains 4 and 16 was decreased, while kinetics of growth of strain 7 was accelerated () that can be explained, at least in part, by changes in the phases of the cell cycle ().
Oxidative stress and DNA damage
Generation- and ethanol-induced imbalance in intracellular redox equilibrium was observed that was independent of strains used (). However, yeast cells not suffered from oxidative stress as judged by the level of oxidative modifications (8-oxo-dG) of their DNA and the level of double strand breaks ().
Figure 3. Generation- and ethanol-mediated changes in redox homeostasis (A), genetic stability (C) and telomere status (D, E). (A) Reactive oxygen species (ROS) production was measured using H2DCF-DA fluorogenic probe. (B) ELISA-based oxidative DNA damage analysis in control conditions. (C) DNA damage using comet assay. The bars indicate SD, n = 3 ***p < 0.001, compared to the standard growth conditions (ANOVA and Dunnett's a posteriori test). The presence (D) and (E) length of telomeric Y’ sequences. The chromosome marker (BIORAD) is also shown (lane M). Lanes 0: control conditions, lanes 100: 100 generations, lanes 100EtOH: 100 generations in the presence of 5% EtOH. PFGE: PFGE separation, gDNA: genomic DNA.
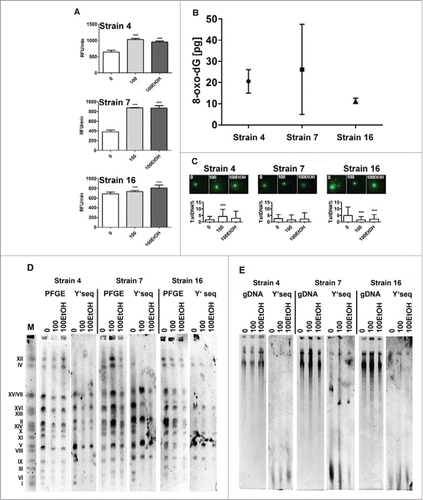
Perhaps, increased production of reactive oxygen species may play a role in the regulation of redox-sensitive signaling pathways rather than cause biomolecule damage.
As telomere homeostasis may be affected by different stress stimuli,Citation11 we monitored the presence and the length of Y’ telomeric sequences during passages and after ethanol treatment (). We found that most of Y’ telomeric sequence-specific signals associated with particular chromosomes were lost and others (minor fraction) were elevated or unchanged (). The length of Y’ telomeric sequences was also increased (strain 4) or decreased (strain 7) or unchanged (strain 16) (). Thus, the response was strain-dependent.
Generation- and ethanol-mediated changes in the genome
Strain 4 with variable chromosome signals was then selected for the observation of generation- and ethanol-mediated changes in the genome using next-generation sequencing. For each sample, we generated from 25.4 to 34.7 millions of single-end 50-bp reads that produced about 4.68 gigabases of the sequence. The phred-scaled quality score plots for all analyzed reads are presented in Online Supplementary File 1. After mapping against the S288C reference genome and quality filtration the dataset comprised from 21.4 to 29.9 millions of mapped reads for individual samples that resulted in an average genome coverage from 88 to 123 x. The mapping statistics are presented in Online Supplementary File 2. The mapped reads covered at least once about 93% of the reference genome for all samples. Histograms of genome coverage (excluding unmapped bases) are presented in Online Supplementary File 3. After removing potential PCR duplicates, the average genome coverage remained high and ranged from 53 to 64 fold for individual samples.
In total, in strain 4 compared to S288C reference genome, we detected 47575 high quality variants (together with multi-allelic variants) that included 44813 (94%) single nucleotide variants (SNVs) and 2762 indels (1235 insertions and 1235 deletions). Transition to transversion ratio for SNVs was estimated at 2.83. More than 86.4% of detected variants were classified as known, however this value may be underestimated, since annotation data set did not include indels. Variant density across the genome was estimated at one variant per every 253 bases. Most of the variants were well propagated with heterozygous to homozygous call ratio estimated at 0.115, which was comparable for separate chromosomes. The detailed variant statistics for all studied samples are presented in and Online Supplementary File 4. All variants detected in strain 4 are specified in the Online Supplementary File 5.
Table 2. Statistics on variants detected in all studied samples across the genome
When compared to control conditions, after 100 generations, after screening of sites that account for differences in coverage and relative allelic ratios, 416 variants differing in allele frequency were retained for further analysis. The analyzed variants included 396 single nucleotide substitutions and 20 indels. Most of the indels involved single nucleotide deletion/insertion in poly-T or poly-A tracts. About 60% of detected SNVs were previously reported (deposited in Ensembl database). Most of these variants manifested as heterozygotes and het/hom ratio was 3.83. The highest number of potentially selected variations was detected on chromosome XI (67) and the lowest on chromosome I (one variant). The variant distribution in the genome is presented in and .
Figure 4. Localization of generation- and ethanol-mediated changes in the genome. Genomic distribution of modifications was revealed using strain 4 and next-generation sequencing (see Materials and Methods for details). Generation-induced changes are shown in red, whereas ethanol-induced changes are shown in green.
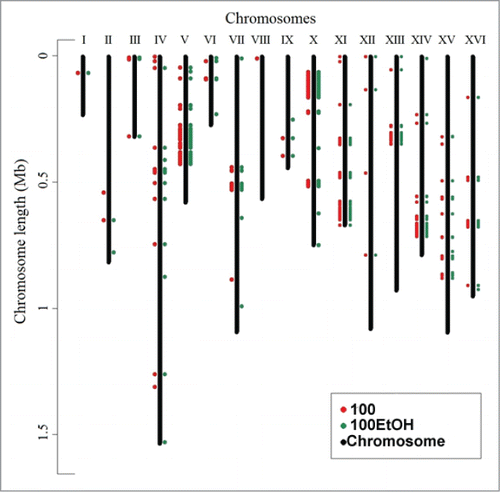
Table 3. The number of detected potentially selection-sensitive variants per chromosome for 100 generations and 100 generations + 5% EtOH samples
The clear variant clusters were observed on chromosomes: V, X, XI, XIII and XIV. As many as 246 (59.1%) of these variants were located in exons. In addition, 131 (31.5%) variants were non-synonymous substitutions, including 3 that introduced a premature stop codons and 2 frameshift mutations associated with insertion of a single adenine nucleotide on chromosome XIII in RSF1 gene. The coding variants affected 162 different genes. The highest number of variants within coding sequences was detected in MLP1 and FMS1 genes (6 variants) and UBP2 and RSF1 genes (5 variants). Remaining genes had from one to 4 variants (Online Supplementary File 6). Premature stop codons were observed in RTC2, ARG5,6 and ABZ1 genes. Functional analysis of the affected genes showed that of the 139 gene entries recognized by Panther System, 61 (43.8%) were involved in catalytic activity (especially hydrolase and transferase activity) and 37 (26.6%) in binding (especially, nucleic acid binding – 27 genes). The genes were mainly involved in metabolic processes (82 genes, 58.9%), especially in primary processes such as protein metabolism and DNA/RNA metabolic processes or other nucleotide metabolism, especially interesting were genes associated with DNA repair: RAD26, RAD51 and RAD57.
When compared to control conditions, in ethanol-treated samples, after filtration, 435 variants were retained with differences in allelic frequencies. These variants included 410 SNVs and 25 indels. About 57% of SNVs were previously reported. As many as 401 (92%) of variants were common for both 100 generations in the presence and absence of ethanol. Distribution of variants unique for passages with and without ethanol was mostly random in ethanol-treated samples, however most of the variants propagating only after 100 generations were grouped on chromosome IV. The heterozygous to homozygous call ratio for the ethanol-treated sample variants was calculated and amounted to 3.68. The highest number of variants was detected on chromosome X, XI and XIII (64-65 variants). In addition, 245 (56%) of the detected variants were located in exons and 129 (29.6%) of them were non-synonymous. Variants were located in 166 different genes of which 108 had non-synonymous substitutions, including 3 frameshift mutations (RSF1 gene and YDR544C ORF), one in-frame deletion (MHP1 gene) and 2 that introduced premature stop codons (ARG5,6 and ABZ1 genes). The variants differing in allelic frequencies in ethanol-treated samples compared to control conditions are presented in Online Supplementary File 7.
After screening of initial variant calls, 32 variants that were partially or fully propagated in one of the passage conditions (with or without alcohol) and were not detectable or differing in allelic shear in strain 4 (control conditions) were analyzed separately. Of these unique variants, 24 were single nucleotide substitutions and 5 encompassed single nucleotide insertions/deletions. About 69% of these variants were not annotated in databases (unknown variants). All detected unique variants were partially propagated and manifested as heterozygotes. Eight (27.6%) SNVs and one indel were located within gene sequences and encompassed 6 missense variants, one synonymous variant, single in-frame deletion and one substitution introducing a premature stop codon. These events affected 9 different genes. Exon-located variants are presented in .
Table 4. Exonic variants specific for passages and not found in control samples
All of these variants, along with their annotations, are presented in Online Supplementary File 8. All nine validated SNVs showed perfect concordance of manifested genotypes between next-generation sequencing and Sanger reference method. All compared SNVs, along with their flanking sequences and corresponding sequencing chromatograms are specified in Online Supplementary File 9. The high concordance of the results suggests that large part of variants differing in allelic frequencies between samples are considered to be true and false positive rate of our experiment is relatively low. In summary, strain 4 has a large number of fixed variants compared to the reference S288C genome. Analysis of coverage histograms showed relatively lower coverage of chromosomes I, III and VI when compared to remaining chromosomes and a higher coverage of chromosome IV, which suggests a potential occurrence of ploidies in all of the analyzed samples. The variants that undergo selection during passages in most cases were not fully propagated (manifesting as heterozygotes) and a large part of them was non-synonymous substitutions (∼30%). Most of the variants with changes in allelic frequency compared to control conditions were common for samples after 100 generations and ethanol-treated samples. Most of the variants propagating only in samples after 100 generations were grouped on chromosome IV. Many of variants that undergo selection is concentrated in specific chromosomal locations (variant clusters) on chromosomes V, X, XI, XIII and XIV, representing potential mutational hotspots, genomic regions bearing functionally important genes or regions with low sequence complexity inducing mapping and genotyping errors. In most cases, these sites exhibited variation in control conditions when compared to the reference genome and underwent propagation during the passages. The selected genes, potentially beneficial variants, were mainly involved in metabolic processes, especially in primary processes such as protein metabolism and DNA/RNA metabolism.
To characterize the chromosome status, array-based CGH analysis was then conducted ().
Figure 5. Generation- and ethanol-mediated changes in chromosome level using array-based comparative genome hybridization (aCGH) (see Materials and Methods for details). Log2 ratios are shown. 100: 100 generations, 100EtOH: 100 generations in the presence of 5% EtOH, 4: strain 4, 7: strain 7, 16: strain 16. To obtain final CGH profiles, the data for each strain were compared to control conditions of each strain.
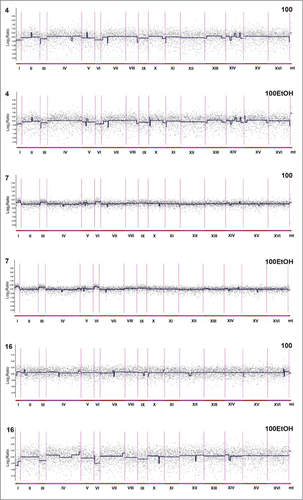
No gross variations in the number of chromosomes of strains 4, 7 and 16, neither in the cells of the original cultures nor in the cells grown for 100 generations in the standard YPD medium or under exposure to ethanol stress were revealed (). However, noticeable differences in the relative content of chromosomes I, III, VI and IX were observed (). For strain 4, the initial excess of these chromosomes disappeared after 100 generations both with and without 5% ethanol, whereas for strain 16 the initial excess of these chromosomes disappeared only after 100 generations in the presence of ethanol. For strain 7, some gains of chromosomes I, III and VI were observed after 100 generations with and without of ethanol. On the other hand, there was a consistent deficit of chromosome IX in strains 7 and 16 (). Changes in subtelomeric sequences were also revealed that may be consistent with Southern blot data (). In addition to differences pertaining to larger regions of the genome, some interesting dissimilarities on the level of individual genes were revealed in strain 4 when the control cells were compared to those grown for 100 generations with and without ethanol. The analysis of overrepresentation of gene ontology functional annotations among the genes that became much less abundant in cell population after 100 generations, as determined by CGH analysis, revealed mating type determination biological process as strongly (over 30-fold, corrected p = 0.005) overrepresented category. There were 3 genes, namely YAL029C (MYO4), YCL066W (HMLALPHA1) and YCR040W (MATALPHA1) that belong to this category. Together with 4 other genes YGR163W (GTR2), YPR068C (HOS1), YGL254W (FZF1) and YAL040C (CLN3) they belong to broader category of positive regulators of transcription, much less but still significantly overrepresented (over 7-fold, corrected p = 0.009) in the selected group of genes.
The nucleolus state is affected during passages
The nucleolus state was also analyzed ().
Figure 6. Generation- and ethanol-mediated changes in nucleolus state. (A, B) Southern blot analysis of rDNA level and length. Lanes 0: control conditions, lanes 100: 100 generations, lanes 100EtOH: 100 generations in the presence of 5% EtOH. PFGE: PFGE separation, gDNA: genomic DNA. (C) WCPP-based analysis of rDNA content (green). Results are presented as relative fluorescence units (RFUs). The box-and-whisker plots are shown, n = 3 ***p < 0.001, compared to the standard growth conditions (ANOVA and Dunnett's a posteriori test). Typical micrographs are also shown. DNA was visualized using DAPI staining (blue). (D) Silver staining of nucleolar organizer region-based analysis of nucleolus fragmentation. Fragmented nucleoli were scored [%]. (E) WB analysis of Fob1p and Nop1p contents. Anti-Act1p antibody served as a loading control. Lanes 0: control conditions, lanes 100: 100 generations, lanes 100EtOH: 100 generations in the presence of 5% EtOH. (F) Single chromosome comet assay of chromosome XII that contains rDNA locus. Typical micrographs are shown. DNA was visualized using YOYO-1 staining (green). White arrowheads indicate DNA breaks, whereas red arrowheads indicate abnormal replication intermediates.
![Figure 6. Generation- and ethanol-mediated changes in nucleolus state. (A, B) Southern blot analysis of rDNA level and length. Lanes 0: control conditions, lanes 100: 100 generations, lanes 100EtOH: 100 generations in the presence of 5% EtOH. PFGE: PFGE separation, gDNA: genomic DNA. (C) WCPP-based analysis of rDNA content (green). Results are presented as relative fluorescence units (RFUs). The box-and-whisker plots are shown, n = 3 ***p < 0.001, compared to the standard growth conditions (ANOVA and Dunnett's a posteriori test). Typical micrographs are also shown. DNA was visualized using DAPI staining (blue). (D) Silver staining of nucleolar organizer region-based analysis of nucleolus fragmentation. Fragmented nucleoli were scored [%]. (E) WB analysis of Fob1p and Nop1p contents. Anti-Act1p antibody served as a loading control. Lanes 0: control conditions, lanes 100: 100 generations, lanes 100EtOH: 100 generations in the presence of 5% EtOH. (F) Single chromosome comet assay of chromosome XII that contains rDNA locus. Typical micrographs are shown. DNA was visualized using YOYO-1 staining (green). White arrowheads indicate DNA breaks, whereas red arrowheads indicate abnormal replication intermediates.](/cms/asset/0fca2839-1090-489e-a111-696a5ca677dd/kccy_a_1093705_f0006_oc.gif)
We found that disappearance of initial excess of chromosomes in strains 4 and 7 with variable chromosome signals was accompanied by shifts in rDNA levels and rDNA length after 100 generations in the presence and absence of ethanol (), whereas in strain 16 with low level of chromosome variability, the level of rDNA was unaffected that may suggest the role of rDNA in the maintenance of chromosome homeostasis. Moreover, the nucleolus morphology was changed after 100 generations in the presence and absence of ethanol that was independent of strains used (). Ethanol-treated cells had fragmented nucleoli when compared to control cells (). The level of nucleolar protein Fob1 was elevated after 100 generations in the presence and absence of ethanol in all strains examined, whereas Nop1p was only slightly increased (). The susceptibility of chromosome XII that contains the rDNA locus to damage and defects in DNA replication was also evaluated (). In control conditions, chromosome XII was more unstable in strains 4 and 7 than in strain 16. The changes involved DNA breaks and accumulation of abnormal replication intermediates (). After 100 generations in the presence and absence of ethanol, chromosome XII was less affected ().
Discussion
The nucleolus is thought to be something more than a ribosome factory.Citation16,17 The nucleolus is speculated to be a guardian of cellular homeostasis and genome integrity acting as a central hub in coordinating the cellular stress response.Citation17 In mammalian cells, the nucleolus can sense and transmit stress signals to RNA polymerase I (Pol I) transcription machinery switching off the rRNA synthesis that may save the energy required to maintain cellular homeostasis during stress.Citation18 Under stress conditions, nucleolar proteins (e.g., ARF, L5, L11, L23 or B23/nucleophosmin) and transcription factors (e.g., TIF-IA) are relocated from nucleolus to nucleoplasm/cytoplasm that may affect MDM2 activity and cause p53 stabilization and cell cycle arrest.Citation16,19,20 Interestingly, the role of the yeast nucleolus in the response to oxidative stress signals has been also documented by us.Citation21 During oxidant-induced nucleolar stress in yeast, Rrn3p, a homolog of the mammalian TIF-IA, is also translocated from the nucleolus into the cytoplasm Citation21 that suggests a common nucleolus-centered stress response in eukaryotic cells.
As rDNA stability has been also proposed to be a regulator of stress responses, e.g., DNA damage response, and cellular longevity,Citation14 we were interested in determining whether nucleolus state (rDNA pools) may be also affected during cell selection (during passages) both in the presence and absence of stress stimuli. We used industrial yeast cells as a model of high genomic diversity and genomic instability and cultured cells for 100 generations with and without 5% ethanol. We found that cells adapted to treatment by changes in their chromosome levels, namely relative chromosome content was balanced after selection compared to control conditions as estimated using aCGH. Cells with initial excess of chromosomes, mainly chromosomes I, III and VI, were eliminated. Moreover, cells with DNA double strand breaks and affected chromosome XII (DNA breaks, abnormal replication intermediates) were also negatively selected. Thus, DNA stability was promoted during passages. These changes were accompanied by shifts in rDNA pools. However, the response was cell-dependent. The rDNA levels of cells with less chromosome variability (strain 16) were unaffected, whereas in cells with variable karyotype profiles (strains 4 and 7), the rDNA content was changed. It seems that cells may adjust their own optimal rDNA copy number to promote cellular homeostasis, here chromosome homeostasis, and viability. The rDNA, the most unstable region in the yeast genome, is highly repetitive and prone to losing copies by homologous recombination among the repeats.Citation22 Two proteins are key players in the maintenance of rDNA copy number and rDNA stability, namely Fob1 and Sir2.Citation22 Lost rDNA copies are recovered by Fob1-mediated inhibition of replication fork progression at the replication fork barrier (RFB) resulting in double strand breaks and recombination-based amplification.Citation22 When rDNA copy number reaches wild type levels, Sir2 silences a non-coding bidirectional promoter E-pro.Citation22 As these 2 proteins are also determinants of yeast replicative lifespan,Citation23,24 rDNA theory of aging has been proposed.Citation14 The rDNA as the most unstable part of the yeast genome is also the most prone to damage that may trigger cell cycle arrest through checkpoint control and allow for damage repair or if the levels of damage are too high to be repaired, cellular senescence is induced.Citation14 Perhaps, in our experimental conditions, changes in rDNA levels promoted more balanced chromosome state. Thus, cells eliminated the excess of chromosomes and aberrant chromosome XII during selection. Cell adaptation also involved Fob1p upregulation that may modulate rDNA stability and promote cell survival. On the other hand, nucleolar morphology was affected during passages. More cells expressed fragmented nucleoli that was accompanied by moderate increase in the levels of Nop1p. Overexpression of other nucleolar protein Nop2 resulted in nucleolus fragmentation.Citation25 Moreover, Nop2-mediated nucleolus fragmentation was also observed in chronologically aged yeast cells.Citation15 All together, nucleolus state was affected during passages.
As telomeres (telomere length, gene amplification at the telomeres) can be manipulated as a response to environmental stresses during fermentationCitation12 and passagesCitation11 in industrial and laboratory yeast, respectively, we asked then whether cell selection may also promote telomere homeostasis in industrial yeasts. In general, Y’ telomeric sequences were lost during passages, whereas changes in telomere length were strain-dependent, especially after 5% ethanol treatment. Thus, no clear-cut response was observed. In contrast, ethanol (3-7%) was previously found to elongate telomeres in laboratory wild-type strain BY4741 that was mediated by the Rap1/Rif1 pathway.Citation11
Strain 4, diploid wine strain with aneuploidy events, with increased rDNA level and telomere length after ethanol treatment, was selected for next-generation sequencing. Surprisingly, after 100 generations in the presence and absence of 5% ethanol, variants (mainly single nucleotide variants and indels) were observed at similar chromosomal locations on chromosomes V, X, XI, XIII and XIV that may represent potential mutational hotspots. The highest frequency of variants was found in MLP1, FMS1, and UBP2 genes. Mlp1 and Mlp2, myosin-like proteins 1 and 2, are coiled-coil proteins of the nuclear envelope that restrict telomere length by influencing the Rif–Tel1 pathway of telomerase regulation.Citation26 As the cells of Δmlp1Δmlp2 double mutant have extended telomeres,Citation26 generation- and ethanol-mediated changes in MLP1 gene (this study) may also modulate telomere length in strain 4. Fms1p is a polyamine oxidase required for conversion of spermine to spermidine and the hypusine modification of translation factor eIF-5A,Citation27 thus, any changes in FMS1 gene may affect cell proliferation. Indeed, the cell cycle of strain 4 was affected during passages, namely the G0/G1 cell cycle arrest and decreased growth rate were observed. Moreover, the deubiquitinating enzyme Ubp2 may be inhibited by oxidative stress leading to accumulation of (Lys63) K63 conjugates assembled by the Rad6 ubiquitin conjugase and the Bre1 ubiquitin ligase and oxidant-based impairment of K63 ubiquitination may modulate polysome stability and protein expression.Citation28 The K63-polyubiquitinated targets are numerous ribosomal proteinsCitation28 that may also affect nucleolus state. Perhaps, changes in nucleolar morphology and the levels of nucleolar proteins, e.g., Nop1p, may reflect generation- and ethanol-induced changes in the UBP2 gene in strain 4. Moreover, aCGH-based analysis revealed that some genes involved in the regulation of mating-type (YAL029C, YCL066W and YCR040W) were affected during passages that may be in agreement with a mechanism of evolution of natural wine yeasts called genome renewal.Citation29 Heterozygous diploid yeast may change into homozygous diploids by sporulation and homothallic switching of individual haploid spores that removes recessive deleterious genes and fixes recessive beneficial alleles, thereby enabling yeasts to adapt efficiently to changing environmental conditions.Citation29
In conclusion, we have shown that cells with unbalanced chromosome level are eliminated during passages in the presence and absence of mild stress stimuli (5% ethanol) that is accompanied by changes in the rDNA pools ().
Figure 7. rDNA-mediated chromosome homeostasis during passages. Cells with initial excess of chromosome levels are eliminated and cells with more balanced chromosome state are promoted that is accompanied by shifts in rDNA pools (see text for details).
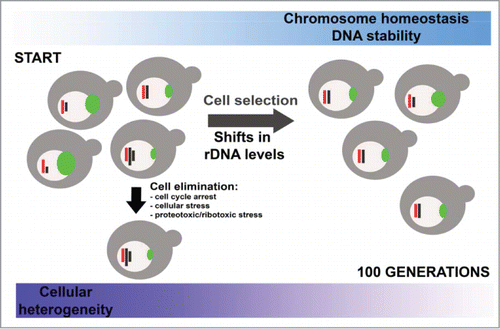
Cells with damaged DNA, especially with aberrant chromosome XII that contains rDNA locus are also negatively selected. The fittest and the best adapted cells dominated after 100 generations (). Moreover, cell selection was associated with changes in the genome at the nucleotide level as judged using next-generation sequencing that confirms dynamic nature of eukaryotic genome as a response to changing environment. Similar scenario may be considered a universal phenomenon that may take place during microorganism adaptations in natural environments. Additionally, rDNA may also promote the survival of the fittest and best adapted cancer cells by modifying their chromosome level status that may have putative implications in the cancer therapy. Thus, the role of rDNA in cancer cell adaptations should be emphasized and comprehensively analyzed in the future.
Materials and Methods
Reagents
All reagents, if not otherwise mentioned, were purchased from Sigma (Poland) and were of analytical grade.
Yeast strains and growth conditions
All industrial yeast strains used in this study are listed in . Yeast from one single colony was grown either on liquid YPD medium (1% w/v Difco Yeast Extract, 2% w/v Difco Yeast Bacto-Peptone, 2% w/v dextrose) or on solid YPD medium containing 2% w/v Difco Bacto-agar, at 28 °C. Yeast cells were cultured for 100 generations in the presence or absence of 5% ethanol, namely cells were grown for 6.(6) generations before being diluted (1:100) into fresh YPD medium. Cell morphology was inspected under a light microscope and cell growth was monitored using kinetic growth assay as described elsewhere.Citation15 Cell viability was estimated with a LIVE/DEAD® Yeast Viability Kit (Molecular Probes, Netherlands) using the standard protocol according to the manufacturer's instructions.
Pulsed-field gel electrophoresis (PFGE)
Preparation of agarose-embedded yeast DNA and PFGE separation of yeast DNA were conducted as described elsewhere.Citation30
FACS-based cell cycle and ploidy analysis
The DNA content was measured via flow cytometry as previously described,Citation31 except that a total of 3×10⁴ cells were counted in a single assay.
Oxidative stress parameters
Generation-dependent intracellular reactive oxygen species (ROS) production was measured using 2′,7′-dichlorodihydrofluorescein diacetate (H2DCF-DA) as described elsewhere.Citation15 Oxidative DNA damage as a level of 8-hydroxy-2′-deoxyguanosine (8-OHdG, 8-oxo-dG) was measured using Epigentek EpiQuik 8-OHdG DNA Damage Quantification Direct Kit (Gentaur, Poland) using the standard protocol according to the manufacturer's instructions.
Comet assay and chromosome comet assay
Yeast spheroplasts were obtainedCitation30 and DNA double-strand breaks (DSBs) were assessed by neutral single-cell microgel electrophoresis (comet assay) as described elsewhere.Citation32 The percentage of tail DNA was used as a parameter of DNA damage. Chromosome XII comet assay was conducted according to.Citation30
Detection and length of telomeric Y’ sequences
Y' element telomeric probe was obtained according toCitation11 with minor modifications. After standard PFGE separation, Y’ sequences within particular yeast chromosomes were detected using digoxigenin labeling, anti-digoxigenin antibody and phosphate alkaline-based chemiluminescence.15 Y’ sequence length was estimated after DNA digestion with PstI.
Next-generation sequencing (NGS)
After 100 generations in the presence and absence of 5% ethanol, a 100 ng of the purified dsDNA from strain 4 was sheared to the average fragment sizes of 350 bp with Covaris M220 ultrasonicator. The sequencing libraries were prepared with TruSeq Nano DNA Sample Prep kit (Illumina, San Diego, CA). Briefly, the protocol involved DNA ends repair, magnetic beads-based size selection, 3′ end adenylation, ligation of indexed adapters and library enrichment by PCR. Purified libraries were quantified with the use of Qubit Fluorometer (Life Technologies) and quality was then controlled by the Agilent's 2200 TapeStation electrophoresis. The libraries were sequenced on v3 Illumina flow cell on HiScanSQ system in a single 50-bp run using TruSeq SBS HS-v3 kit (Illumina). After de-multiplexing, raw reads were controlled with FastQC softwareCitation33 and mapped against S. cerevisiae reference genome (SacCer3) with Burrows-Wheeler Aligner (BWA).Citation34 The mapped reads were filtered to remove reads with mapping quality lower than 20 using SAMTools.Citation35 The mapping statistics were generated using Picard-tools. To identify potential chromosome ploidy, genome coverage plots were generated with BEDTools.Citation36 Before variant calling, PCR-duplicated reads were removed from the dataset with Picard-tools. Single nucleotide variants (SNVs) and small indels were identified using FreeBayes software, which is a Bayesian genetic variant detector designed to detect small polymorphisms.Citation37 The software was set to diploid calling with disabled options for detection of multi-nucleotide polymorphisms (MNPs) and complex events (composites of other classes). Minimum mapping quality was set to 20 and minimum base quality was set to 30. The variants were further filtered to remove those with corrected coverage (read depth, DP) lower than 6. The filtered variants were annotated with snpEffCitation38 and Variant Effect PredictorCitation39 software against R64-1-1 Ensembl annotation data set. Known variants were specified according to the Ensembl VCF file, which included only SNVs. Then, the variants were compared between different conditions (after 100 generations in the presence and absence of 5% ethanol) using VCFlib toolkit and ‘annotate genotypes’ option. The locations of potential de novo mutations and variants, which propagated in treated samples compared to control sample were checked for read depth in control strain to account for differences in coverage between samples. Only sites, which were covered by at least 7 reads in de-duplicated BAM file (raw coverage) and had no detectable variation in control strain (more than 95% of reads supported reference allele) were considered. The screening of sites with no variants detected in the reference strain was conducted by the inspection of SAMTools-generated mpileup file with custom R script. Considering that different strains can have substitution in respect to the reference S288C genome, we have also searched for sites with differences in assigned variant genotypes between studied conditions, e.g., with fixed or well propagated variation in a control strain, which was a subject of both reduction or fixation after 100 generations. To keep the number of false-positives possibly low, allele frequency differences were only considered at sites with read depth >30 in both compared conditions and high genotype quality. To further validate discrepant genotype calls, the ratio of reads supporting each allele was calculated for each sample and the difference in allelic ratios between samples was calculated according to the formula: F = (ROM/AOM) – (ROR/AOR), where: F – allelic ratio difference, ROM – count of reads supporting reference allele (reference observed) in modified strains, AOM – count of reads supporting alternate allele (alternate observed) in modified strains, ROR - count of reads supporting reference allele (reference observed) in reference strain, AOR - count of reads supporting alternate allele (alternate observed) in reference strains. For further analysis, only variants with a difference higher than 0.5 in allelic ratios (F) between samples were retained. Molecular functions and biological processes conditioned by genes affected by potential de novo mutations in different conditions were analyzed using Panther Classification SystemCitation40 based on gene list obtained from Ensembl Variant Effect Predictor. Eight randomly selected variants (and one additional neighboring variant) showing differences in allelic frequencies between control and treated samples were validated using Sanger sequencing. Briefly, 250-280 bp DNA fragments spinning validated variants were amplified using primer presented in Online Supplementary File 9. Amplification was performed with Fast Cycling PCR Kit (Qiagen) in accordance with manufacturer specifications. PCR products were purified using ExoSAP-IT (USB Corporation) and sequenced using BigDye® Terminator v3.1 Cycle Sequencing Kit (Life Technologies) and 3130xl capillary electrophoresis system (Life Technologies). Sequencing results were compared to genotypes obtained after next-generation sequencing.
Array-based comparative genomic hybridization (aCGH) analysis
Genomic DNA (0.5 μg) was labeled with SureTag DNA Labeling Kit and either Cy3- or Cy5-dUTP. Equal amounts of labeled DNA of tested and of the reference strain (BY4741) were combined and hybridized to Yeast (V2) Gene Expression Microarray, 8x15K using Oligo aCGH Hybridization Kit. All components were supplied by Agilent Technologies Inc. (Santa Clara, CA, USA) and all steps of the experiment were performed according to manufacturer's protocols. Following hybridization and washing, the slides were scanned using Axon GenePix 4000B. Feature extraction was conducted using GenePix Pro 6.1 and normalization using Acuity 4.0 (all from Molecular Devices, Sunnyvale, CA, USA). Further processing was conducted using Microsoft Excel. To obtain final CGH profiles, the data for each strain were compared to control conditions of each strain.
Gene analysis after aCGH
The analysis of over-representation of functional categories was performed using Cytoscape v. 2.8.2 with BiNGO v. 2.44 plug-in and hypergeometric test using Benjamini and Hochberg False Discovery Rate (FDR) correction and significance level of 0.05.
rDNA analyses
rDNA was detected using both Southern blotting using rDNA specific probe,Citation15 and fluorescence in situ hybridization (FISH) using whole chromosome XII painting probe.Citation41 For Southern blotting, rDNA specific signals were detected using digoxigenin labeling, anti-digoxigenin antibody and phosphate alkaline-based chemiluminescence. For analysis of rDNA length, DNA was digested with BamHI. For FISH, biotin-labeled chromosome XII-specific DNA was detected using Star*FISH© Biotin Painting Kit — FITC Label (Cambio, UK). To analyze the nucleolar rDNA content, ImageJ software http://rsbweb.nih.gov/ij/ was used as described elsewhere.Citation30
Western blotting
For WB analysis, whole cell extracts were prepared according to.Citation15 The following primary antibodies were used: anti-Fob1p (1:200), anti-Nop1p (1:200) and anti-Act1p (1:1000) (Santa Cruz, Abcam). The respective proteins were detected after incubation with one of the horseradish peroxidase-conjugated secondary antibodies (1:80000 or 1:125000) (Sigma). The chemiluminescence signals were detected with an ECL Plus Western Blotting Detection System (GE Healthcare) and a G:BOX imaging system (Syngene, Cambridge, UK).
Nucleolus morphology
To visualize the nucleolus, silver staining of nucleolar organizer regions (AgNOR) was performed. Silver staining of nucleolar argyrophilic proteins was conducted according to.Citation15 A total of 100 cells were analyzed and their nucleolus morphological type was determined (unaffected or fragmented nucleolus) [%].
Statistical analysis
The results represent the mean ± SD from at least 3 independent experiments. Statistical significance was assessed by 1-way ANOVA using GraphPad Prism 5, and with the Dunnett's multiple comparison test.
Disclosure of Potential Conflicts of Interest
No potential conflicts of interest were disclosed.
Supplemental Material
Supplemental data for this article can be accessed on the publisher's website.
Author Contributions
Conceived and designed the experiments: MW. Performed the experiments: AD JA AK AG MS AS TS IJ MM ER SP AP JK AL MW. Analyzed the data: AG MS AS AL MW. Contributed reagents/materials/analysis tools: AL MW. Wrote the paper: AL MW.
1093705_Supplemental_Material.zip
Download Zip (5.8 MB)Acknowledgments
We are indebted to Prof. Martin Kupiec and Dr Yaniv Harari (Tel Aviv University, Israel) for sharing with us the protocol on the construction of Y’ telomeric probes.
Funding
This work was supported by European Union, within Regional Operational Program of Subcarpathia Voivodeship (2007-2013), Priority 1: Competitive and Innovative Economy, Action 1.3, Regional Innovation System, grant WND-RPPK-01.03.00-18-038/13.
Related Research Data
References
- Galhardo RS, Hastings PJ, Rosenberg SM. Mutation as a stress response and the regulation of evolvability. Crit Rev Biochem Mol Biol 2007; 42:399-435; PMID:17917874; http://dx.doi.org/10.1080/10409230701648502
- Carrasco P, Querol A, del Olmo M. Analysis of the stress resistance of commercial wine yeast strains. Arch Microbiol 2001; 175:450-7; PMID:11491086; http://dx.doi.org/10.1007/s002030100289
- Zuzuarregui A, Carrasco P, Palacios A, Julien A, del Olmo M. Analysis of the expression of some stress induced genes in several commercial wine yeast strains at the beginning of vinification. J Appl Microbiol 2005; 98:299-307; PMID:15659184; http://dx.doi.org/10.1111/j.1365-2672.2004.02463.x
- Brosnan MP, Donnelly D, James TC, Bond U. The stress response is repressed during fermentation in brewery strains of yeast. J Appl Microbiol 2000; 88:746-55; PMID:10792534; http://dx.doi.org/10.1046/j.1365-2672.2000.01006.x
- Attfield PV. Stress tolerance: the key to effective strains of industrial baker's yeast. Nat Biotechnol 1997; 15:1351-7; PMID:9415886; http://dx.doi.org/10.1038/nbt1297-1351
- Ambrona J, Vinagre A, Ramirez M. Rapid asymmetrical evolution of Saccharomyces cerevisiae wine yeasts. Yeast 2005; 22:1299-306; PMID:16358308; http://dx.doi.org/10.1002/yea.1331
- Bakalinsky AT, Snow R. The chromosomal constitution of wine strains of Saccharomyces cerevisiae. Yeast 1990; 6:367-82; PMID:2220073; http://dx.doi.org/10.1002/yea.320060503
- Mortimer RK. Evolution and variation of the yeast (Saccharomyces) genome. Genome Res 2000; 10:403-9; PMID:10779481; http://dx.doi.org/10.1101/gr.10.4.403
- Kodama Y, Kielland-Brandt MC, Hansen J. Lager brewing yeast Comparative Genomics: Springer Berlin Heidelberg, 2006:145-64
- Salmon JM. Enological fermentation kinetics of an isogenic ploidy series derived form an industrial Saccharomyces cerevisiae strain. J Ferment Bioeng 1997; 83:253-60; http://dx.doi.org/10.1016/S0922-338X(97)80988-9
- Romano GH, Harari Y, Yehuda T, Podhorzer A, Rubinstein L, Shamir R, Gottlieb A, Silberberg Y, Pe'er D, Ruppin E, et al. Environmental stresses disrupt telomere length homeostasis. PLoS Genet 2013; 9:e1003721; PMID:24039592; http://dx.doi.org/10.1371/journal.pgen.1003721
- James TC, Usher J, Campbell S, Bond U. Lager yeasts possess dynamic genomes that undergo rearrangements and gene amplification in response to stress. Curr Genet 2008; 53:139-52; PMID:18183398; http://dx.doi.org/10.1007/s00294-007-0172-8
- Biemont C, Vieira C. Genetics: junk DNA as an evolutionary force. Nature 2006; 443:521-4; PMID:17024082; http://dx.doi.org/10.1038/443521a
- Kobayashi T. A new role of the rDNA and nucleolus in the nucleus–rDNA instability maintains genome integrity. Bioessays 2008; 30:267-72; PMID:18293366; http://dx.doi.org/10.1002/bies.20723
- Lewinska A, Miedziak B, Kulak K, Molon M, Wnuk M. Links between nucleolar activity, rDNA stability, aneuploidy and chronological aging in the yeast Saccharomyces cerevisiae. Biogerontology 2014; 15:289-316; PMID:24711086; http://dx.doi.org/10.1007/s10522-014-9499-y
- Olson MO. Sensing cellular stress: another new function for the nucleolus? Sci STKE 2004; 2004:pe10; PMID:15026578
- Grummt I. The nucleolus-guardian of cellular homeostasis and genome integrity. Chromosoma 2013; 122:487-97; PMID:24022641; http://dx.doi.org/10.1007/s00412-013-0430-0
- Mayer C, Bierhoff H, Grummt I. The nucleolus as a stress sensor: JNK2 inactivates the transcription factor TIF-IA and down-regulates rRNA synthesis. Genes Dev 2005; 19:933-41; PMID:15805466; http://dx.doi.org/10.1101/gad.333205
- Rubbi CP, Milner J. Disruption of the nucleolus mediates stabilization of p53 in response to DNA damage and other stresses. EMBO J 2003; 22:6068-77; PMID:14609953; http://dx.doi.org/10.1093/emboj/cdg579
- Mayer C, Zhao J, Yuan X, Grummt I. mTOR-dependent activation of the transcription factor TIF-IA links rRNA synthesis to nutrient availability. Genes Dev 2004; 18:423-34; PMID:15004009; http://dx.doi.org/10.1101/gad.285504
- Lewinska A, Wnuk M, Grzelak A, Bartosz G. Nucleolus as an oxidative stress sensor in the yeast Saccharomyces cerevisiae. Redox Rep 2010; 15:87-96; PMID:20500990; http://dx.doi.org/10.1179/174329210X12650506623366
- Kobayashi T. Strategies to maintain the stability of the ribosomal RNA gene repeats–collaboration of recombination, cohesion, and condensation. Genes Genet Syst 2006; 81:155-61; PMID:16905869; http://dx.doi.org/10.1266/ggs.81.155
- Defossez PA, Prusty R, Kaeberlein M, Lin SJ, Ferrigno P, Silver PA, Keil RL, Guarente L. Elimination of replication block protein Fob1 extends the life span of yeast mother cells. Mol Cell 1999; 3:447-55; PMID:10230397; http://dx.doi.org/10.1016/S1097-2765(00)80472-4
- Kaeberlein M, McVey M, Guarente L. The SIR2/3/4 complex and SIR2 alone promote longevity in Saccharomyces cerevisiae by two different mechanisms. Genes Dev 1999; 13:2570-80; PMID:10521401; http://dx.doi.org/10.1101/gad.13.19.2570
- de Beus E, Brockenbrough JS, Hong B, Aris JP. Yeast NOP2 encodes an essential nucleolar protein with homology to a human proliferation marker. J Cell Biol 1994; 127:1799-813; PMID:7806561; http://dx.doi.org/10.1083/jcb.127.6.1799
- Hediger F, Dubrana K, Gasser SM. Myosin-like proteins 1 and 2 are not required for silencing or telomere anchoring, but act in the Tel1 pathway of telomere length control. J Struct Biol 2002; 140:79-91; PMID:12490156; http://dx.doi.org/10.1016/S1047-8477(02)00533-6
- Chattopadhyay MK, Tabor CW, Tabor H. Spermidine but not spermine is essential for hypusine biosynthesis and growth in Saccharomyces cerevisiae: spermine is converted to spermidine in vivo by the FMS1-amine oxidase. Proc Natl Acad Sci U S A 2003; 100:13869-74; PMID:14617780; http://dx.doi.org/10.1073/pnas.1835918100
- Silva GM, Finley D, Vogel C. K63 polyubiquitination is a new modulator of the oxidative stress response. Nat Struct Mol Biol 2015; 22:116-23; PMID:25622294; http://dx.doi.org/10.1038/nsmb.2955
- Mortimer RK, Romano P, Suzzi G, Polsinelli M. Genome renewal: a new phenomenon revealed from a genetic study of 43 strains of Saccharomyces cerevisiae derived from natural fermentation of grape musts. Yeast 1994; 10:1543-52; PMID:7725789; http://dx.doi.org/10.1002/yea.320101203
- Lewinska A, Miedziak B, Wnuk M. Assessment of yeast chromosome XII instability: single chromosome comet assay. Fungal Genet Biol 2014; 63:9-16; PMID:24333410; http://dx.doi.org/10.1016/j.fgb.2013.12.003
- Krol K, Brozda I, Skoneczny M, Bretne M, Skoneczna A. A genomic screen revealing the importance of vesicular trafficking pathways in genome maintenance and protection against genotoxic stress in diploid Saccharomyces cerevisiae cells. PLoS One 2015; 10:e0120702; PMID:25756177; http://dx.doi.org/10.1371/journal.pone.0120702
- Dworak N, Wnuk M, Zebrowski J, Bartosz G, Lewinska A. Genotoxic and mutagenic activity of diamond nanoparticles in human peripheral lymphocytes in vitro. Carbon 2014; 68:763-76; http://dx.doi.org/10.1016/j.carbon.2013.11.067
- Andrews S. FastQC: a quality control tool for high throughput sequence data. http://wwwbioinformaticsbabrahamacuk/projects/fastqc 2010
- Li H, Durbin R. Fast and accurate short read alignment with Burrows-Wheeler transform. Bioinformatics 2009; 25:1754-60; PMID:19451168; http://dx.doi.org/10.1093/bioinformatics/btp324
- Li H, Handsaker B, Wysoker A, Fennell T, Ruan J, Homer N, Marth G, Abecasis G, Durbin R. The Sequence Alignment/Map format and SAMtools. Bioinformatics 2009; 25:2078-9; PMID:19505943; http://dx.doi.org/10.1093/bioinformatics/btp352
- Quinlan AR, Hall IM. BEDTools: a flexible suite of utilities for comparing genomic features. Bioinformatics 2010; 26:841-2; PMID:20110278; http://dx.doi.org/10.1093/bioinformatics/btq033
- Garisson E, Marth G. Haplotype-based variant detection from short-read sequencing. arXiv 2012:1207.3907 [q-bio.GN]. Available at http://arxiv.org/abs/1207.3907
- Cingolani P, Platts A, Wang le L, Coon M, Nguyen T, Wang L, Land SJ, Lu X, Ruden DM. A program for annotating and predicting the effects of single nucleotide polymorphisms, SnpEff: SNPs in the genome of Drosophila melanogaster strain w1118; iso-2; iso-3. Fly (Austin) 2012; 6:80-92; PMID:22728672; http://dx.doi.org/10.4161/fly.19695
- McLaren W, Pritchard B, Rios D, Chen Y, Flicek P, Cunningham F. Deriving the consequences of genomic variants with the Ensembl API and SNP Effect Predictor. Bioinformatics 2010; 26:2069-70; PMID:20562413; http://dx.doi.org/10.1093/bioinformatics/btq330
- Mi H, Muruganujan A, Casagrande JT, Thomas PD. Large-scale gene function analysis with the PANTHER classification system. Nat Protoc 2013; 8:1551-66; PMID:23868073; http://dx.doi.org/10.1038/nprot.2013.092
- Wnuk M, Miedziak B, Kulak K, Panek A, Golec E, Deregowska A, Adamczyk J, Lewinska A. Single-cell analysis of aneuploidy events using yeast whole chromosome painting probes (WCPPs). J Microbiol Methods 2015; 111:40-9; PMID:25639739; http://dx.doi.org/10.1016/j.mimet.2015.01.022