
ABSTRACT
MYC is a key driver of cellular transformation and is deregulated in most human cancers. Studies of MYC and its interactors have provided mechanistic insight into its role as a regulator of gene transcription. MYC has been previously linked to chromatin regulation through its interaction with INI1 (SMARCB1/hSNF5/BAF47), a core member of the SWI/SNF chromatin remodeling complex. INI1 is a potent tumor suppressor that is inactivated in several types of cancers, most prominently as the hallmark alteration in pediatric malignant rhabdoid tumors. However, the molecular and functional interaction of MYC and INI1 remains unclear. Here, we characterize the MYC-INI1 interaction in mammalian cells, mapping their minimal binding domains to functionally significant regions of MYC (leucine zipper) and INI1 (repeat motifs), and demonstrating that the interaction does not interfere with MYC-MAX interaction. Protein-protein interaction network analysis expands the MYC-INI1 interaction to the SWI/SNF complex and a larger network of chromatin regulatory complexes. Genome-wide analysis reveals that the DNA-binding regions and target genes of INI1 significantly overlap with those of MYC. In an INI1-deficient rhabdoid tumor system, we observe that with re-expression of INI1, MYC and INI1 bind to common target genes and have opposing effects on gene expression. Functionally, INI1 re-expression suppresses cell proliferation and MYC-potentiated transformation. Our findings thus establish the antagonistic roles of the INI1 and MYC transcriptional regulators in mediating cellular and oncogenic functions.
Introduction
The dynamic organization of chromatin in conjunction with transcription factors and chromatin regulatory proteins is critical to the coordination of gene expression. In recent years, deregulated epigenetic proteins and processes have been shown to mediate oncogenesis.Citation1,2 The c-MYC (MYC) protein is key driver of cellular transformation and is deregulated in more than half of all human cancers.Citation3 As a transcription factor of the basic helix-loop-helix leucine zipper (bHLHLZ) family, MYC binds to site-specific E-box sequences to regulate gene transcription together with its heterodimeric partner, MAX.Citation4,5 This interaction is critical for the diverse set of biological functions that MYC controls, including cell growth, proliferation, apoptosis, and transformation.Citation6,7 MYC interaction with additional chromatin regulators can modulate the transcriptional activity and specificity of MYC, though this area is underexplored.Citation8,9
An early link between MYC and epigenetic regulation is the interaction of MYC and INI (SMARCB1/hSNF5/BAF47), a core member of the SWI/SNF chromatin remodeling complex.Citation10 INI1 is a potent tumor suppressor as evident by mouse models and the identification of biallelic inactivating mutations in nearly all cases of pediatric malignant rhabdoid tumors.Citation11-13 Moreover, mutations in INI1 and other subunits of the SWI/SNF complex have been identified in recent whole genome and exome sequencing studies in a wide spectrum of cancer types, making this complex one of the most frequently mutated chromatin regulatory complexes in human cancers.Citation14,15 Despite this striking association with cancer, the mechanistic understanding of how INI1 contributes to oncogenesis and its biological and molecular link to MYC remain unclear. Herein, we characterize the molecular interaction and transcriptional network of MYC and INI1 and demonstrate their opposing roles in regulating transcription and cellular transformation.
Results
MYC interacts with INI1 and is dependent on the leucine zipper region
Evidence of a MYC-INI1 interaction was previously demonstrated in vitro and in HEK293T cells.Citation10 To determine whether this interaction occurs in other cell types, we performed endogenous co-immunoprecipitation on a panel of cell lines derived from breast (SK-BR3, T47D) and lung (A549, NCI-H520) carcinomas. Nuclear extracts were immunoprecipitated with a MYC-specific antibody (N262) or immunoglobulin G (IgG) control, followed by immunoblotting to detect endogenous INI1 and MYC (). INI1 co-immunoprecipitated with MYC in all 4 cell lines, indicating an endogenous interaction in multiple cell types.
Figure 1. MYC interacts with INI1 and is dependent on the leucine zipper region. (A) Nuclear extracts from SK-BR3, T47D, A549, and NCI-H520 cells were immunoprecipitated with a MYC-specific antibody (N262) or species-matched immunoglobulin G (IgG) and immunoblotted for INI1 and MYC expression, with 10% input included to assess protein expression. (B) Schematic representations of INI1 (GST-INI 183–294) and MYC (His-MYC 250–439 and 353–434) recombinant fusion proteins, with protein regions and amino acid positions indicated. Rpt I: Repeat I, Rpt II: Repeat II, b: basic region, HLH: helix-hoop-helix, LZ: leucine zipper. (C) Recombinant proteins were bacterially expressed and purified. GST or GST-INI1 183–294 (100 μg) were bound to glutathione sepharose beads and incubated with 100 μg of His-MYC 250–439 or His-MYC 353–434. Complexes were eluted and resolved by SDS-PAGE and visualized by Coomassie staining. (D) Schematic representations of wild-type MYC and C-terminal scanning deletion mutants. MB: MYC homology box. (E) Nuclear extracts of HO15.19 MYC deletion mutant panel were immunoprecipitated with a MYC-specific antibody or IgG and immunoblotted for INI1 and MYC expression, with 10% input included. Three independent experiments were performed with representative results shown for all immunoblots.

To validate that this interaction is direct and begin to narrow in on the regions important for this interaction, we next performed an in vitro binding assay using a glutathione-S-transferase (GST)-tagged INI1 fragment encompassing the amino acid residues 183 to 294 (GST-INI1 183–294) with purified recombinant His-tagged MYC 250–439 and 353–434 (). GST-INI1 183–294 or GST control was bound to glutathione agarose beads and subsequently incubated with the His-MYC C-terminal fragments. Binding of both MYC fragments was observed with GST-INI 183–294 but not GST control (). Thus, INI1 residues 183–294 directly bind MYC residues 353–434, which contain the bHLHLZ region, in the absence of additional cofactors.
To further identify the minimal functional region of MYC required for interaction with INI1 in mammalian cells, we evaluated a panel of previously characterized C-terminal scanning mutantsCitation16 for their ability to interact with endogenous INI1. The MYC deletion mutants spanned residues 265–433, which included MYC homology box (MB) IIIb and IV, as well as the basic, HLH, and LZ regions (). The mutants were stably introduced into the MYC-null HO15.19 cells to eliminate the confounding effects of endogenous MYC. Nuclear extracts were immunoprecipitated with a MYC-specific antibody (3C7) that detects all C-terminal mutants,Citation17 and immunoblotted for the presence of INI1. In this system, both alternatively spliced isoformsCitation18 of INI1 were expressed and co-immunoprecipitated with wild-type MYC, while the MYC-null control showed no INI1 co-immunoprecipitation (). Deletion of residues 265–317 and the basic region did not abrogate interaction with either INI1 isoform, while deletion of HLH retains interaction with the lower molecular weight isoform (). Neither INI1 isoforms co-immunoprecipitated with MYC lacking the LZ (). The MYC LZ region (residues 407–439) thus encompasses the minimal site of interaction with both INI1 isoforms.
The MYC-INI1 interaction does not interfere with the MYC-MAX interaction
As the MYC-INI1 interaction is dependent on the LZ region, and MAX interacts with MYC through the HLHLZ region, we next sought to investigate how INI1 affects the MYC-MAX interaction. To determine if MYC can bind both MAX and INI1, we immunoprecipitated whole cell extracts from 2 human cell lines (NCI-H520 and SK-BR3) with a MYC-specific antibody or IgG, and subsequently assayed for INI1 and MAX detection by immunoblot. Both INI1 and MAX were co-immunoprecipitated with MYC (), suggesting MYC interacts with both partner proteins in endogenous settings.
Figure 2. MYC and INI1 interact independently of MYC-MAX heterodimerization. (A) Whole cell extracts from SK-BR3 and NCI-H520 cells were immunoprecipitated with a MYC-specific antibody or IgG and immunoblotted for INI1, MAX, and MYC expression, with 10% input included. (B) Schematic representation of LZ regions of MYC, MAX, MYC-EG, and MAX-EG. Lines and bold colored letters indicate positions of exchange residues. (C) Whole cell extracts from HO15.19 cells expressing ectopic wild-type MYC, MYC-EG, MYC-EG/MAX-EG, MAX, or vector control were immunoprecipitated with MYC, INI1, or MAX antibodies or IgG control and immunoblotted for MYC, INI1, and MAX detection, with 10% input included. Three independent experiments were performed with representative results shown for all immunoblots.
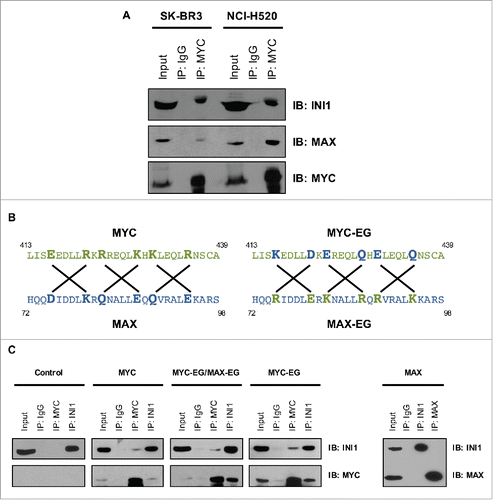
To determine whether INI1 interacts with the MYC-MAX heterodimer, we used the HO15.19 MYC-EG/MAX-EG system.Citation6 These MYC-null cells have been stably infected with mutant forms of human MYC (MYC-EG) and MAX (MAX-EG), whose key residues within their LZ regions have been exchanged, thereby disabling heterodimerization with their respective endogenous partner proteins, but maintaining the interaction with each other (). Concomitant expression of MYC-EG and MAX-EG is necessary to mimic wild-type MYC function in restoring proliferation, transformation, autosuppression, and apoptosis.Citation6,7,19 We performed reciprocal MYC and INI1 co-immunoprecipitation and demonstrated that MYC and INI1 interact in cells expressing both MYC-EG and MAX-EG, and their interaction remained intact in cells expressing only MYC-EG, indicating that the MYC-INI1 interaction is not dependent on MYC-MAX heterodimerization (, left). Reciprocal co-immunoprecipitation of MAX and INI1 did not show interaction of MAX and INI1 in the absence of MYC (). Taken together, these results indicate that INI1 interaction with MYC does not depend on or interfere with MYC-MAX heterodimerization.
MYC interacts with the conserved Repeat I and II regions of INI1
The INI1 protein comprises an N-terminal region of uncharacterized structure and function and a C-terminal SNF5 Homology Domain (residues 186 to 378; ). The latter domain contains two imperfect repeat regions (Repeats (Rpt) I and II) that are nodes for protein-protein interaction.Citation10,20-23 To investigate the region of INI1 required for the MYC-INI1 interaction in mammalian cells, we generated a series of FLAG-tagged truncation mutants and deletion mutants within this region (). To assess the mutants' subcellular localization and expression, HEK293Tv cells were transiently transfected and then fractionated for chromatin, nuclear, and cytoplasmic fractions. Expression of FLAG-tagged INI1 and INI1 mutants and fraction-specific proteins (tubulin for cytoplasmic fraction and acetylated histone H3 for chromatin fraction) was assessed by immunoblotting (). All mutants were expressed in the nuclear and/or chromatin fractions. The Rpt I mutant was localized predominantly in the nuclear fraction, although longer autoradiographic exposures of immunoblots demonstrated evidence of weak expression in the chromatin fraction (data not shown). Thus, the expression and chromatin localization of the panel of INI1 mutants can be applied to map regions of interaction with MYC.
Figure 3. MYC interacts with the conserved Repeat motifs of INI1. (A) Schematic representation of wild-type INI1 and truncation and deletion mutants, with protein regions and amino acid positions indicated. NLS: nuclear localization signal. (B) HEK293Tv cells were transiently transfected with wild-type INI1 or INI1 mutants. Cells were harvested for fractionation 48 hours post-transfection. Cytoplasmic (C), nuclear (N), and chromatin (Chr) fractions were immunoblotted for INI1 expression, with tubulin and acetylated histone 3 (AcH3) as cytoplasmic and chromatin fraction controls, respectively. (C) Whole cell extracts from transiently transfected HEK293Tv cells were immunoprecipitated with a MYC-specific antibody or IgG and immunoblotted for INI1 (with FLAG antibody) and MYC expression, with 5% input included. Three independent experiments were performed with representative results shown for all immunoblots.
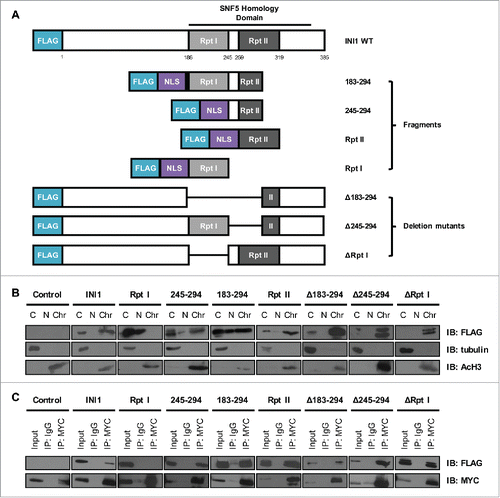
To identify the minimal region of interaction with MYC in cells, we performed co-immunoprecipitation analysis from whole cell extracts in transiently transfected HEK293Tv cells. We demonstrated that INI1 fragments of Rpt II (residues 259–319), residues 183–294, and 245–294, but not Rpt I, co-immunoprecipitated with MYC (), suggesting that residues 259–294 of Rpt II were sufficient for MYC interaction. However, since the Rpt I fragment was expressed in the nuclear fraction, but not abundantly expressed in the chromatin fraction, it is difficult to evaluate whether the lack of interaction with this Rpt I fragment is due to its lack of localization to chromatin or because this region is not essential for interaction. In addition, co-immunoprecipitation of MYC and three INI1 deletion mutants lacking Rpt I (ΔRpt I), residues 183–294 (Δ183–294), or 245–294 (Δ245–294) demonstrated MYC interaction with all three deletion mutants (). These results suggest that multiple regions of INI1, including the two imperfect repeat motifs (Rpt II residues 259–294 and Rpt I) are likely to interact with MYC.
MYC and INI1 interact with chromatin complexes
To extend the interaction network of MYC and INI1, we analyzed previously reported protein-protein interactions of MYC, MAX, and INI1. We determined an extensive network of proteins with connection to the MYC-MAX-INI1 complex, suggesting the MYC-INI1 interaction may be part of a larger transcriptional complex network (Fig. S1). In addition to members of the SWI/SNF complex, many of the proteins in this network belong to other multi-subunit complexes, such as the NuA4 and STAGA histone acetyltransferase complexes, Sin3 and NuRD histone deacetylase complexes, and MLL histone methyltransferase complexes (Fig. S1). Proteins of the SWI/SNF complex and these other chromatin regulatory complexes were also identified as MYC-interacting proteins in our recent proteomic study of the MYC interactome.Citation24 This suggests that the MYC-INI1 complex may involve other chromatin regulatory complexes and proteins to modulate transcriptional activity and the epigenetic landscape.
MYC and INI1 share common target genes and oppositely regulate gene expression
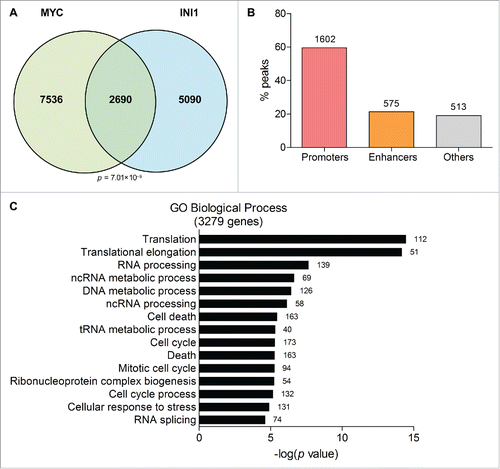
Having established the physical interaction of MYC and INI1, we next investigated the DNA regions and target genes that MYC and INI1 share. We utilized chromatin immunoprecipitation sequencing (ChIP-seq) datasets for MYC and INI1 in HeLa-S3 cells from the Encyclopedia of DNA Elements (ENCODE) Consortium.Citation25,26 We determined that MYC and INI1 have significant coincident DNA-binding peaks using a peak intersection analysis (BEDTools)Citation27 and Genome Structure Correction (GSC)Citation28 statistical significance test (p=7.01×10⁻⁹). Of the 10,226 MYC peaks and 7,780 INI1 peaks, 2,690 were overlapping, corresponding to 26% of total MYC peaks and 35% of total INI1 peaks (). We next determined the genomic regions on which MYC and INI1 co-occupy. Promoters were defined as regions 3 kb up- and downstream of transcriptional start sites (TSSs) and putative enhancers were defined as regions 50 kb up- and downstream of TSSs that also overlap with the enhancer histone mark, H3K4me1. Based on these criteria, out of the 2,690 MYC-INI1 peaks, 1,602 peaks (60%) mapped to promoters, 575 peaks (21%) mapped to putative enhancers, and the remaining peaks were located at other regions (). Thus, the MYC-INI1 interaction may regulate target gene transcription from multiple regulatory loci. To identify target genes that may be regulated by MYC and INI1, we used Binding and Expression Target Analysis (BETA)Citation29 to locate the nearest gene to a peak that is bound by both MYC and INI1 and identified 3,279 genes that may be regulated by MYC and INI1 ( and Table S1). Gene ontology (GO) analysis for biological processes showed enrichment of genes related to translation, RNA and DNA processing and metabolism, cell death, and cell cycle ( and Table S2). Taken together, our results indicate that INI1 can bind to a large subset of MYC target genes.
Figure 4. INI1 binds to a subset of MYC DNA-binding regions and target genes. (A) ChIP-seq datasets from ENCODE for MYC and INI1 in HeLa-S3 cells were analyzed for overlapping DNA-binding regions by intersecting MYC and INI1 peaks (BEDTools). The numbers of overlapping and non-overlapping peaks are displayed in the Venn diagram. Statistical significance is determined by the Genome Structure Correction (GSC) test. (B) The 2,690 MYC and INI1 common peaks were mapped to genomic regions, including promoters (TSS ± 3 kb) and putative enhancers (TSS ± 50 kb overlapping with H3K4me1 regions) using BETA. The percent of peaks mapping to each region is shown, with the number of peaks indicated above each bar. (C) Target genes of the 2,690 MYC and INI1 common peaks were determined by proximity using BETA. GO analysis for biological processes (BP) was performed and the top 15 terms are shown with their adjusted p values. The number of genes belonging to each GO BP term is indicated beside each bar.
To further understand MYC and INI1 chromatin binding and their effects on gene expression, we utilized the INI1-null human rhabdoid tumor cell line G401, which lacks detectable INI1 protein and mRNA expression due to a homozygous deletion mutation.Citation30 INI1 is deleted in nearly all cases of pediatric malignant rhabdoid tumors.Citation13 This aggressive disease lacks targeted therapeutic optionsCitation31 and is a model tumor type to study the molecular functions of INI1 in the oncogenic process. Ectopic MYC and FLAG-tagged INI1 or their respective vector (GFP and pBABEpuro (pBp)) controls were sequentially and stably introduced into these cells through retroviral infection, and their expression was confirmed by immunoblot analysis (). We performed ChIP-qPCR to determine INI1 and MYC binding on a series of MYC target genes involved in processes such as cell cycle, cellular metabolism, and ribosomal and RNA processing. INI1 was immunoprecipitated with a FLAG antibody. Its binding was not evident in INI1-null cells, but was significantly enriched at the promoters of MYC activated genes (CCND1, CCNE2, CDK4, LDHA, and NCL) and MYC repressed genes (CDKN1A, CDKN2B, GADD45A, HES1) in G401 cells introduced with INI1 (). A region in chromosome 6 (chr6) was used as a negative control region. Endogenous MYC binding was confirmed at these target genes, with increased or similar levels of binding when ectopic MYC was introduced (, light orange and light teal bars). In the presence of INI1, endogenous MYC binding was not significantly affected at most target genes, but was decreased at GADD45A (, light and dark orange bars). In cells with ectopic MYC and INI1, MYC binding was significantly decreased at several target genes (CDK4, HSPE1, NCL, CDKN1A, CDKN2B, and GADD45A) compared with cells expressing only ectopic MYC (, light and dark teal bars). These data show that INI1 binds to MYC target gene promoters and may affect deregulated MYC binding to a subset of target genes.
Figure 5. MYC and INI1 bind to common target genes and have opposing effects on gene expression in rhabdoid tumor cells. (A) Left: G401 rhabdoid tumor cells were retrovirally infected with MYC or GFP vector control. Expression of MYC was confirmed by immunoblotting. Right: G401 expressing ectopic MYC or GFP control were subsequently retrovirally infected with FLAG-INI1 or pBABEpuro (pBp) vector control. MYC and INI1 (using INI1 and FLAG antibodies) expression was confirmed by immunoblotting. (B) ChIP-qPCR was performed on the panel of G401 cells on the promoters of a series of MYC activated (CCND1, CCNE2, CDK4, HSPE1, LDHA, and NCL), MYC repressed (CDKN1A, CDKN2B, GADD45A, HES1) genes, and the MYC gene. A region in chromosome 6 (chr6) was used as negative control. FLAG-INI1 was immunoprecipitated with a FLAG-specific antibody. Immunoprecipitated DNA is represented as a percentage of total input DNA (% input). Mean % input ± SEM for 3 independent experiments is shown. * p<0.05, ** p<0.01, *** p<0.001, **** p<0.0001, one-way ANOVA with Tukey post test. (C) ChIP-qPCR was performed as in , but immunoprecipitated with a MYC-specific antibody. Mean % input ± SEM for 3 independent experiments is shown. * P < 0.05, ** P < 0.01, *** P < 0.001, **** P < 0.0001, one-way ANOVA with Tukey post test. (D) mRNA expression of a series of MYC activated and repressed genes was evaluated in the G401 panel by qPCR. Gene expression is presented as log2(fold change) relative to G401 cells with both empty vectors. The heatmap depicts degree of up-regulated (red) and down-regulated (blue) expression changes, with each small square representing the value of one biological replicate. Specific expression values and statistical significance are shown in Figure S1.
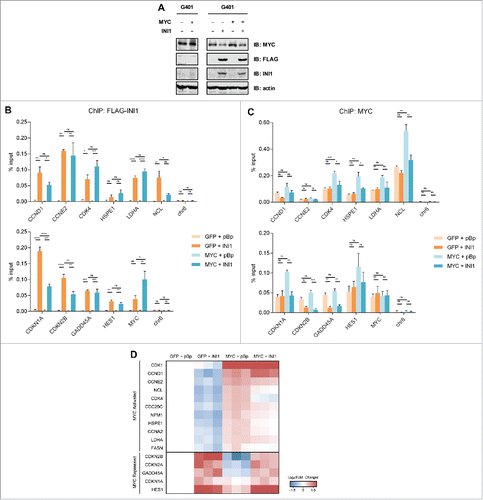
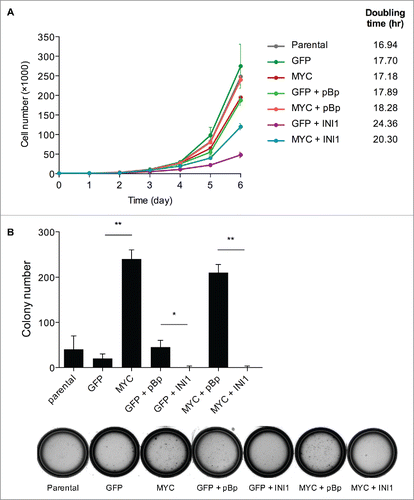
Figure 6. MYC and INI1 antagonistically regulate proliferation and transformation. (A) Proliferation of the G401 panel was assessed using a Coulter Counter every 24 hours to quantitate cell number. Mean cell number ± SD for 3 independent experiments performed in triplicate is shown. (B) G401 cells with ectopic MYC and/or INI1 were grown in 0.3% Noble agar + 10% FBS-DMEM H21 and the number of colonies was scored 3 weeks post-seeding. Mean colony number ± SD for 3 independent experiments is shown. * p<0.05, ** p<0.01, one-way ANOVA with Bonferroni post test. Representative colony images are shown.
We next evaluated the mRNA expression of a series of MYC activated and repressed genes in this panel of G401 cells ( and S2). Comparing vector control G401 cells to G401 cells with ectopic INI1 expression, MYC activated genes were consistently down-regulated and MYC repressed genes were up-regulated. With ectopic MYC expression, the majority of MYC activated genes were further up-regulated, while MYC repressed genes were trending toward down-regulation or not significantly affected; this may be because these genes were already expressed at low levels in G401 cells and cannot be further repressed. In cells expressing both ectopic MYC and INI1, most MYC activated genes were down-regulated and MYC repressed genes were up-regulated compared to cells expressing ectopic MYC only. Interestingly, INI1 binding showed significant enrichment at the MYC promoter with ectopic MYC expression (), but the expression of MYC mRNA was not significantly impacted by INI1 (Fig. S2). However, MYC protein level was decreased in the presence of INI1 (), suggesting INI1 may also regulate MYC levels through post-translational means. Collectively, these results demonstrate that INI1 has opposing effects on the expression of MYC target genes compared to MYC.
INI1 abrogates MYC-potentiated transformation
As MYC and INI1 bind to and regulate the expression of key cell cycle genes (), we sought to determine their effects on cell proliferation (). G401 cells expressing ectopic MYC proliferated similarly as parental and vector control cells with a doubling time of approximately 17 hours. Ectopic expression of INI1 slowed proliferation compared to control cells, increasing doubling time to 24 hours, while ectopic INI1 and MYC increased doubling time to 20 hours. This suggests that ectopic MYC expression can partially rescue INI1 inhibited proliferation.
We next evaluated whether INI1 affects MYC-potentiated transformation by assaying anchorage-independent colony formation in soft agar (). Parental and vector control G401 cells had similar colony forming ability. Ectopic MYC potentiated colony formation by approximately five-fold relative to control cells. Thus, the transforming ability of G401 cells was not saturated by the activity of endogenous MYC because ectopic MYC expression can further potentiate colony formation. Conversely, INI1 fully abrogated colony formation in control and ectopic MYC expressing cells. This suggests that INI1 has the capacity to counter the transforming ability of G401 cells with endogenous and ectopic levels of MYC. Taken together, these results establish the opposing functional association between MYC and INI1, in which MYC potentiates and INI1 suppresses cellular transformation in rhabdoid tumor cells.
Discussion
MYC and INI1 are well established oncoprotein and tumor suppressor, respectively, yet their molecular interaction and biological interplay have been largely unexplored since the initial description of their physical interaction.Citation10 Here, we characterize the molecular interaction of MYC and INI1 and demonstrate an antagonistic relationship between the two proteins in regulating transcription and driving oncogenic processes. We show that endogenous MYC and INI1 interact in different cell types and this interaction is direct and independent of additional co-factors, including MAX. Interestingly, MYC and INI1 co-immunoprecipitate in two cell lines deficient for members of the SWI/SNF complex (A549 is BRG1 (SMARCA4)-deficient and T47D is ARID1A-deficient). Cancers deficient for BRG1 or ARID1A have been shown to retain a residual SWI/SNF complex containing INI1 and their highly similar subunits BRM (SMARCA2) or ARID1B, respectively.Citation32,33 We and others observe that MYC can interact with other members of the SWI/SNF complex,Citation24,34 but whether these interactions occur directly or are mediated by INI1 remains unknown. MYC may therefore interact with INI1 despite the loss or alteration of other SWI/SNF complex members or through interaction with multiple members of the complex. We have also delineated their minimal regions of interaction in mammalian systems. MYC interacts with both functionally similar INI1 isoformsCitation18 through the LZ region, which is essential for MAX dimerization as well as the regulation of MYC-dependent proliferation and transformation.Citation6,7 Our findings in mammalian cells support and refine the in vitro study that defined the MYC bHLHLZ as the region of interaction for INI1 and showed deletion of LZ can attenuate interaction with INI1.Citation10
All known INI1 interactors, including MYC, map their binding regions to the SNF5 Homology Domain, which contains Rpt I and II.Citation35 Our interaction mapping have determined the INI1 minimal binding region contains a portion of Rpt II (residues 259–294). Previous two-hybrid results also show that the region of residues 183–294 (containing Rpt I and a portion of Rpt II) is a MYC-interacting region.Citation10 As Rpt I and II are imperfect repeats with 40% sequence identity,Citation35 it is possible MYC can bind either or both regions. Furthermore, INI1 deletion of residues 183–294 retains interaction with MYC in cells, suggesting other INI1 regions can interact with MYC. This reflects the multivalent nature of MYC-protein interactions, seen with other MYC interactors such as TRRAP, BIN1, and SKP2.Citation9,36-38 The tumor suppressive activity of INI1 is dependent on the Rpt motifs, and truncation and point mutations affecting these regions are also seen in rhabdoid tumors, reinforcing the important role of this region in tumor suppression.Citation12,39,40 Thus, we show the interaction of MYC and INI1 through two functionally significant regions, the latter of which can be disrupted in tumors with absent or mutated INI1 protein.
MYC is considered a master regulator of transcription as it binds to and potentially regulates 10–15% of the genome.Citation41,42 Genome-wide analyses of INI1 and other SWI/SNF complex members also reveal the widespread and diverse nature of their chromatin binding.Citation25 To further characterize MYC and INI1 transcriptional regulation, we have analyzed genome-wide datasets and find that a significant portion (26%) of MYC-bound regions is also bound by INI1. These regions correspond to both promoter and enhancer regions. The SWI/SNF complex has been implicated in bridging chromosomal looping interactions.Citation43-46 Thus transcriptional regulation by the MYC-INI1 complex may also occur through long-range enhancer-promoter interactions. Target gene analysis indicates the genes regulated by MYC and INI1 are enriched for those involved in translation, RNA processing and metabolism, and cell cycle. These results suggest that INI1 may exert its activity by regulating a portion of MYC target genes from different genomic regulatory loci.
INI1 is a potent tumor suppressor. Its biallelic loss is often the sole genetic feature of rhabdoid tumors, a highly aggressive pediatric cancer commonly located in the kidney, central nervous system, and other soft tissues.Citation12,15,47,48 This cancer's poor outcome and lack of molecular therapeutic targets have prompted further mechanistic insight into loss-of-INI1-driven oncogenesis. Our findings relate the opposing transcriptional regulatory roles of INI1 and MYC to their antagonistic contributions to oncogenic functions. When INI1 is introduced into INI1-deficient rhabdoid tumor cells, INI1 binds to MYC-bound target genes and decrease MYC binding to selective target genes. INI1 also opposingly regulate the expression of MYC activated genes (including drivers of cell cycle progression, cellular metabolism, and ribosome and RNA processing) and repressed genes (such as inhibitors of cell cycle progression). Thus, INI1 may alter MYC binding and/or transcriptional activity to regulate these genes. Previous studies in rhabdoid tumors demonstrate that INI1 can mediate cell cycle arrest by binding and repressing cyclin D1 (CCND1) and activating cyclin-dependent kinase inhibitors, p16INK4A (CDKN2A) and p21CIP1 (CDKN1A).Citation49-53 Our results implicate the chromatin interaction of MYC and INI1 in the regulation of these targets as well as a broader program of genes involved in cell growth and proliferation. Functionally, the antagonistic relationship between MYC and INI1 is reflected in cellular proliferation and transformation in rhabdoid tumor cells, in which INI1 suppresses MYC-potentiated anchorage-independent colony formation. These observations are consistent with genomic sequencing and expression analyses of primary rhabdoid tumors, which show an extremely low rate of DNA mutations accompanying the universal hallmark loss of INI1 activity, yet up-regulation of MYC target gene network is a feature of these INI1-deficient tumors.Citation48,54
Collectively, our results demonstrate that MYC and INI1 directly interact, and their regions of interaction map to functionally important regions of both proteins, including the MYC LZ and the INI1 Rpt motifs. We show that MYC and INI1 antagonistically regulate transcription and oncogenic processes, which suggests that INI1 mediates tumor suppression in part through its interaction with MYC to regulate MYC target genes and biological functions, including proliferation and transformation. In cancers with loss of INI1 expression, this interaction would be disrupted and may lead to deregulated MYC activity. Though the loss of INI1 cannot be therapeutically targeted directly, our findings suggest that inhibiting MYC may be a therapeutic target in INI1-deficient tumors such as malignant rhabdoid tumors that lack treatment options. Recent studies suggest targeting the MYC pathway at different levels, including MYC transcription.Citation55,56 MYC-MAX interaction,Citation57-59 and downstream functions,Citation60,61 are promising anti-cancer avenues. Recurrent mutations in other subunits of the SWI/SNF complex have been recently identified in different cancer types.Citation14,15 Understanding the molecular and biological link between MYC and other SWI/SNF complex subunits may reveal novel insights into oncogenesis and therapeutic targets.
Materials and methods
Cell culture
Phoenix Eco, HEK293Tv (a kind gift of Dr. Sam Benchimol, York University), and G401 (a kind gift of Dr. Rod Bremner, University of Toronto) cells were maintained in Dulbecco's Modified Eagle Media (DMEM) H21 supplemented with antibiotics (100 U/mL penicillin and 100 μg streptomycin) and 10% fetal bovine serum (FBS; Gibco). HO15.19 cells were cultured in DMEM H21 with antibiotics and 10% calf serum (Gibco). A549 cells were grown in α-MEM containing 10% FBS and antibiotics. SK-BR3 cells were maintained in McCoy's 5A media with 10% FBS and antibiotics. NCI-H520 cells were cultured in RPMI 1640 with 10% FBS and antibiotics. T47D cells were maintained in RPMI 1640 with antibiotics, 10% FBS, and supplemented with 0.2 U/mL human insulin (Sigma Chemical).
Retroviral infections
Phoenix Eco cells were transfected with retroviral constructs by calcium phosphate precipitation. Viral supernatant was harvested 48 hours post-transfection and used to infect HO15.19 and G401 cells. Cells infected with MYC vectors were selected by fluorescence activated cell sorting (Becton Dickinson FACStarPlus) for GFP expressed from a bicistronic retroviral vector. INI1 infected cells were isolated by puromycin selection (1 μg/μL) (Sigma Chemical).
Plasmids
MYC deletion mutants, Δ265–317, Δ371–412, and Δ414–433, were subcloned from the vector pDORneo into the retroviral vector, pBabeMNiresGFP (a kind gift from Dr. Gary Nolan).Citation62,63 Wild type human MYC cDNA was used as a template to produce Δb and previously described.Citation64 MYC-EG, MAX-EG, and MAX plasmids have been previously described.Citation6 pBabepuro-FLAG-INI1 was a kind gift from Dr. Anthony Imbalzano, University of Massachusetts.Citation65 The coding region of INI1 was subcloned into the transient expression vector, CMV10–1XFLAG using EcoRI. The INI1 deletion mutants were generated by PCR-based site directed mutagenesis as NLS-Kozak-INI1 fragments and were cloned into the transient expression vector, CMV10–1XFLAG using EcoRI. The recombinant fusion protein, GST-INI1 183–294 was cloned into the pGEX-2TK expression vector (Amersham Pharmacia); His-MYC 250–439 and 353–434 were cloned into the pET-15b expression vector (Novagen) using 5′-NdeI and 3′-BamHI sites.
Protein extraction and immunoblotting
Whole cell extracts were isolated in Triton buffer (25 mM HEPES pH 7.7, 0.3 M NaCl, 1.5 mM MgCl2, 0.2 mM EDTA, 0.1% Triton X-100, 0.5 mM DTT, 1X protease inhibitor mix). Cell fractionations were previously described.Citation66 For co-immmunoprecipitation, whole cell or nuclear extracts were harvested in lysis buffer (15 mM Tris-HCl pH 7.4, 0.5 M NaCl, 0.35% IGEPAL, 5 mM EDTA, 5 mM EGTA, 1 mM PMSF, 1X protease inhibitor mix) and immunoprecipitated using homemade rabbit polyclonal antibodies raised against MYC (N262), generated as described elsewhereCitation67 or INI1 and 50 μL of protein G sepharose (GE Healthcare). After washes, immunoprecipitates were analyzed by immunoblotting. For immunoblotting, protein lysates were quantified by Bradford protocol, and 40 μg to 50 μg were resolved by SDS-PAGE (7% to 12%). Antibodies against MYC (9E10, 3C7 made in house; 1:1000), FLAG (Sigma; 1:1000), INI1 (BD Biosciences, Santa Cruz; 1:500), MAX (Santa Cruz; 1:500), tubulin (Calbiochem; 1:5000), or actin (Sigma; 1:3000). Proteins were visualized by chemiluminescence reagents (PerkinElmer) and exposed to BioFlex MSI film (Clonex Corp.), or by IRDye fluorescent secondary antibodies and Odyssey imager (LI-COR).
Biochemical protein purification
GST fusion proteins were bacterially expressed from pGEX-INI1 183–294 vector and purified as described elsewhere.Citation68 His-MYC fusion proteins were bacterially expressed from pET-15b-MYC 250–439 and pET-15b-MYC 353–434 vectors and purified as described elsewhere.Citation69
Protein-protein interaction analysis
Physical protein-protein interactions were identified using Interologous Interaction Database (I2D) version 2.2 (http://ophid.utoronto.ca/i2d).Citation70,71 I2D integrates interaction from curated databases (e.g. IntAct, BioGRID, MINT, HPRD), high-throughput datasets (e.g., Y2H, MS), and orthologs across human, rat, mouse, fly worm, and yeast. In this manuscript, we only considered experimentally detected interactions, excluding orthologous predictions. Network analysis and visualization was performed in NAViGaTOR version 2.3 (http://ophid.utoronto.ca/navigator).Citation72
ChIP binding region and target gene analyses
ChIP-seq datasets were obtained from the Encyclopedia of DNA Elements (ENCODE) ConsortiumCitation26 (MYC ChIP-seq in HeLa-S3: ENCODE Data Coordination Centre (DCC) accession: ENCSR000EZD; SMARCB1/INI1 ChIPs-seq in HeLa-S3: DCC accession: ENCSR000EDK). Overlapping peaks of at least one nucleotide between 2 datasets were obtained using the intersection function of BEDTools version 2.18.Citation27 Statistical analysis for coincident binding was determined using the GSC testCitation28; statistical significance was determined at p < 0.5. Putative target genes and genomic regions were identified using BETA version 1.0.6.Citation29 GO analyses were performed using the Database for Annotation, Visualization and Integrated Discovery (DAVID) version 6.7.Citation73,74
ChIP-qPCR
ChIP was performed as described previously with slight modifications.Citation75 Briefly, cells were harvested after crosslinking in 1% formaldehyde for 15 minutes followed by incubating in 0.125 M glycine for 5 minutes. Ten million (107) cells per ChIP reaction were lysed, sonicated with Bioruptor Pico (Diagenode), and incubated with antibodies against MYC (homemade N262), FLAG (Sigma), or IgG controls (Santa Cruz). After washes, DNA was purified using QIAquick PCR Purification Kit (Qiagen) and analyzed by quantitative real-time PCR (qPCR). Primers used are listed in Table S3.
Gene expression analysis
RNA was isolated using TRIzol and cDNA was synthesized as per the manufacturer's protocols (Invitrogen). Gene expression was analyzed by qPCR and normalized to ACTB. Primers used are listed in Table S3.
Cellular proliferation
Proliferation of G401 cells infected with MYC or INI1 was assessed as described elsewhere.Citation76 Population doubling times were calculated with GraphPad Prism v5.0a.
Colony formation in soft agar
Transformation in G401 cells was performed with seeding of 5,000 cells in 10% FBS DMEM H21 + 0.3% noble agar as described elsewhere.Citation76
Abbreviations
| BETA | = | Binding and Expression Target Analysis |
| bHLHLZ | = | basic helix-loop-helix leucine zipper |
| ChIP-seq | = | chromatin immunoprecipitation sequencing |
| DAVID | = | Database for Annotation, Visualization and Integrated Discovery |
| ENCODE | = | Encyclopedia of DNA Elements |
| GFP | = | green fluorescent protein |
| GO | = | gene ontology |
| GSC | = | Genome Structure Correction |
| GST | = | glutathione-S-transferase |
| I2D | = | Interologous Interaction Database |
| INI1 | = | integrase interactor-1 |
| MB | = | MYC homology box |
| MYC | = | c-MYC |
| NLS | = | nuclear localization signal |
| Rpt | = | Repeat motif |
| SWI/SNF | = | SWItch/Sucrose Non-Fermentable |
| TSS | = | transcriptional start site |
Disclosure of potential conflicts of interest
No potential conflicts of interest were disclosed.
KCCY_S_1146836.zip
Download Zip (892.4 KB)Acknowledgements
We thank all members of the Penn lab, Drs. Rod Bremner, Vuk Stambolic, and James Davie for helpful discussions.
Funding
This work was in part supported by the Canadian Institute of Health Research (MOP-275788 to LZP and BR) and Ontario Research Fund (GL2–01–030 to IJ and LZP). Computational analysis was in part supported by Canada Foundation for Innovation (12301, 203373, 29272, 225404, and 30865 to IJ) and IBM. LZP holds the Canada Research Chair (CRC) in Molecular Oncology; BR holds the CRC in Proteomics and Molecular Medicine; and IG holds the CRC in Integrative Cancer Informatics. WBT is supported by a Canadian Breast Cancer Research Ontario Region Doctoral Fellowship. AS was supported by an Ontario Graduate Scholarship. PCB was supported by the PreCarn Foundation, the National Sciences and Engineering Research Council of Canada, the Excellence in Radiation Research for the 21st Century (EIRR21) program, and the Ontario Institute for Cancer Research.
Related Research Data
References
- Shen H, Laird PW. Interplay between the cancer genome and epigenome. Cell 2013; 153:38-55; PMID:23540689; http://dx.doi.org/10.1016/j.cell.2013.03.008
- You JS, Jones PA. Cancer genetics and epigenetics: two sides of the same coin? Cancer Cell 2012; 22:9-20; PMID:22789535; http://dx.doi.org/10.1016/j.ccr.2012.06.008
- Meyer N, Penn LZ. Reflecting on 25 years with MYC. Nat Rev Cancer 2008; 8:976-90; PMID:19029958; http://dx.doi.org/10.1038/nrc2231
- Amati B, Dalton S, Brooks MW, Littlewood TD, Evan GI, Land H. Transcriptional activation by the human c-Myc oncoprotein in yeast requires interaction with Max. Nature 1992; 359:423-6; PMID:1406955; http://dx.doi.org/10.1038/359423a0
- Blackwood EM, Eisenman RN. Max: a helix-loop-helix zipper protein that forms a sequence-specific DNA-binding complex with Myc. Science 1991; 251:1211-7; PMID:2006410; http://dx.doi.org/10.1126/science.2006410
- Amati B, Brooks MW, Levy N, Littlewood TD, Evan GI, Land H. Oncogenic activity of the c-Myc protein requires dimerization with Max. Cell 1993; 72:233-45; PMID:8425220; http://dx.doi.org/10.1016/0092-8674(93)90663-B
- Amati B, Littlewood TD, Evan GI, Land H. The c-Myc protein induces cell cycle progression and apoptosis through dimerization with Max. EMBO J 1993; 12:5083-7; PMID:8262051
- Hann SR. MYC cofactors: molecular switches controlling diverse biological outcomes. Cold Spring Harb Perspect Med 2014; 4:a014399; PMID:24939054; http://dx.doi.org/10.1101/cshperspect.a014399
- Tu WB, Helander S, Pilstal R, Hickman KA, Lourenco C, Jurisica I, Raught B, Wallner B, Sunnerhagen M, Penn LZ. Myc and its interactors take shape. Biochim Biophy Acta 2014; 1849:469-83.
- Cheng SW, Davies KP, Yung E, Beltran RJ, Yu J, Kalpana GV. c-MYC interacts with INI1/hSNF5 and requires the SWI/SNF complex for transactivation function. Nat Genet 1999; 22:102-5; PMID:10319872; http://dx.doi.org/10.1038/8811
- Roberts CW, Galusha SA, McMenamin ME, Fletcher CD, Orkin SH. Haploinsufficiency of Snf5 (integrase interactor 1) predisposes to malignant rhabdoid tumors in mice. Proc Natl Acad Sci U S A 2000; 97:13796-800; PMID:11095756; http://dx.doi.org/10.1073/pnas.250492697
- Versteege I, Sevenet N, Lange J, Rousseau-Merck MF, Ambros P, Handgretinger R, Aurias A, Delattre O. Truncating mutations of hSNF5/INI1 in aggressive paediatric cancer. Nature 1998; 394:203-6; PMID:9671307; http://dx.doi.org/10.1038/28212
- Jackson EM, Sievert AJ, Gai X, Hakonarson H, Judkins AR, Tooke L, Perin JC, Xie H, Shaikh TH, Biegel JA. Genomic analysis using high-density single nucleotide polymorphism-based oligonucleotide arrays and multiplex ligation-dependent probe amplification provides a comprehensive analysis of INI1/SMARCB1 in malignant rhabdoid tumors. Clin Cancer Res 2009; 15:1923-30; PMID:19276269; http://dx.doi.org/10.1158/1078-0432.CCR-08-2091
- Kadoch C, Hargreaves DC, Hodges C, Elias L, Ho L, Ranish J, Crabtree GR. Proteomic and bioinformatic analysis of mammalian SWI/SNF complexes identifies extensive roles in human malignancy. Nat Genet 2013; 45:592-601; PMID:23644491; http://dx.doi.org/10.1038/ng.2628
- Biegel JA, Busse TM, Weissman BE. SWI/SNF chromatin remodeling complexes and cancer. Am J Med Genet C Semin Med Genet 2014; 166C:350-66; PMID:25169151; http://dx.doi.org/10.1002/ajmg.c.31410
- Stone J, de Lange T, Ramsay G, Jakobovits E, Bishop JM, Varmus H, Lee W. Definition of regions in human c-myc that are involved in transformation and nuclear localization. Mol Cell Biol 1987; 7:1697-709; PMID:3299053; http://dx.doi.org/10.1128/MCB.7.5.1697
- Evan GI, Lewis GK, Ramsay G, Bishop JM. Isolation of monoclonal antibodies specific for human c-myc proto-oncogene product. Mol Cell Biol 1985; 5:3610-6; PMID:3915782; http://dx.doi.org/10.1128/MCB.5.12.3610
- Reincke BS, Rosson GB, Oswald BW, Wright CF. INI1 expression induces cell cycle arrest and markers of senescence in malignant rhabdoid tumor cells. J Cell Physiol 2003; 194:303-13; PMID:12548550; http://dx.doi.org/10.1002/jcp.10201
- Facchini LM, Chen S, Marhin WW, Lear JN, Penn LZ. The Myc negative autoregulation mechanism requires Myc-Max association and involves the c-myc P2 minimal promoter. Mol Cell Biol 1997; 17:100-14; PMID:8972190; http://dx.doi.org/10.1128/MCB.17.1.100
- Kalpana GV, Marmon S, Wang W, Crabtree GR, Goff SP. Binding and stimulation of HIV-1 integrase by a human homolog of yeast transcription factor SNF5. Science 1994; 266:2002-6; PMID:7801128; http://dx.doi.org/10.1126/science.7801128
- Lee D, Kim JW, Seo T, Hwang SG, Choi EJ, Choe J. SWI/SNF complex interacts with tumor suppressor p53 and is necessary for the activation of p53-mediated transcription. J Biol Chem 2002; 277:22330-7; PMID:11950834; http://dx.doi.org/10.1074/jbc.M111987200
- Morozov A, Yung E, Kalpana GV. Structure-function analysis of integrase interactor 1/hSNF5L1 reveals differential properties of two repeat motifs present in the highly conserved region. Proc Natl Acad Sci U S A 1998; 95:1120-5; PMID:9448295; http://dx.doi.org/10.1073/pnas.95.3.1120
- Wu DY, Tkachuck DC, Roberson RS, Schubach WH. The human SNF5/INI1 protein facilitates the function of the growth arrest and DNA damage-inducible protein (GADD34) and modulates GADD34-bound protein phosphatase-1 activity. J Biol Chem 2002; 277:27706-15; PMID:12016208; http://dx.doi.org/10.1074/jbc.M200955200
- Dingar D, Kalkat M, Chan PK, Srikumar T, Bailey SD, Tu WB, Coyaud E, Ponzielli R, Kolyar M, Jurisica I, et al. BioID identifies novel c-MYC interacting partners in cultured cells and xenograft tumors. J Proteomics 2015; 118:95-111; PMID:25452129; http://dx.doi.org/10.1016/j.jprot.2014.09.029
- Euskirchen GM, Auerbach RK, Davidov E, Gianoulis TA, Zhong G, Rozowsky J, Bhardwaj N, Gerstein MB, Snyder M. Diverse roles and interactions of the SWI/SNF chromatin remodeling complex revealed using global approaches. PLoS Genet 2011; 7:e1002008; PMID:21408204; http://dx.doi.org/10.1371/journal.pgen.1002008
- Consortium EP, Bernstein BE, Birney E, Dunham I, Green ED, Gunter C, Snyder M. An integrated encyclopedia of DNA elements in the human genome. Nature 2012; 489:57-74; PMID:22955616; http://dx.doi.org/10.1038/nature11247
- Quinlan AR, Hall IM. BEDTools: a flexible suite of utilities for comparing genomic features. Bioinformatics 2010; 26:841-2; PMID:20110278; http://dx.doi.org/10.1093/bioinformatics/btq033
- Bickel PJ, Boley N, Brown JB, Huang H, Zhang NR. Subsampling methods for genomic inference. Ann Appl Stat 2010; 4:1660-97; http://dx.doi.org/10.1214/10-AOAS363
- Wang S, Sun H, Ma J, Zang C, Wang C, Wang J, Tang Q, Meyer CA, Zhang Y, Liu XS. Target analysis by integration of transcriptome and ChIP-seq data with BETA. Nat Protoc 2013; 8:2502-15; PMID:24263090; http://dx.doi.org/10.1038/nprot.2013.150
- DeCristofaro MF, Betz BL, Wang W, Weissman BE. Alteration of hSNF5/INI1/BAF47 detected in rhabdoid cell lines and primary rhabdomyosarcomas but not Wilms' tumors. Oncogene 1999; 18:7559-65; PMID:10602515; http://dx.doi.org/10.1038/sj.onc.1203168
- Kerl K, Ries D, Unland R, Borchert C, Moreno N, Hasselblatt M, Jurgens H, Kool M, Gorlich D, Eveslage M, et al. The histone deacetylase inhibitor SAHA acts in synergism with fenretinide and doxorubicin to control growth of rhabdoid tumor cells. BMC Cancer 2013; 13:286; PMID:23764045; http://dx.doi.org/10.1186/1471-2407-13-286
- Helming KC, Wang X, Wilson BG, Vazquez F, Haswell JR, Manchester HE, Kim Y, Kryukov GV, Ghandi M, Aguirre AJ, et al. ARID1B is a specific vulnerability in ARID1A-mutant cancers. Nat Med 2014; 20:251-4; PMID:24562383; http://dx.doi.org/10.1038/nm.3480
- Wilson BG, Helming KC, Wang X, Kim Y, Vazquez F, Jagani Z, Hahn WC, Roberts CW. Residual complexes containing SMARCA2 (BRM) underlie the oncogenic drive of SMARCA4 (BRG1) mutation. Mol Cell Biol 2014; 34:1136-44; PMID:24421395; http://dx.doi.org/10.1128/MCB.01372-13
- Romero OA, Setien F, John S, Gimenez-Xavier P, Gomez-Lopez G, Pisano D, Condom E, Villanueva A, Hager GL, Sanchez-Cespedes M. The tumour suppressor and chromatin-remodelling factor BRG1 antagonizes Myc activity and promotes cell differentiation in human cancer. EMBO Mol Med 2012; 4:603-16; PMID:22407764; http://dx.doi.org/10.1002/emmm.201200236
- Stojanova A, Penn LZ. The role of INI1/hSNF5 in gene regulation and cancer. Biochem Cell Biol 2009; 87:163-77; PMID:19234532; http://dx.doi.org/10.1139/O08-113
- Andresen C, Helander S, Lemak A, Fares C, Csizmok V, Carlsson J, Penn LZ, Forman-Kay JD, Arrowsmith CH, Lundstrom P, et al. Transient structure and dynamics in the disordered c-Myc transactivation domain affect Bin1 binding. Nucleic Acids Res 2012; 40:6353-66; PMID:22457068; http://dx.doi.org/10.1093/nar/gks263
- McMahon SB, Van Buskirk HA, Dugan KA, Copeland TD, Cole MD. The novel ATM-related protein TRRAP is an essential cofactor for the c-Myc and E2F oncoproteins. Cell 1998; 94:363-74; PMID:9708738; http://dx.doi.org/10.1016/S0092-8674(00)81479-8
- von der Lehr N, Johansson S, Wu S, Bahram F, Castell A, Cetinkaya C, Hydbring P, Weidung I, Nakayama K, Nakayama KI, et al. The F-box protein Skp2 participates in c-Myc proteosomal degradation and acts as a cofactor for c-Myc-regulated transcription. Mol Cell 2003; 11:1189-200; PMID:12769844; http://dx.doi.org/10.1016/S1097-2765(03)00193-X
- Ae K, Kobayashi N, Sakuma R, Ogata T, Kuroda H, Kawaguchi N, Shinomiya K, Kitamura Y. Chromatin remodeling factor encoded by ini1 induces G1 arrest and apoptosis in ini1-deficient cells. Oncogene 2002; 21:3112-20; PMID:12082626; http://dx.doi.org/10.1038/sj.onc.1205414
- Vries RG, Bezrookove V, Zuijderduijn LM, Kia SK, Houweling A, Oruetxebarria I, Raap AK, Verrijzer CP. Cancer-associated mutations in chromatin remodeler hSNF5 promote chromosomal instability by compromising the mitotic checkpoint. Genes Dev 2005; 19:665-70; PMID:15769941; http://dx.doi.org/10.1101/gad.335805
- Fernandez PC, Frank SR, Wang L, Schroeder M, Liu S, Greene J, Cocito A, Amati B. Genomic targets of the human c-Myc protein. Genes Dev 2003; 17:1115-29; PMID:12695333; http://dx.doi.org/10.1101/gad.1067003
- Zeller KI, Zhao X, Lee CW, Chiu KP, Yao F, Yustein JT, Ooi HS, Orlov YL, Shahab A, Yong HC, et al. Global mapping of c-Myc binding sites and target gene networks in human B cells. Proc Natl Acad Sci U S A 2006; 103:17834-9; PMID:17093053; http://dx.doi.org/10.1073/pnas.0604129103
- Kim SI, Bresnick EH, Bultman SJ. BRG1 directly regulates nucleosome structure and chromatin looping of the alpha globin locus to activate transcription. Nucleic Acids Res 2009; 37:6019-27; PMID:19696073; http://dx.doi.org/10.1093/nar/gkp677
- Kim SI, Bultman SJ, Kiefer CM, Dean A, Bresnick EH. BRG1 requirement for long-range interaction of a locus control region with a downstream promoter. Proc Natl Acad Sci U S A 2009; 106:2259-64; PMID:19171905; http://dx.doi.org/10.1073/pnas.0806420106
- Ni Z, Abou El Hassan M, Xu Z, Yu T, Bremner R. The chromatin-remodeling enzyme BRG1 coordinates CIITA induction through many interdependent distal enhancers. Nat Immunol 2008; 9:785-93; PMID:18500344; http://dx.doi.org/10.1038/ni.1619
- Shi J, Whyte WA, Zepeda-Mendoza CJ, Milazzo JP, Shen C, Roe JS, Minder JL, Mercan F, Wang E, Eckersley-Maslin MA, et al. Role of SWI/SNF in acute leukemia maintenance and enhancer-mediated Myc regulation. Genes Dev 2013; 27:2648-62; PMID:24285714; http://dx.doi.org/10.1101/gad.232710.113
- Biegel JA, Zhou JY, Rorke LB, Stenstrom C, Wainwright LM, Fogelgren B. Germ-line and acquired mutations of INI1 in atypical teratoid and rhabdoid tumors. Cancer Res 1999; 59:74-9; PMID:9892189
- Lee RS, Stewart C, Carter SL, Ambrogio L, Cibulskis K, Sougnez C, Lawrence MS, Auclair D, Mora J, Golub TR, et al. A remarkably simple genome underlies highly malignant pediatric rhabdoid cancers. J Clin Invest 2012; 122:2983-8; PMID:22797305; http://dx.doi.org/10.1172/JCI64400
- Zhang ZK, Davies KP, Allen J, Zhu L, Pestell RG, Zagzag D, Kalpana GV. Cell cycle arrest and repression of cyclin D1 transcription by INI1/hSNF5. Mol Cell Biol 2002; 22:5975-88; PMID:12138206; http://dx.doi.org/10.1128/MCB.22.16.5975-5988.2002
- Chai J, Charboneau AL, Betz BL, Weissman BE. Loss of the hSNF5 gene concomitantly inactivates p21CIP/WAF1 and p16INK4a activity associated with replicative senescence in A204 rhabdoid tumor cells. Cancer Res 2005; 65:10192-8; PMID:16288006; http://dx.doi.org/10.1158/0008-5472.CAN-05-1896
- Oruetxebarria I, Venturini F, Kekarainen T, Houweling A, Zuijderduijn LM, Mohd-Sarip A, Vries RG, Hoeben RC, Verrijzer CP. P16INK4a is required for hSNF5 chromatin remodeler-induced cellular senescence in malignant rhabdoid tumor cells. J Biol Chem 2004; 279:3807-16; PMID:14604992; http://dx.doi.org/10.1074/jbc.M309333200
- Isakoff MS, Sansam CG, Tamayo P, Subramanian A, Evans JA, Fillmore CM, Wang X, Biegel JA, Pomeroy SL, Mesirov JP, et al. Inactivation of the Snf5 tumor suppressor stimulates cell cycle progression and cooperates with p53 loss in oncogenic transformation. Proc Natl Acad Sci U S A 2005; 102:17745-50; PMID:16301525; http://dx.doi.org/10.1073/pnas.0509014102
- Kuwahara Y, Charboneau A, Knudsen ES, Weissman BE. Reexpression of hSNF5 in malignant rhabdoid tumor cell lines causes cell cycle arrest through a p21(CIP1/WAF1)-dependent mechanism. Cancer Res 2010; 70:1854-65; PMID:20179200; http://dx.doi.org/10.1158/0008-5472.CAN-09-1922
- Birks DK, Donson AM, Patel PR, Sufit A, Algar EM, Dunham C, Kleinschmidt-DeMasters BK, Handler MH, Vibhakar R, Foreman NK. Pediatric rhabdoid tumors of kidney and brain show many differences in gene expression but share dysregulation of cell cycle and epigenetic effector genes. Pediatr Blood Cancer 2013; 60:1095-102; PMID:23382118; http://dx.doi.org/10.1002/pbc.24481
- Zuber J, Shi J, Wang E, Rappaport AR, Herrmann H, Sison EA, Magoon D, Qi J, Blatt K, Wunderlich M, et al. RNAi screen identifies Brd4 as a therapeutic target in acute myeloid leukaemia. Nature 2011; 478:524-8; PMID:21814200; http://dx.doi.org/10.1038/nature10334
- Delmore JE, Issa GC, Lemieux ME, Rahl PB, Shi J, Jacobs HM, Kastritis E, Gilpatrick T, Paranal RM, Qi J, et al. BET bromodomain inhibition as a therapeutic strategy to target c-Myc. Cell 2011; 146:904-17; PMID:21889194; http://dx.doi.org/10.1016/j.cell.2011.08.017
- Soucek L, Whitfield J, Martins CP, Finch AJ, Murphy DJ, Sodir NM, Karnezis AN, Swigart LB, Nasi S, Evan GI. Modelling Myc inhibition as a cancer therapy. Nature 2008; 455:679-83; PMID:18716624; http://dx.doi.org/10.1038/nature07260
- Soucek L, Whitfield JR, Sodir NM, Masso-Valles D, Serrano E, Karnezis AN, Swigart LB, Evan GI. Inhibition of Myc family proteins eradicates KRas-driven lung cancer in mice. Genes Dev 2013; 27:504-13; PMID:23475959; http://dx.doi.org/10.1101/gad.205542.112
- Fletcher S, Prochownik EV. Small-molecule inhibitors of the Myc oncoprotein. Biochim Biophys Acta 2015; 1849:525-43; PMID:24657798; http://dx.doi.org/10.1016/j.bbagrm.2014.03.005
- Hsu TY, Simon LM, Neill NJ, Marcotte R, Sayad A, Bland CS, Echeverria GV, Sun T, Kurley SJ, Tyagi S, et al. The spliceosome is a therapeutic vulnerability in MYC-driven cancer. Nature 2015; 525:384-8; PMID:26331541; http://dx.doi.org/10.1038/nature14985
- Hsieh AL, Walton ZE, Altman BJ, Stine ZE, Dang CV. MYC and metabolism on the path to cancer. Semin Cell Dev Biol 2015; 43:11-21; PMID:26277543; http://dx.doi.org/10.1016/j.semcdb.2015.08.003
- Penn LJ, Brooks MW, Laufer EM, Littlewood TD, Morgenstern JP, Evan GI, Lee WM, Land H. Domains of human c-myc protein required for autosuppression and cooperation with ras oncogenes are overlapping. Mol Cell Biol 1990; 10:4961-6; PMID:2201910; http://dx.doi.org/10.1128/MCB.10.9.4961
- Nolan GP, Shatzman AR. Expression vectors and delivery systems. Curr Opin Biotechnol 1998; 9:447-50; PMID:9821270; http://dx.doi.org/10.1016/S0958-1669(98)80027-X
- Mao DY, Watson JD, Yan PS, Barsyte-Lovejoy D, Khosravi F, Wong WW, Farnham PJ, Huang TH, Penn LZ. Analysis of Myc bound loci identified by CpG island arrays shows that Max is essential for Myc-dependent repression. Curr Biol 2003; 13:882-6; PMID:12747840; http://dx.doi.org/10.1016/S0960-9822(03)00297-5
- Sif S, Stukenberg PT, Kirschner MW, Kingston RE. Mitotic inactivation of a human SWI/SNF chromatin remodeling complex. Genes Dev 1998; 12:2842-51; PMID:9744861; http://dx.doi.org/10.1101/gad.12.18.2842
- Nikolaev AY, Li M, Puskas N, Qin J, Gu W. Parc: a cytoplasmic anchor for p53. Cell 2003; 112:29-40; PMID:12526791; http://dx.doi.org/10.1016/S0092-8674(02)01255-2
- Ponzielli R, Boutros PC, Katz S, Stojanova A, Hanley AP, Khosravi F, Bros C, Jurisica I, Penn LZ. Optimization of experimental design parameters for high-throughput chromatin immunoprecipitation studies. Nucleic Acids Res 2008; 36:e144; PMID:18940864; http://dx.doi.org/10.1093/nar/gkn735
- Sheng Y, Laister RC, Lemak A, Wu B, Tai E, Duan S, Lukin J, Sunnerhagen M, Srisailam S, Karra M, et al. Molecular basis of Pirh2-mediated p53 ubiquitylation. Nat Struct Mol Biol 2008; 15:1334-42; PMID:19043414; http://dx.doi.org/10.1038/nsmb.1521
- Kaustov L, Lukin J, Lemak A, Duan S, Ho M, Doherty R, Penn LZ, Arrowsmith CH. The conserved CPH domains of Cul7 and PARC are protein-protein interaction modules that bind the tetramerization domain of p53. J Biol Chem 2007; 282:11300-7; PMID:17298945; http://dx.doi.org/10.1074/jbc.M611297200
- Brown KR, Jurisica I. Unequal evolutionary conservation of human protein interactions in interologous networks. Genome Biol 2007; 8:R95; PMID:17535438; http://dx.doi.org/10.1186/gb-2007-8-5-r95
- Brown KR, Jurisica I. Online predicted human interaction database. Bioinformatics 2005; 21:2076-82; PMID:15657099; http://dx.doi.org/10.1093/bioinformatics/bti273
- Brown KR, Otasek D, Ali M, McGuffin MJ, Xie W, Devani B, Toch IL, Jurisica I. NAViGaTOR: network analysis, visualization and graphing Toronto. Bioinformatics 2009; 25:3327-9; PMID:19837718; http://dx.doi.org/10.1093/bioinformatics/btp595
- Huang da W, Sherman BT, Lempicki RA. Systematic and integrative analysis of large gene lists using DAVID bioinformatics resources. Nat Protoc 2009; 4:44-57; PMID:19131956; http://dx.doi.org/10.1038/nprot.2008.211
- Huang da W, Sherman BT, Lempicki RA. Bioinformatics enrichment tools: paths toward the comprehensive functional analysis of large gene lists. Nucleic Acids Res 2009; 37:1-13; PMID:19033363; http://dx.doi.org/10.1093/nar/gkn923
- Wasylishen AR, Chan-Seng-Yue M, Bros C, Dingar D, Tu WB, Kalkat M, Chan PK, Mullen PJ, Huang L, Meyer N, et al. MYC phosphorylation at novel regulatory regions suppresses transforming activity. Cancer Res 2013; 73:6504-15; PMID:24030976; http://dx.doi.org/10.1158/0008-5472.CAN-12-4063
- Oster SK, Mao DY, Kennedy J, Penn LZ. Functional analysis of the N-terminal domain of the Myc oncoprotein. Oncogene 2003; 22:1998-2010; PMID:12673205; http://dx.doi.org/10.1038/sj.onc.1206228