
ABSTRACT
Since altered energy metabolism is a hallmark of cancer, many drugs targeting metabolic pathways are in active clinical trials. The tumor suppressor p53 is often inactivated in cancer, either through downregulation of protein or loss-of-function mutations. As such, stabilization of p53 is considered as one promising approach to treat those cancers carrying wild type (WT) p53. Herein, SIRT1 inhibitor Tenovin-1 and polo-like kinase 1 (Plk1) inhibitor BI2536 were used to stabilize p53. We found that both Tennovin-1 and BI2536 increased the anti-neoplastic activity of metformin, an inhibitor of oxidative phosphorylation, in a p53 dependent manner. Since p53 has also been shown to regulate metabolic pathways, we further analyzed glycolysis and oxidative phosphorylation upon drug treatments. We showed that both Tennovin-1 and BI2536 rescued metformin-induced glycolysis and that both Tennovin-1 and BI2536 potentiated metformin-associated inhibition of oxidative phosphorylation. Of significance, castration-resistant prostate cancer (CRPC) C4-2 cells show a much more robust response to the combination treatment than the parental androgen-dependent prostate cancer LNCaP cells, indicating that targeting energy metabolism with metformin plus p53 stabilizers might be a valid approach to treat CRPC carrying WT p53.
Introduction
Altered cancer metabolism, called “Warburg effect,” has been heavily studied ever since its discoveryCitation1 and is now considered as one hallmark of cancer.Citation2,3 Instead of relying on oxidative phosphorylation by mitochondria as the cells in normal differentiated tissue, cancer cells rely on aerobic glycolysis to support a high rate of proliferation.Citation4 Consequently, drugs targeting different steps of glycolytic pathway have been developed for treatment of different kinds of cancers, including inhibitors against pyruvate kinase isoform M2 (PKM2), phosphofructosekinase (PFK), lactate dehydrogenase (LDH) and more.Citation5,6
Several signaling pathways have established roles in regulating metabolic pathways, offering additional targets against altered cancer metabolism.Citation7 As a tumor suppressor, p53 has long been studied for its involvement in DNA damage checkpoint response and hypoxia.Citation8-10 Recently, p53 has also been shown to regulate several energy metabolism pathways, including both glycolysis and mitochondrial respiration.Citation11,12 To support, activation of p53 suppresses glycolysis through directly or indirectly inhibiting the transcription of several factors that are important in the glycolytic pathway, including glucose transporter type 1 (GLUT1), GLUT4, PFK1 and phosphoglycerate mutase (PGM) and other enzymes in glycolytic pathway.Citation12-15
Since wild type (WT) p53 could induce apoptosis, cancer cells use different ways to inactive p53, such as downregulation of protein level or loss-of function mutations.Citation16-18 Despite the high rate of p53 mutations in different kinds of cancers,Citation19,20 some cancers do harvest WT p53. For example, p53 is not mutated in the majority of melanomasCitation18 and prostate cancer, especially in the early stage of the disease.Citation21 Thus, reactivation of p53 would provide a promising strategy in treating those cancers that harvesting WT p53. Although drugs developed to directly activate p53 are not successful, different kinds of p53 stabilizers have been developed by targeting the p53-associated pathways.Citation22-24 DNA damage induces the stabilization of p53 in a phosphorylation and acetylation dependent manner.Citation25-27 Acetylation of p53 is a major mechanism to control the stability of p53.Citation28,29 Accordingly, Tenovin-1 activates p53 by inhibiting sirtuin family histone deacetylases (HDACs), SIRT1 and SIRT2, leading to increased p53 acetylation thus its stabilization.Citation30 Mitotic kinase Plk1 is another established antagonist of p53 as Plk1 inhibition results in p53 activation.Citation31-33 Inhibition of Plk1 activity also leads to an increase in p53 protein level.Citation34,35 Interestingly, Plk1 inhibition by either knock down or small molecule inhibitor decreased the glycolysis rate.Citation36
Metformin, a drug widely used for type II diabetes, has recently gained interests in treating cancer. Diabetes patients treated with metformin had decreased risk of different kinds of cancers.Citation37 Metformin directly inhibits mitochondrial respiration, thus increased glycolysis rates.Citation38 It has also been shown that Metformin works synergistically with MAPK pathway inhibitor trametinib inhibiting tumor growth in NRAS mutant cancer.Citation39 Interestingly, combination of metformin and mTOR pathway inhibitor rapamycin leads to cancer cell apoptosis under chemotherapy but protect normal cells in low glucose condition.Citation40
Previous work in our lab has shown that inhibition of Plk1 with BI2536 sensitized p53 WT prostate cancer to metformin treatment in a p53-dependent manner.Citation41 Since BI2536 treatment leads to stabilization of p53, here we tested whether Tenovin-1 can also work with metformin or other p53 stabilizers to inhibit the growth of cancer cells carrying WT p53.
Results
Co-treatment of SIRT1 inhibitor Tenovin-1 with DNA damage agent doxorubicin or Plk1 inhibitor BI2536 resulted in increased cell death in p53 WT cancer cell lines
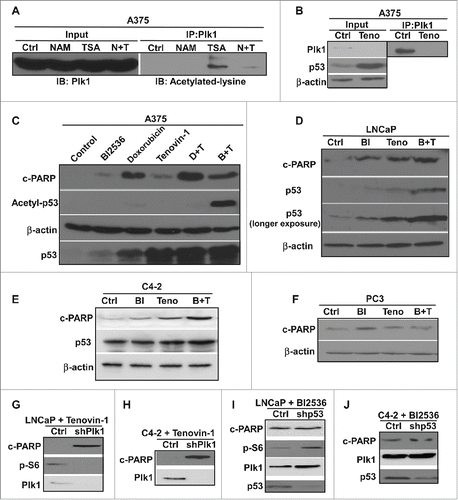
DNA damage has long been known to induce stabilization of p53, leading to activation of DNA damage checkpoint.Citation25-27 Tenovin-1 increases the p53 protein level through inhibiting SIRT1 and SIRT2 HDACs, thus increased acetylation of p53 that stabilizes the protein.Citation30 Plk1 is a negative regulator of p53. Thus, small molecule inhibition of Plk1 with BI2536 also leads to an increased level of p53 protein.Citation41 To further understand the anti-neoplastic activity of Tenovin-1, we first tested which class of HDACs might deacetylate Plk1. A375 cells were treated with TSA (trichostatin A), an inhibitor of HDAC I and II, or NAM (nicotinamide), an inhibitor of the SIRT family deacetylases, either alone or together. The lysates were then enriched by anti-Plk1 immunoprecipitation (IP), followed by immunoblotting (IB) against acetylated lysine. As indicated, there was an increased level of acetylation of Plk1 upon TSA treatment but not NAM treatment alone (), suggesting that HDAC I and II are HDACs that are likely responsible for the deacetylation of Plk1 but not the SIRT family HDACs. We noticed that there is less acetylation of Plk1 upon inhibition of all HDAC families, compared with the TSA-treated sample alone (). The underlying mechanism behind this observation awaits further investigation. Since Tenovin-1 inhibits the SIRT family of HDACs, it would not directly affect the acetylation status of Plk1. We then asked whether Tenovin-1 treatment affects Plk1 protein level. For that purpose, A375 cells were treated with Tenovin-1 for 24 hours and harvested. Tenovin-1 treatment resulted in obvious stabilization of p53 as expected, accompanying with a sharp decrease in Plk1 protein level (). This result is consistent with the previous finding that p53 negatively regulates Plk1 protein level.Citation42 Next, we asked whether combination of different p53 activators led to cell death in a synergistic manner in A375, a melanoma cell line carrying WT p53. Combination of a DNA damage agent doxorubicin with Tenovin-1 caused increased p53 protein level and cell death as indicated by p53 and cleaved-PARP IB (). Further, combination of BI2536 with Tenovin-1 led to increased p53 acetylation and protein level as well as increased cell death (). Similar experiments were repeated in LNCaP and C4-2, prostate cancer cell lines carrying WT p53. Combination of BI2536 and Tenovin-1 also led to increased p53 level, as well as increased cell death in a synergistic manner (). In striking contrast, combination of Tenovin-1 and BI2536 did not induce increased cell death in p53-null prostate cancer cell line PC3 (). These data suggest that these p53 activators act synergistically to induce cell death in a p53-dependent manner. We further tested whether Plk1 status affects Tenovin-1-induced cell death in a different approach. For that purpose, LNCaP and C4-2 (derived from LNCaP but androgen-independent) cells were infected with lentivirus to deplete Plk1, followed by treatment with Tenovin-1. Loss of Plk1 potentiated Tenovin-1-associated cell death in both cell lines (). To test whether p53 status affects the efficacy of Plk1 inhibition, we depleted p53 with lentivirus-based shRNA approach. Depletion of p53 clearly antagonized BI2536-associated cell death in both LNCaP and C4-2 cells (), indicating that p53 status is critical in the efficacy of BI2536.
Figure 1. Combination of different p53 activators led increased cell death in cancer cells carrying WT p53. (A) Plk1 was acetylated by HDAC I/II but not SIRT family deacetylases. A375 cells were treated with either NAM (N) or TSA (T) alone or both, and harvested 24 hours post-treatment for anti-Plk1 IP, followed by IB against acetylated lysine. (B) Inhibition of SIRT deacetylases led to increased p53 level and decreased Plk1 level. A375 cells were treated with tenovin-1 for 24 hours, harvested for IB against Plk1 and p53. Lysates were also subjected to anti-Plk1 IP, followed by IB. (C) Combing Plk1 inhibitor or DNA damage agent with SIRT inhibitor led to an increase of cell death in A375 cells. A375 cells were treated with BI2536 or doxorubincin either alone or with Tenovin-1 for 24 hours, and harvested for IB with antibodies indicated. (D, E) Plk1 inhibitor and SIRT inhibitor together induced an increase of cell death in p53-positive LNCaP and C4-2 cells. Cells were treated with BI2536 or Tenovin-1 alone or together for 24 hours, and harvested for IB. (F) Plk1 inhibitor plus SIRT inhibitor did not induce an increase of cell death in p53-null PC-3 cells. Cells were treated with BI2536 or Tenovin-1 alone or together for 24 hours, and harvested for IB. (G, H) Knock-down of Plk1 sensitized p53-positive cancer cells to Tenovin-1. LNCaP (G) and C4-2 (H) were treated with either control or Plk1-shRNA lentivirus for 2 days, incubated with Tenovin-1 for 24 hours, and harvested for IB. (I, J) Knock-down of p53 antagonized BI2536-induced cell death. LNCaP (I) and C4-2 (J) cells were treated with either control or p53-shRNA lentivirus for 2 days, incubated with BI2536 for 24 hours, and harvested for IB.
Co-treatment of Tenovin-1 and metformin caused increased cell death in p53 WT cancer cells
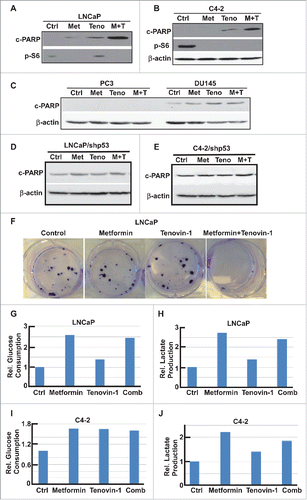
Our lab has previously shown that combination of Plk1 inhibitor BI2536 and mitochondrial respiration inhibitor metformin leads to increased cell death in prostate cancer cell line LNCaP and C4-2.Citation41 Since p53 plays a critical role in BI2536-induced cell death, and Plk1 inhibition has been shown to stabilize p53 protein, we tested whether other p53 activators also work synergistically with metformin in inducing cell death. Accordingly, LNCaP and C4-2 cells were treated with metformin and Tenovin-1 either alone or together and harvested. Upon combination of the two drugs, a significant increase of cell death was observed in both cell lines as indicated by cleaved-PARP IB (), suggesting that Tenovin-1 can also potentiate metformin-induced cell death. We also performed colony formation assays using LNCaP cells treated with Tenovin-1 and metformin. Again, the combination of the two drugs significantly decreased the colony formation ability of LNCaP cells (). However, combination of the two drugs did not lead to any increased cell death in p53-null (PC3) and p53-mutant (DU145) prostate cancer cells (), suggesting that the synergistic effect of Tenovin-1 and metformin might also depend on WT p53, as reported for the synergistic effect of BI2536 and Metformin. To further test this concept, LNCaP and C4-2 cells were depleted of p53, then treated with Tenovin-1 and metformin. Upon p53 knock down, Tenovin-1 plus metformin no longer induced increased cell death compared with single drug treatment (), suggesting that the synergistic effect of Tenovin-1 and metformin is indeed p53 dependent.
Figure 2. Combination of Tenovin-1 and metformin led to increased cell death in prostate cancer cells in a p53 dependent manner (A, B) Combination of Tenovin-1 and metformin induced an increased cell death in LNCaP and C4-2 cells. Cells as indicated were treated with either metformin or Tenovin-1 alone or together for 24 hours, and harvested for IB. (C, D) Metformin plus Tenovin-1 did not induce an increase of cell death in p53-negative prostate cancer cells. PC-3 (p53-null) and DU145 (p53 mutant) cells were treated with indicated drugs for 24 hours and harvested. (D, E) No increased cell death with metformin plus Tenovin-1 in LNCaP and C4-2 cells upon p53 depletion. Cells were depleted of p53 with lentivirus-based shRNA, treated with indicated drugs for 24 hours, and harvested. (F) Combination of Tenovin-1 and metformin led to significantly decreased colony formation. LNCaP cells were seeded in 6-well plates and treated with indicated drug(s) for 1 month, with medium changing and drug treatment every 3 days. Cells were fixed with formalin and stained with crystal violet. (G to J) Tenovin-1 treatment antagonized metformin-induced increased glycolysis. After LNCaP (G, H) and C4-2 (I, J) cells were cultured in 6-well plates and treated with indicated drug(s) for 24 hours, medium were harvested for glucose and lactate measurement. Relative glucose consumption rate and lactate production rate were calculated.
Glycolysis and oxidative phosphorylation are inhibited upon treatment with Tenovin-1 and metformin
Since p53 and metformin are involved in metabolism regulation, it is possible that combination of Tenovin-1 and metformin leads to more severe defects in metabolism pathways that are important for energy production, eventually causing increased cell death. Accordingly, we first examined the glucose consumption and lactate production of LNCaP and C4-2 cells upon either single drug treatment or combination by measuring the glucose and lactate concentrations in the medium. As expected, metformin treatment induced increased glucose consumption and lactate production in both LNCaP and C4-2 cells (). Tenovin-1 treatment alone did not significantly affect glucose production and lactate production. However, cells treated with Tenovin-1 plus metformin have reduced glucose consumption and lactate production compared with cells treated with metformin alone (), suggesting that Tenovin-1 treatment partially rescued the increased glycolysis induced by metformin treatment.
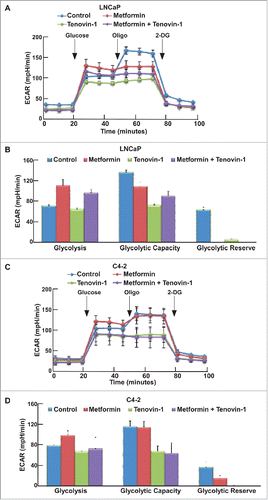
Since aerobic glycolysis and mitochondrial oxidative phosphorylation are two major pathways that cells use to produce enough energy for survival, we decided to test the glycolysis ability and mitochondrial function more carefully using Seahorse XF extracellular Flux Analyzer. Accordingly, LNCaP or C4-2 cells in microplates were treated with either single drug or combination for 24 hours, and subjected to the protocols to examine glycolysis and mitochondria function by glycolysis stress test (GST) and mitochondria stress test (MST), respectively. For GST, cells were incubated in GST medium for 1 hour, then extracellular acidification rate (ECAR) were measured as graphed (). Data were analyzed by using stress test report generator from Seahorse Bioscience. Consistent with our glucose and lactate measurement described in , metformin increased glycolysis rate, while Tenovin-1 treatment led to a slightly decrease in glycolysis rate. Of significance, combination of metformin and Tenovin-1 led to a significant decrease in glycolysis rate compared with cells treated with metformin alone (). Of note, metformin treatment led to a decrease in glycolytic capacity in LNCaP cells but did not have any effect in C4-2 cells. However, Tenovin-1 treatment led to a significant decrease of glycolytic capacity in both LNCaP and C4-2 cells (). Further, combination of the two drugs did not have a very significant effect on glycolytic capacity in C4-2 cells compared with Tenovin-1 treatment alone, while in LNCaP cells it led to a slightly increase in glycolytic capacity compared with cells treated with Tenovin-1 alone. For glycolytic reserve, the parameter stands for how much glycolytic activity the cells do not use compared with the full glycolytic capacity, combination treatment led to complete abolishment in both cell lines (). These analyses suggest that metformin treatment leads to increase of glycolysis rate in cells, but it does not interfere with the glycolytic pathway components directly. In contrast, Tenovin-1 is able to directly interfere with the glycolytic pathway components since it leads to a decrease in glycolytic capacity. Therefore, the effect of combination of two drugs on glycolytic pathway components (indicated by glycolytic capacity) was very similar to Tenovin-1 treatment alone although the combination led to decreased glycolysis rate compared with metformin treatment alone.
Figure 3. Tenovin-1 antagonized metformin-induced glycolysis in LNCaP and C4-2 cells. (A, C) ECAR under single or both drug treatment was measured by Seahorse XFe24 analyzer. Cells were seeded in XFe24 cell culture microplates, treated with metformin, Tenovin-1 or both for 24 hours, and subjected to the protocol for glycolysis tolerance test in which glucose, oligomycin and 2-deoxyglucose (2-DG) were added at the time points indicated. (B, D) Calculated glycolysis rates, glycolysis capacity and glycolytic reserve.
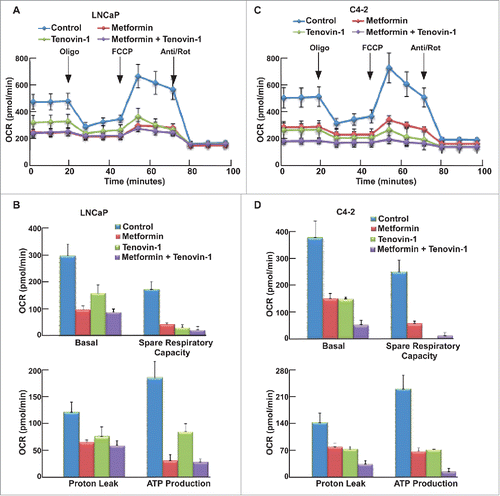
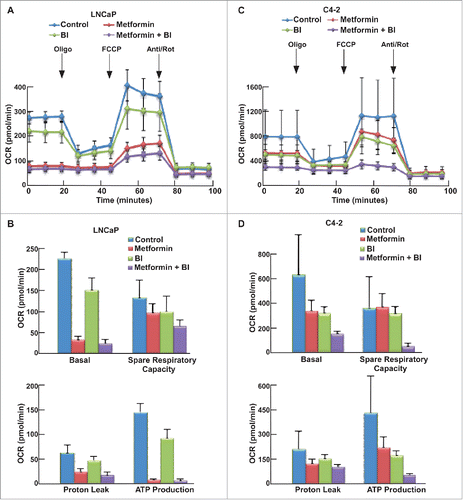
Since both Tenovin-1 and metformin have been implicated in the regulation of mitochondrial function, we also tested whether combination of two drugs would affect mitochondrial function using MST. Accordingly, LNCaP and C4-2 cells were incubated in MST medium for 1 hour, followed by measurement of oxygen consumption rate (OCR) as graphed (). Metformin treatment led to impair of mitochondrial function in both LNCaP and C4-2 cells, as indicated by reduced mitochondria basal activity, spare respiratory capacity, proton leak, and ATP production rate (). However, to our surprise, Tenovin-1 treatment also led to a significant decrease in mitochondrial function in both cell lines (), suggesting that Tenovin-1 has an undiscovered effect on inhibiting mitochondrial function. Combination of the two drugs led to a moderate decrease in mitochondrial function in LNCaP cells (), but resulted in a more significant decrease of mitochondrial function in C4-2 cells (). These data suggest that Tenovin-1 and metformin act synergistically to inhibit the mitochondrial function, especially for castration-resistant prostate cancer cells.
Figure 4. Tenovin-1 potentiated metformin-induced impair of mitochondrial function in C4-2 but not in LNCaP cells. (A, C) OCR under single or both drug treatment was measurement by Seahorse XFe24 analyzer. Cells were seeded in XFe24 cell culture microplates, treated with metformin, Tenovin-1 or both for 24 hours, and subjected to the protocol for mitochondria tolerance test in which oligomycin, FCCP and Rotenone/antimycin A were added at the time points indicated. (B, D) Calculated basal respiratory rate, spare respiratory capacity, proton leak and ATP production.
Glycolysis and oxidative phosphorylation are inhibited upon co-treatment with BI2536 and metformin
Previous work in the lab has shown that upon combination of BI2536 and metformin, BI2536 rescues metformin-induced increased glucose consumption, which may be one reason to cause the increased cell death. We also used the Seahorse XFe24 Extracellular Flux Analyzer to test the glycolysis and mitochondrial function upon the combination of these two drugs. After cells were treated with indicated drugs for 24 hours, both GST () and MST () were performed to examine glycolysis and mitochondrial function in these cells, respectively. Compared with Tenovin-1 treatment alone, BI2536 induced a more dramatic decrease of glycolysis rate in LNCaP and C4-2 cells (). BI2536 treatment also led to a more dramatic decrease in glycolytic capacity, similar to Tenovin-1 treatment (). Moreover, BI2536 antagonized metformin-induced elevation of glycolysis rate, as combination of the two drugs caused a decrease in glycolytic capacity in C4-2 cells, but not LNCaP cells (). For MST, BI2536 alone partially inhibited oxidative phosphorylation. Significantly, BI2536 clearly potentiated metformin-associated inhibition of mitochondrial function in both cell lines, with a much more dramatic effect in C4-2 cells ().
Figure 5. BI2536 antagonized metformin-induced glycolysis in LNCaP and C4-2 cells. (A, C) ECAR under single or both drug treatment was measured by Seahorse XFe24 analyzer. Cells were seeded in XFe24 cell culture microplates, treated with metformin, BI2536 or both for 24 hours, and subjected to the protocol for glycolysis tolerance test in which glucose, oligomycin and 2-DG were added at the time points indicated. (B, D) Calculated glycolysis rates, glycolysis capacity and glycolytic reserve.
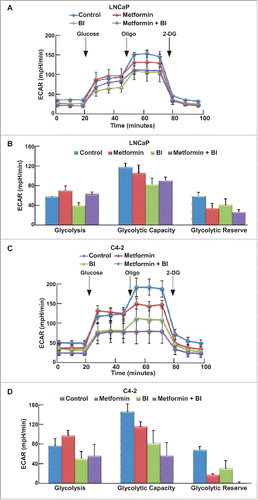
Figure 6. BI2536 potentiated metformin-induced impair of mitochondrial function in both LNCaP and C4-2 cells. (A, C) OCR under single or both drug treatment was measurement by Seahorse XFe24 analyzer. Cells were seeded in XFe24 cell culture microplates, treated with metformin, BI2536 or both for 24 hours, and subjected to the protocol for mitochondria tolerance test in which oligomycin, FCCP and Rotenone/antimycin A were added at the time points indicated. (B, D) Calculated basal respiratory rate, spare respiratory capacity, proton leak and ATP production.
Discussion
Activation of the tumor suppressor p53 in cancer carrying WT p53 has been considered as one promising approach to induce cancer cell death. Although targeting p53 protein itself meets with many difficulties, targeting p53- related pathways has been effective in inducing p53, such as DNA damage agents, inhibitors of proteins that antagonize p53 stability.Citation23,28-30 The mitotic kinase, Plk1, has been shown as a negative regulator of p53, both directly or indirectly.Citation43 Acetylation of p53 also leads to its stabilization with SIRT1 as the deacetylase that destabilizes p53.Citation28 Tenovin-1 has been shown to promote p53 activation by inhibiting SIRT1.Citation30 In this study, we first tested whether combing of different p53 activators would lead to increased cell death in p53 WT cancer cells. DNA damage agent doxorubicin or Plk1 inhibitor BI2536, when combined with Tenovin-1, indeed led to more severe apoptosis in melanoma and prostate cancer cells, and such a synergistic effect is apparently p53 dependent ().
Cancer cells tend to have altered energy metabolism with elevated glycolysis. It has been established that p53 inhibits glycolysis and promotes oxidative phosphorylation at the same time. As such, reactivation of p53 with small molecule chemicals is predicted to inhibit glycolysis, thus potentiating the anti-neoplastic activity of metformin, an inhibitor of oxidative phosphorylation. We recently reported that BI2536 and metformin act synergistically to cause prostate cancer cell death in a p53 dependent manner. We aimed to test whether Tenovin-1, another p53 activator, could also have the similar effect when combining with metformin. We found that Tenovin-1 plus metformin indeed led to a synergistic increase in prostate cancer cell death in a p53 dependent manner ().
Since both p53 activators and metformin regulate metabolic pathways, we analyzed the glycolysis and mitochondrial function in detail using a Seahorse XF Extracellular Analyzer. Following GST, we showed that metformin induced an increased glycolysis rate but a moderate decrease in glycolysis capacity, and that both Tenovin-1 and BI2536 led to decreased glycolysis rates and glycolytic capacity. Consequently, combination of p53 activators antagonized metformin-associated high rate of glycolysis and led to moderate decrease in glycolytic capacity as well (). Following MST, we showed that metformin inhibited mitochondrial function, consistent with previous work. However, to our surprise, we found that both Tenovin-1 and BI2536 resulted in some degree of mitochondrial inhibition. Whether this interesting observation depends on activation of p53 needs further investigation in the future. Of significance, combination of p53 activators Tenonvin-1 or BI2536 with metformin led to significant inhibition of mitochondrial function (). Furthermore, the synergistic effect is clearly much more robust in castration- resistant prostate cancer C4-2 cells than their parental androgen-dependent LNCaP cells, suggesting a novel approach to treat CRPC.
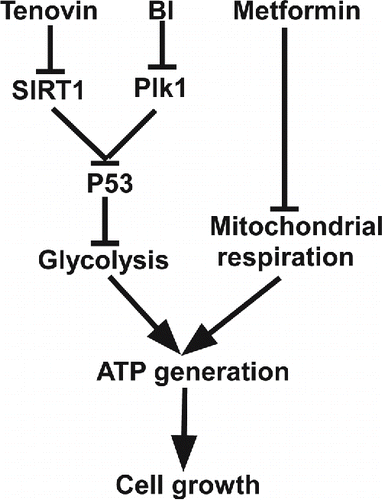
Combining data from GST and MST, we hypothesized that the synergistic effect of p53 activators with metformin might be due to inhibition of two important energy production pathways at the same time. Metformin causes inhibition of the mitochondrial function,Citation38 so cells have to rely more on the glycolysis pathway for survival. Since both Tenovin-1 and BI2536 lead to inhibition of glycolysis and mitochondrial function, their combinations with metformin will completely block energy producing pathways at the same time, eventually increasing cell death significantly ().
Figure 7. A proposed working model. Combination of p53 stabilizing agents such as Tenovin-1 and BI2536 with metformin is a valid approach to treat cancers carrying wild type p53.
In summary, our study suggests that p53 activators are efficient in inducing cancer cell death when combined with mitochondrial inhibitor metformin. Our finding is particularly relevant to prostate cancer as CRPC is considered non-curable at this moment.
Materials and methods
Cell culture, lentivirus-based shRNA
A375 cells were cultured in Dulbecco's Modified Eagle's Medium (DMEM) (Sigma) supplemented with 10% Fetal Bovine Serum (FBS), L-glutamine (Sigma) and 100 units/ml penicillin, 100 units/ml streptomycin in 5% CO2 incubator at 37°C. LNCaP and C4-2 cells were cultured in RPMI 1640 Medium (Sigma) supplemented with 10% FBS and 100 units/ml penicillin, 100 units/ml streptomycin in 5% CO2 incubator at 37°C. The lentivirus vectors containing Plk1 or p53 shRNA were co-transfected with pHR’-CMV-Δ8.20 vpr and pHR’-CMV-VSV-G into 293T cells using polyJet transfecting reagents (Signagen). After supernatants were harvested every 12 hours, lentivirus were concentrated using ultracentrifuge. 10 mM Hepes and 10μg/ml polybrene were added together with lentivirus to reduce toxicity and increase infection efficiency.
Chemicals
BI2536 was purchased from Symansis NZ Ltd, New Zealand. Tenovin-1 was purchased from Santa Cruz. Metformin and doxorubicin hydrochloride were purchased from Sigma.
Antibodies
Plk1 (sc-17783) and p53 antibodies were purchased from Santa Cruz. Antibodies against acetylated-lysine (9441s), acetylated-p53 (2565s) and p-s6 (4858s) were purchased from Cell Signaling. Cleaved-PARP antibody (ab3565) was obtained from EMD Millipore.
Immunoblotting (IB) and immunoprecipitation (IP)
Cells were treated with corresponding drugs, followed by steps described before. Briefly, cells were transferred into 1.5 ml tube after scraping from the plates, centrifuged at 2,000 rpm for 2 min, washed with PBS, and re-suspended in TBSN buffer with 150 mM NaCl. Upon sonication to break the cells, cells were centrifuged at 14,000 rpm for 10 mins. Supernatants were collected, mixed with the SDS loading buffer and boiled at 95°C for 5 mins. Samples were resolved on SDS-PAGE, transferred to PVDF membrane, and subjected to a standard IB protocol. For IP, enough antibodies were added into 1 mg cell lysates and incubated at 4°C overnight, followed by incubation with protein A/G plus-Agarose beads for 1 hour at 4°C. IP pellets were washed three times with TBSN buffer with 500 mM NaCl, three times with TBSN buffer with 150 mM NaCl, and subjected for IB steps described above.
Colony formation
LNCaP cells were seeded in 6-well plates (500 cells/well) and treated with indicated drug(s) for 1 month, with medium changing and drug treatment every 3 days. Cells were then fixed with 10% formalin, and stained with 0.5% crystal violet, followed by PBS wash three times.
Glucose consumption and lactate production measurement
Indicated cells were cultured in 6-well plates and treated with corresponding drugs. After one day treatment, a portion of medium in each well was taken out and diluted 50 times, glucose and lactate concentrations in the culture medium and original medium (not cultured with cells) were measured using Glucose Assay kit and Lactate Assay kit from Eton Bioscience Inc. Cell numbers in each well were counted using TC-20 cell counter from Bio-Rad. Glucose consumption was calculated based on the difference of glucose concentrations in the original medium versus the cultured medium, normalized to cell numbers in corresponding wells. Lactate production was calculated based on the difference of lactate concentrations in cultured medium vs. original medium, normalized to cell numbers in corresponding wells. Relative glucose consumption and lactate production rates were calculated by normalization of each treatment to control group.
Seahorse analysis
LNCaP and C4-2 Cells were seeded in XFe24 cell culture microplates in RPMI 1640 medium (10% FBS with antibiotics). After overnight incubation, cells were treated with corresponding drug(s) for 24 hours. 12 hours before analysis, cartridges were hydrated in calibrant buffer in a non-CO2 incubator at 37°C. Before subjected to seahorse analysis, cells were washed with corresponding medium for three times and incubated in corresponding medium in a non-CO2 incubator for 1 hour. For GST, GST medium was prepared by supplementing XF base Medium with 2 mM glutamine, warmed to 37°C in water bath and adjust pH to 7.4. Glucose, Oligomycin and 2-DG from the XF Glycolysis Stress Test Kit were diluted into designed concentrations (Glucose: 80mM, Oligomycin: 9μM, 2-DG: 500 mM) and added into corresponding ports of cartridge. After calibration of the cartridge, cells went through GST. For MST, MST medium was prepared by supplementing XF base Medium with 2 mM glutamine, 1 mM pyruvate and 10 mM glucose, warmed to 37°C in water bath and adjust pH to 7.4. Oligomycin, Carbonyl cyanide-4-(trifluoromethoxy) phenylhydrazone (FCCP) and Retenone/antimycin A from the XF Glycolysis Stress Test Kit were diluted into designed concentrations (Oligomycin: 8 μM, FCCP: 9 μM, Retenone/antimycin A: 5 μM) and added into corresponding ports of cartridge. After calibration of the cartridge, cells went through MST.
Disclosure of potential conflicts of interest
No potential conflicts of interest were disclosed.
Funding
L Chen was financially supported by China Scholarship Council (CSC). This work was supported by NIH grants R01 CA157429 (XL), R01 AR059130 (NA), R01 CA176748 (NA) and ACS grant RSG-13-073 (XL).
References
- Warburg O, Wind F, Negelein E. The metabolism of tumors in the body. J General Physiol 1927; 8:519-30
- Hanahan D, Weinberg RA. The hallmarks of cancer. Cell 2000; 100:57-70; PMID:10647931
- Hanahan D, Weinberg RA. Hallmarks of cancer: the next generation. Cell 2011; 144:646-74; PMID:21376230
- Vander Heiden MG, Cantley LC, Thompson CB. Understanding the Warburg effect: the metabolic requirements of cell proliferation. Science 2009; 324:1029-33; PMID:19460998
- Pelicano H, Martin DS, Xu RH, Huang P. Glycolysis inhibition for anticancer treatment. Oncogene 0000; 25:4633-46
- Ganapathy-Kanniappan S, Geschwind JF. Tumor glycolysis as a target for cancer therapy: progress and prospects. Mol Cancer 2013; 12:152; PMID:24298908
- Gu L, Xie L, Zuo C, Ma Z, Zhang Y, Zhu Y, Gao J. Targeting mTOR/p70S6K/glycolysis signaling pathway restores glucocorticoid sensitivity to 4E-BP1 null Burkitt Lymphoma. BMC Cancer 2015; 15:529
- Liu C, Zhu Y, Lou W, Nadiminty N, Chen X, Zhou Q, Shi XB, deVere White RW, Gao AC. Functional p53 determines docetaxel sensitivity in prostate cancer cells. Prostate 2013; 73:418-27; PMID:22996738
- Serrano MA, Li Z, Dangeti M, Musich PR, Patrick S, Roginskaya M, Cartwright B, Zou Y. DNA-PK, ATM and ATR collaboratively regulate p53-RPA interaction to facilitate homologous recombination DNA repair. Oncogene 2013; 32:2452-62; PMID:22797063
- Gogna R, Madan E, Kuppusamy P, Pati U. Chaperoning of mutant p53 protein by wild-type p53 protein causes hypoxic tumor regression. J Biol Chem 2012; 287:2907-14; PMID:22147694
- Puzio-Kuter AM. The Role of p53 in Metabolic Regulation. Genes Cancer 2011; 2:385-91; PMID:21779507
- Kruiswijk F, Labuschagne CF, Vousden KH. p53 in survival, death and metabolic health: a lifeguard with a licence to kill. Nat Rev Mol Cell Biol 2015; 16:393-405; PMID:26122615
- Bensaad K, Tsuruta A, Selak MA, Vidal MN, Nakano K, Bartrons R, Gottlieb E, Vousden KH. TIGAR, a p53-inducible regulator of glycolysis and apoptosis. Cell 2006; 126:107-20; PMID:16839880
- Bensaad K, Cheung EC, Vousden KH. Modulation of intracellular ROS levels by TIGAR controls autophagy. Embo J 2009; 28:3015-26; PMID:19713938
- Kim HR, Roe JS, Lee JE, Cho EJ, Youn HD. p53 regulates glucose metabolism by miR-34a. Biochem Biophy Res Commun 2013; 437:225-31
- Petitjean A, Mathe E, Kato S, Ishioka C, Tavtigian SV, Hainaut P, Olivier M. Impact of mutant p53 functional properties on TP53 mutation patterns and tumor phenotype: lessons from recent developments in the IARC TP53 database. Hum Mutation 2007; 28:622-9
- Lowe SW. Activation of p53 by oncogenes. Endocrine-Related Cancer 1999; 6:45-8; PMID:10732786
- Box NF, Vukmer TO, Terzian T. Targeting p53 in melanoma. Pigment Cell Melanoma Res 2014; 27:8-10; PMID:24118922
- van Oijen MG, Slootweg PJ. Gain-of-Function Mutations in the Tumor Suppressor Gene p53. Clin Cancer Res 2000; 6:2138-45; PMID:10873062
- Freed-Pastor WA, Prives C. Mutant p53: one name, many proteins. Genes Dev 2012; 26:1268-86; PMID:22713868
- Griewe GL, Dean RC, Zhang W, Young D, Sesterhenn IA, Shanmugam N, McLeod DG, Moul JW, Srivastava S. p53 Immunostaining guided laser capture microdissection (p53-LCM) defines the presence of p53 gene mutations in focal regions of primary prostate cancer positive for p53 protein. Prostate Cancer Prostatic Dis 0000; 6:281-5
- Lavin MF, Gueven N. The complexity of p53 stabilization and activation. Cell Death Differentiation 2006; 13:941-50; PMID:16601750
- Kapetanovic IM, Muzzio M, McCormick DL, Thompson TN, Johnson WD, Horn TL, Mohammed A, Rao CV, Kopelovich L. Pharmacokinetics and tissue and tumor exposure of CP-31398, a p53-stabilizing agent, in rats. Cancer Chemotherapy Pharmacol 2012; 69:1301-6; PMID:22302406
- Mouraret N, Marcos E, Abid S, Gary-Bobo G, Saker M, Houssaini A, Dubois-Rande JL, Boyer L, Boczkowski J, Derumeaux G, et al. Activation of Lung p53 by Nutlin-3a Prevents and Reverses Experimental Pulmonary Hypertension. Circulation 2013; 127:1664-76; PMID:23513067
- Sakaguchi K, Herrera JE, Saito Si, Miki T, Bustin M, Vassilev A, Anderson CW, Appella E. DNA damage activates p53 through a phosphorylation–acetylation cascade. Genes Dev 1998; 12:2831-41; PMID:9744860
- Liu Y, Kulesz-Martin M. p53 protein at the hub of cellular DNA damage response pathways through sequence-specific and non-sequence-specific DNA binding. Carcinogenesis 2001; 22:851-60; PMID:11375889
- Meek DW. The p53 response to DNA damage. DNA Repair 2004; 3:1049-56; PMID:15279792
- Tang Y, Zhao W, Chen Y, Zhao Y, Gu W. Acetylation Is Indispensable for p53 Activation. Cell; 133:612-26; PMID:18485870
- Brooks C, Gu W. The impact of acetylation and deacetylation on the p53 pathway. Protein Cell 2011; 2:456-62; PMID:21748595
- Lain S, Hollick JJ, Campbell J, Staples OD, Higgins M, Aoubala M, McCarthy A, Appleyard V, Murray KE, Baker L, et al. Discovery, in vivo activity, and mechanism of action of a small-molecule p53 activator. Cancer Cell 2008; 13:454-63; PMID:18455128
- Liu XS, Li H, Song B, Liu X. Polo-like kinase 1 phosphorylation of G2 and S-phase-expressed 1 protein is essential for p53 inactivation during G2 checkpoint recovery. EMBO Reports 2010; 11:626-32; PMID:20577264; http://dx.doi.org/10.1038/embor.2010.90
- Yang X, Li H, Zhou Z, Wang WH, Deng A, Andrisani O, Liu X. Plk1-mediated phosphorylation of Topors regulates p53 stability. J Biol Chem 2009; 284:18588-92; PMID:19473992; http://dx.doi.org/10.1074/jbc.C109.001560
- Dias SS, Hogan C, Ochocka AM, Meek DW. Polo-like kinase-1 phosphorylates MDM2 at Ser260 and stimulates MDM2-mediated p53 turnover. FEBS Letters 2009; 583:3543-8; PMID:19833129; http://dx.doi.org/10.1016/j.febslet.2009.09.057
- Sanhaji M, Louwen F, Zimmer B, Kreis N-N, Roth S, Yuan J. Polo-like kinase 1 inhibitors, mitotic stress and the tumor suppressor p53. Cell Cycle 2013; 12:1340-51; PMID:23574746; http://dx.doi.org/10.4161/cc.24573
- Lansing TJ, McConnell RT, Duckett DR, Spehar GM, Knick VB, Hassler DF, Noro N, Furuta M, Emmitte KA, Gilmer TM, et al. In vitro biological activity of a novel small-molecule inhibitor of polo-like kinase 1. Mol Cancer Therapeutics 2007; 6:450-9; PMID:17267659; http://dx.doi.org/10.1158/1535-7163.MCT-06-0543
- Li Z, Li J, Bi P, Lu Y, Burcham G, Elzey BD, Ratliff T, Konieczny SF, Ahmad N, Kuang S, et al. Plk1 Phosphorylation of PTEN Causes a Tumor-Promoting Metabolic State. Mol Cell Biol 2014; 34(19):3642-61
- Kasznicki J, Sliwinska A, Drzewoski J. Metformin in cancer prevention and therapy. Annals Translational Med 2014; 2:57; PMID:25333032
- Andrzejewski S, Gravel SP, Pollak M, St-Pierre J. Metformin directly acts on mitochondria to alter cellular bioenergetics. Cancer Metab 2014; 2:12; PMID:25184038; http://dx.doi.org/10.1186/2049-3002-2-12
- Vujic I, Sanlorenzo M, Posch C, Esteve-Puig R, Yen AJ, Kwong A, Tsumura A, Murphy R, Rappersberger K, Ortiz-Urda S. Metformin and trametinib have synergistic effects on cell viability and tumor growth in NRAS mutant cancer. Oncotarget 2015; 6:969-78; PMID:25504439; http://dx.doi.org/10.18632/oncotarget.2824
- Apontes P, Leontieva OV, Demidenko ZN, Li F, Blagosklonny MV. Exploring long-term protection of normal human fibroblasts and epithelial cells from chemotherapy in cell culture. Oncotarget 2011; 2:222-33; PMID:21447859; http://dx.doi.org/10.18632/oncotarget.248
- Shao C, Ahmad N, Hodges K, Kuang S, Ratliff T, Liu X. Inhibition of Polo-like Kinase 1 (Plk1) Enhances the Antineoplastic Activity of Metformin in Prostate Cancer. J Biol Chem 2015; 290:2024-33; PMID:25505174; http://dx.doi.org/10.1074/jbc.M114.596817
- McKenzie L, King S, Marcar L, Nicol S, Dias SS, Schumm K, Robertson P, Bourdon JC, Perkins N, Fuller-Pace F, et al. P53-dependent repression of polo-like kinase-1 (PLK1). Cell Cycle 2010; 9:4200-12; PMID:20962589; http://dx.doi.org/10.4161/cc.9.20.13532
- Ando K, Ozaki T, Yamamoto H, Furuya K, Hosoda M, Hayashi S, Fukuzawa M, Nakagawara A. Polo-like kinase 1 (Plk1) inhibits p53 function by physical interaction and phosphorylation. J Biol Chem 2004; 279:25549-61; PMID:15024021; http://dx.doi.org/10.1074/jbc.M314182200