
ABSTRACT
Recent findings strongly support a role for small regulatory RNAs in the regulation of human lifespan yet little information exists about the precise underlying mechanisms. Although extensive studies on model organisms have indicated that reduced activity of the nutrient response pathway, for example as a result of dietary restriction, can extend lifespan through the suppression of the protein kinase mechanistic target of rapamycin (mTOR), it still is subject of debate whether this mechanism is operative in humans as well. Here, we present findings indicating that human microRNA (miR)-496 targets 2 sites within the human mTOR 3′UTR. Coexpression of miR-496 with different fusion transcripts, consisting of the luciferase transcript and either wild-type mTOR 3′UTR or mTOR 3′UTR transcript with the miR-496 binding sites singly or combined mutated, confirmed this prediction and revealed cooperativity between the 2 binding sites. miR-496 reduced the mTOR protein level in HeLa-K cells, and the levels of miR-496 and mTOR protein were inversely correlated in Peripheral Blood Mononuclear Cells (PBMC), with old individuals (n=40) harbouring high levels of miR-496 relative to young individuals (n=40). Together, these findings point to the possibility that miR-496 is involved in the regulation of human aging through the control of mTOR.
Introduction
Mechanistic (previously: mammalian) target of rapamycin (mTOR) is an evolutionary conserved serine/threonine protein kinase that belongs to the family of phosphatidylinositol 3′ kinase related kinases.Citation1 Being at the hub of nutrient-sensing and growth-promoting pathways, mTOR controls a variety of physiological processes and is considered a key regulator of longevity.Citation2 Aging is defined by loss of homeostasis, decline and organ damage which altogether constitute the incidence of age-related diseases (ARD) which finally limit lifespan.Citation3 ARD comprise senescence coupled diseases like cancer, stroke, infarction, Alzheimer and Parkinson, diabetes type 2 and many more which increase exponentially with age. Most interestingly, ARD can be delayed by slowing down the aging process due to a deactivation of the mTOR pathway.Citation3 Originally, TOR was identified in the yeast Saccharomyces cerevisiae as a target of inhibition by rapamycin, an antifungal agent that suppresses the immune system and is therefore applied as an immunosuppressant following organ transplantation.Citation1 Later, mTOR was purified from mammalian cells and also shown to be sensitive to rapamycin.Citation4
Subsequent studies revealed that mTOR functions in 2 different multiprotein complexes: mTOR complex 1 (mTORC1), which is sensitive to rapamycin, and mTOR complex 2 (mTORC2), which is not.Citation2 Rapamycin forms a gain-of-function complex with the intracellular FK506-binding protein (FKBP12), which directly interacts with mTOR and inhibits mTOR when it is part of mTORC1.Citation5,6 mTORC1 is activated by environmental nutrients as well as by different growth factors such as insulin and insulin-like growth factor. The role of the mTORC1 kinase complex in the regulation of aging was first revealed using RNA interference to knock down let363/CeTor in Caenorhabditis elegans, which significantly increased the worm's lifespan.Citation7 Although the mTOR signaling pathway is fundamental for developmental growth, it contributes to aging and ARD when development is completed thus providing an evolutionarily conserved molecular link between growth and aging.Citation8 Accordingly, one study recently reported an increase of the lifespan of female mice by a gene, hNAG-1, which regulates energy metabolism and the mTOR signaling pathway thus being of potential therapeutic use in obesity-related diseases.Citation9 Moreover, a circadian clock dependent mechanism has been documented both in vivo and in cell culture to impact the control of aging and metabolism through negative regulation of mTORC1 by the transcriptional factor BMAL1.Citation10 Abnormalities in mTOR regulation have been found in various human diseases that are associated with aging, including neurodegenerative diseases and cancer. Alterations to the mTOR pathway are also associated with obesity and type 2 diabetes.Citation11 It is therefore no surprise that numerous recent studies focused on mTOR and its inhibitors. Currently, various derivatives of rapamycin named “rapalogs” with improved pharmacokinetic properties are being developed and tested as novel anti-tumor treatments. Rapamycin has been demonstrated to increase the lifespan of mice.Citation12-14 However, rapamycin cannot currently be proposed as a geroprotector in humans due to serious side effects.
In recent years, microRNAs (miRNAs) have gained increasing attention as naturally occurring non-coding regulatory molecules, which are characterized by their short size, lack of a poly-A tail and their ability to bind cognate mRNA targets with sequence homology. As evolutionarily conserved key control elements of crucial regulatory pathways in plants and animals, miRNAs were shown to regulate gene expression post-transcriptionally by binding to the 3′ untranslated regions (UTRs) of target mRNAs, thereby inhibiting mRNA translation or reducing mRNA stability.Citation15-17 Although several thousand predicted miRNAs have been identified in a variety of organisms, many of their functions in the cell are still enigmatic.Citation18 As miRNAs often regulate multiple transcripts, they can be involved in several distinct biological processes, and they may act cooperatively. miRNAs also play an important role in tumor pathogenesisCitation19-22 and have been connected to the aging process.Citation23,24 Here we present findings suggesting that miR-496 contributes to the reduced expression of mTOR in PBMC of aged human volunteers.
Results
mTOR is expressed at lower levels in old blood donors
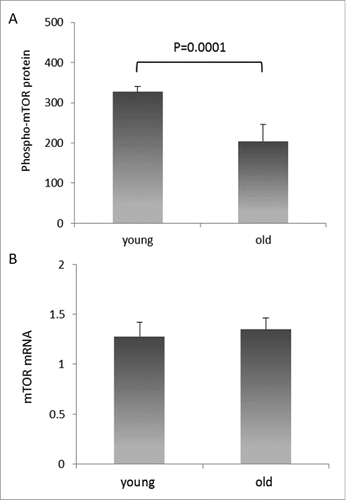
Phospho-mTOR protein expression was studied in young (average age: 24.8 yrs, range: 19–30 yrs,) and old (average age: 74.3 yrs, range: 61–90 yrs,) blood donors. As presented in , phospho-mTOR protein levels were significantly lower in PBMCs from old blood donors in comparison to young blood donors (P = 0.0001). However, mTOR mRNA was expressed to equal levels in the same cells (). Since microRNAs frequently act by stalling translation rather than degrading mRNA, the differential expression of mTOR protein in young vs. old individuals was compatible with microRNA(s) regulating mTOR.
Figure 1. Relative levels of mTOR mRNA and protein in PBMCs of healthy volunteers. (A) phospho-mTOR protein levels are reduced in PBMCs of older individuals. mTOR protein quantities were determined by ELISA in total cell lysates of PBMCs isolated from young and old blood donors, and are expressed as pg/ml per mg total protein. Error bars denote SEM (n = 40). (B) mTOR mRNA levels are similar in the same PBMCs. Detection of mTOR mRNA expression was performed by qRT-PCR on total cellular RNA prepared from the same PBMCs. Again, error bars denote SEM (n = 40).
Screening for microRNA target sites in the 3′UTR of mTOR mRNA
We applied the prediction software tool miRecords to identify miRNAs that potentially interact with the 3′UTR of mTOR mRNA. Only miRNAs that were identified by 3 or more of the 11 target prediction programs of miRecords were selected for further study by luciferase assays. miR-496 fulfilled these criteria; it was predicted to target mTOR by miRanda, Pita and RNA hybrid. The predicted alignment sequences of miR-496 comprised positions 746–752 and 847–853 in the 3′UTR of mTOR mRNA (total 3′UTR length: 950 bp).
miR-496 is significantly overproduced in old blood donors
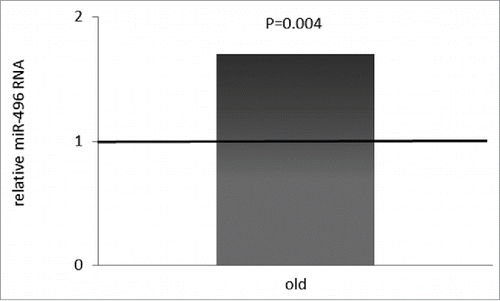
miR-496 expression was studied in the same PBMCs of the young and old individuals that were examined for mTOR expression. As summarized in , miR-496 expression was significantly up-regulated by ∼70 % in the PBMCs from old blood donors relative to young blood donors (P = 0.004). Thus, miR-496 expression and mTOR protein expression were inversely correlated in our cohorts of young and old individuals.
Figure 2. miR-496 levels in PBMCs of healthy young versus old volunteers. miR-496 was quantified by qRT-PCR on total cellular RNA prepared from PBMCs of the young and old blood donors. Error bars denote SEM (n = 40).
miR-496 functionally interacts with the 3′UTR of mTOR mRNA
Next, we examined whether miR-496 can suppress the expression of a transcript harbouring the mTOR 3′UTR. Inhibition of the 3′UTR of mTOR by miR-496 was analyzed using a standard luciferase reporter assay system. The luciferase reporter vectors contained either a firefly luciferase gene without the 3′UTR of mTOR (luc, no mTOR vector) or the 3′UTR of mTOR downstream of the luciferase gene (luc, mTOR vector). Co-transfection of HEK 293T cells with combinations of the luc mTOR vector and a miR-496 mimic, resulted in a significant, 65% decrease of luciferase activity in the presence of miR-496 (P = 0.0001; ), indicating that miR-496 inhibits the translation of the luciferase mRNA when fused to the 3′UTR of mTOR. By contrast, miR-496 had no effect on the control vector.
Figure 3. miR-496 reduces expression of a luciferase-mTOR 3′UTR fusion transcript in dependence of miR-496 complementary sequence motifs in the 3′UTR. Luciferase activity was measured in 293T cells upon co-transfection of miR-496 with Luc No mTOR, Luc mTOR, Luc mTOR Mut BS1, Luc mTOR Mut BS2 and Luc mTOR Mut BS 1+2 plasmids (50 ng per transfection), respectively. Error bars show SEM of 10 transfections. Transfection of control microRNA or no microRNA had no inhibitory effect on the expression of the luciferase construct.
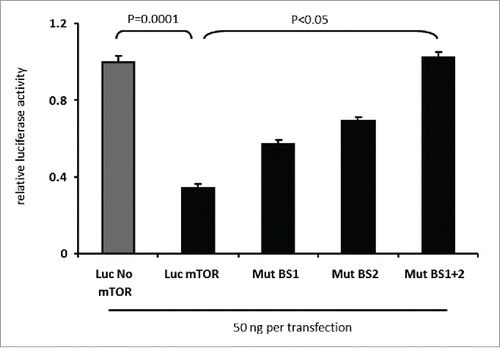
Site-directed mutagenesis of the seed sequence complementary sequences verifies the functional interaction of miR-496 with mTOR 3′UTR
To determine whether the predicted target sites for miR-496 are functional, the 2 target sequences in the 3′UTR of mTOR were mutated, individually or combined, and tested in a subsequent luciferase assay with miR-496 mimics. As summarized in , transfection with luc mTOR Mut BS1 and luc mTOR Mut BS 2, each of which has only one of the 2 sites mutated, still resulted in significant down-regulation of luciferase activity relative to the luc no mTOR-vector (P < 0.05). Strikingly, mutation of both miR-496 binding sites in the 3′UTR of mTOR sufficed to entirely suppress the inhibitory effect of miR-496 on luciferase expression (P < 0.05). These findings therefore support the notion that the 3′UTR of mTOR is subject to negative regulation by miR-496.
miR-496 down-regulates mTOR expression in HeLa-K cells
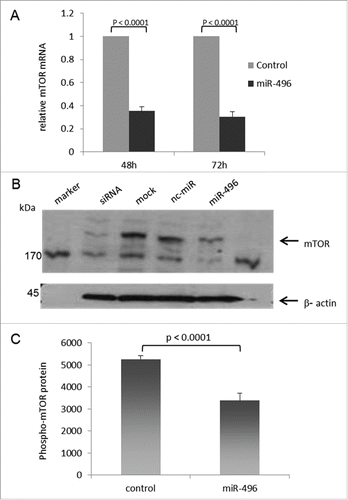
To test whether miR-496 can indeed control mTOR protein expression in a cell, HeLa-K cells were transfected with miR-496, and the expression of mTOR mRNA and mTOR protein was measured. mTOR mRNA was measured at 48 and 72 hours after transfection, whereas mTOR protein was determined at 48 h after transfection. As shown in , mTOR mRNA expression as determined by qRT-PCR was significantly down-regulated in HeLa-K cells transfected with miR-496 in comparison to control-transfected cells (P < 0.0001, respectively). Similarly, mTOR protein expression was significantly downregulated after transfection of HeLa-K cells with miR-496 relative to control-transfected cells and mock-transfected HeLa-K cells (P < 0.0001, ). As shown in Figure 4C, phospho-mTOR protein levels as determined by ELISA in total cell lysates of HeLa-K cells transfected with miR-496 are significantly down-regulated (P < 0.0001, respectively). Transfection of HeLa-K cells with a custom siRNA specifically targeting mTOR served as a positive control for the downregulation of mTOR in western blots.
Figure 4. Ectopic miR-496 reduces the endogenous mTOR mRNA and protein levels in human HeLa-K cells. (A) mTOR mRNA expression in HeLa-K cells at 48 h and 72 h after transfection with control microRNA or miR-496, determined by qRT-PCR. Error bars present SEM of 5 experiments. (B) mTOR protein expression in HeLa K cells at 48 h after mock-transfection or transfection with mTOR siRNA, control microRNA (nc-miR) or miR-496. Fifteen micrograms of total cell lysates from transfected HeLa K cells were subjected to immuno-protein gel blotting with goat polyclonal anti- human mTOR antibody AF15381 (1:1000), recognizing the 290 kDa mTOR protein. ß-actin served as loading control. (C) phospho-mTOR protein levels are reduced in miR-496 transfected HeLa-K cells. phospho-mTOR protein quantities were determined by ELISA in total cell lysates of HeLa-K cells, and are expressed as pg/ml per mg total protein. Error bars denote SEM (n = 10).
miR-496 and mTORC1 signaling
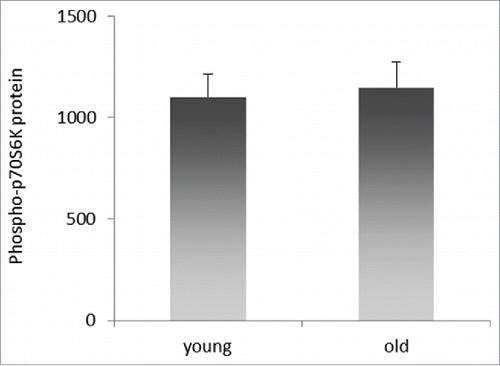
mTOR kinase is the active component of mTOR complex 1 (TORC1) and 2 (TORC2), of which TORC1 activity has been correlated with aging.Citation25 One of the critical downstream targets of TORC1 is p70S6 kinase which becomes active upon phosphorylation by TORC1. In , we showed a reduction of mTOR mRNA and protein levels upon miR-496 transfection in HeLa-K cells. To investigate if this is translated into physiologically meaningful downstream signaling, p70S6K phosphorylation was determined at 48 h after transfection with miR-496 or a negative control miRNA (nc-miR). In accord with miR-496 reducing mTOR/TORC1 activity, p70S6K phosphorylation levels were lower in HeLa-K cells transfected with miR-496 in comparison to control-transfected HeLa-K cells (P = 0.059; ). In , we compared the levels of phospho-mTOR in young and old cohorts and determined significantly lower levels of phospho-mTOR in old individuals. However, studying p70S6K phosphorylation in PBMCs from young (average age: 23.8 yrs, range: 20–29 yrs) and old (average age: 73 yrs, range: 64–85 yrs) individuals revealed no difference in p70S6K phosphorylation levels () contrasting our findings in HeLa-K cells. Altogether, our findings thus suggest that miR-496 inhibits the translation of mTOR mRNA, is overproduced in PBMCs of older individuals and there reduces the levels of mTOR protein compared to younger individuals. miR-496 also reduces the activity of mTOR/TORC1 signaling in HeLa-K cells that has been implicated in aging.
Figure 5. Phospho-p70S6K protein levels are reduced in miR-496 transfected HeLa-K cells. Quantities were determined by ELISA in total cell lysates of HeLa-K cells, and are expressed as pg/ml per mg total protein. Error bars denote SEM (n = 10).
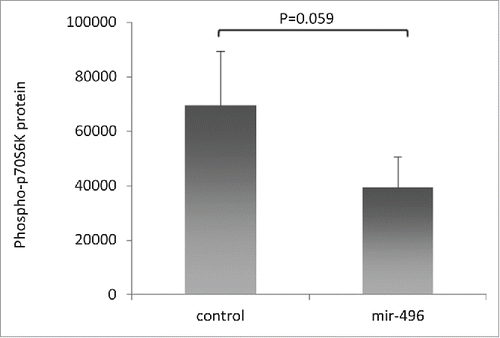
Figure 6. Relative levels of phospho-p70S6K protein in PBMCs of young and old blood donors. Quantities were determined by ELISA in total cell lysates of PBMCs isolated from young and old blood donors, and are expressed as pg/ml per mg total protein. Error bars denote SEM (n = 38 and n = 34, respectively).
Discussion
Numerous studies on experimental animal models have documented an inverse correlation between the activity of mTOR and longevity. For example, the life expectancy of fruit flies was significantly increased by TOR inhibition,Citation26 and the down-modulation of mTOR signaling increased the lifespan of yeast cells.Citation27,28 These examples indicate that the role of mTOR as part of the mTORC1 kinase complex in the regulation of aging is conserved from yeast to mammals. Potential mechanisms may comprise elevated stress resistance, changes in mitochondrial activity, the modulation of autophagy, effects on stem cell function, and alterations in the spectrum of translated mRNAs.Citation11,29 mTOR protein itself is regarded as being primarily controlled through post-translational mechanisms. We have identified here for the first time a microRNA, miR-496, that can inhibit the translation of mTOR mRNA. In addition, miR-496 levels were increased in PBMCs of old individuals in whom, conversely, the mTOR protein levels were decreased.
Although miR-496 expression correlated inversely with mTOR protein, we were unable to see this correlation at the level of mTOR mRNA. This suggests that mTOR mRNA may not be subject to degradation upon contact with miR-496 in PBMCs but instead, subject to translational inhibition. It is currently believed that in many cell systems, mRNA degradation follows upon the binding of a perfectly complementary microRNA whereas translational inhibition is the typical result of the binding of an imperfectly complementary microRNA.Citation30,31 However, this is not a strict rule. miR-496 seed sequence turned out to be perfectly complementary to the 3′UTR positions 746–752 and 847–853 of the mTOR mRNA. Thus, the actual endpoint of miR-496 binding to mTOR mRNA, degradation or translation inhibition, may be controlled through other, not complementarity-related factors, of which some may be connected to the cell type (here: PBMC). This might in part explain why we were finding mTOR mRNA decrease under miR-496 mimics in HeLa-K cells while we failed to observe a similar decrease in PBMC. Moreover, miR-496 mimics in HeLa-K cells were present at high concentrations upon transfection, which may also support degradation of the target transcript. In any event, mTOR protein was down-regulated in both cell systems, HeLa-K and PBMC. A further finding that strengthened the suggestion that mTOR can be regulated by miR-496 was that miR-496 recognized 2 distinct target sites within the 3′UTR of mTOR mRNA and that these 2 sites co-operated in the inhibition in vitro. Target site co-operativity is a common finding in microRNA-mediated gene regulation.Citation32
To determine if the reduction of mTOR can affect mTOR signaling through TORC1, as indicated by mTOR S2448 phosphorylation,Citation33 we quantified the level of T389 phosphorylation of p70S6K, a downstream effector of TORC1. It turned out that in HeLa-K, a tumor cell line with highly active mTOR kinase and therefore significant p70S6K phosphorylation, knockdown of mTOR through miR-496 mimics let to a notable reduction in p70S6K phosphorylation, in support of our suggestion that miR-496 can control TORC1 signaling. However, p70S6K phosphorylation was not different in PBMCs of old individuals with high miR-496 and low mTOR levels compared to young individals with low miR-496 and high mTOR levels. It should be noted though that the non-transformed PBMCs as expected had much lower phospho-p70S6K levels Citation34 to begin with, compared to HeLa-K cells, and it was therefore unlikely to detect a further robust reduction in dependence of the miR-496/mTOR levels.
miRNAs were recently connected to the aging process and thus represent interesting subjects for aging research. For example, miRNAs may accelerate aging by contributing to cellular senescence whereas, on the other hand, they may slow down the aging process by acting as inhibitors, for instance, of the insulin- and mTOR-signaling pathways.Citation35 However, little is known precisely how miRNAs control the aging process. Data on potentially aging-relevant miRNAs largely originate from genome-wide miRNA microarray surveys.Citation24,36 A recently published microarray study including 863 human miRNAs compared the expression profiles of centenarians to those of younger individuals in blood cells. The study identified in centenarians clusters of downregulated miRNAs that are potentially involved in disease-associated metabolic pathways.Citation36 miR-496 was only moderately regulated in that study. Another survey investigating 800 miRNAs in PBMC of a young and old cohort identified 9 miRNAs as significantly down-regulated in old individuals.Citation24 Five of these miRNAs were associated with cancer. The study also predicted several target genes of these miRNAs as being significantly upregulated with increasing age. Notably, miR-496 was among the miRNAs that were identified in this study to be differentially regulated in PBMC of old compared to young subjects, consistent with our findings. However, the authors did not identify any targets of miR-496. In sum, the results of these surveys and our findings support the widely held view that changes in miRNA expression occur with increasing age and that their predicted target genes could impact aging. miR-496 may influence aging in part by controlling the insulin/mTOR-pathway. Thus, our findings may uncover a new mechanism of mTOR regulation in the human aging process.
Experimental procedures
Blood samples
A total of 80 blood samples were analyzed with respect to mTOR mRNA and protein expression. These probes comprised 40 blood probes from donors with an average age of 24.8 yrs (range 19–30 yrs, 25 males, 15 females) and 40 blood probes from donors of an average age of 74.3 yrs (range 61–90 yrs, 21 males, 19 females), respectively. The old cohort comprises 19 healthy old blood donors with no known disease background and 21 old blood donors with a minor disease background such as incisional hernia, aneurysma, haemorrhoids, varicose vains, thoracic stomach, or ruptures. For studying p70S6K expression a total of 72 blood samples were analyzed. These probes comprised 38 blood probes from donors with an average age of 23.8 yrs (range 20–29 yrs, 21 males, 17 females) and 34 blood probes from donors of an average age of 73 yrs (range 64–85 yrs, 18 males, 16 females), respectively. The young cohort of blood donors was collected from the blood transfusion service of the University of the Saarland. The old cohort of blood donors comprised patients who underwent surgical resection at our department between 2013 and 2014. All donors were unrelated individuals of Central European Caucasian ethnicity. Informed consent for blood procurement was obtained from all blood donors. The study was approved by the ethics committee of the medical association of the Saarland (code number 258/12).
RNA and protein isolation from PBMC
Peripheral Blood Mononuclear Cells (PBMC) were isolated from blood by density gradient centrifugation using the Biocoll Solution (Cat No. 6715, Biochrom, Berlin, Germany) according to the manufacturer's protocol. For RNA extraction the Qiagen miRNeasy Mini Kit (Cat No. 21704, Qiagen, Hilden, Germany) was applied which allows the isolation of total RNA including microRNAs from PBMCs. Proteins were isolated using an ethanol-bromochloropropane-water mix and the precipitate was resolved in a 4% SDS-solution. The details on the simultaneous isolation of proteins and nucleic acids from PBMCs have been described elsewhere.Citation37
miRNA targets prediction
miRNA target sites on the mTOR (NM_004958.2) 3′UTR were predicted using the prediction software tool miRecords (http://mirecords.biolead.org) which represents an integrated resource for animal miRNA–target interactions. The Predicted Targets component of miRecords stores predicted miRNA targets produced by 11 established miRNA target prediction programs.Citation38
Dual luciferase reporter assay
For the luciferase assays dual luciferase reporter vectors were used which contained either the 3′UTR of mTOR (Luc mTOR vector), a control with no 3′UTR (Luc No mTOR vector; both Genecopoeia Inc.; Rockville, MD, USA) or mutated 3′UTR of mTOR (Luc mTOR Mut vectors). For the reporter assays 293T cells were cultured in a 24-well plate for 24 h. At a confluency of approximately 80% cells were cotransfected with Luciferase mTOR vector, Luciferase No mTOR vector or Luciferase mTOR Mut vectors and miR-496 or negative control Pre-miR (nc-miR) miRNA mimics for 48 hours using Lipofectamine 2000 (Life Technologies, Carlsbad, CA). The activities of firefly (Photinus pyralis) and renilla (Renilla reniformis) luciferase were quantified with Renilla-Juice and Beetle-Juice (PJK GmbH, Kleinblitterdorf, Germany, Cat No. 102531 and 102511). After adjusting the Renilla buffer to pH5 a dual measurement was made.Citation39 For normalization of transfection differences firefly luciferase activity was related to Renilla luciferase activity. Luciferase activities of luciferase mTOR vector constructs were normalized to luciferase No mTOR vector constructs. All values were normalized to the negative control Pre-miR miRNA precursors.
Site-directed mutagenesis
Mutations spanning a 2 bp deletion were introduced into the 2 target sequences of the 3′UTR of mTOR. The mutated target sequences were then subjected to the luciferase assay. By deleting 2 basepairs, the predicted target sequence 5′-AATACTC-3′ was mutated to 5′-AACTC-3′ in target sequence 1 and 2 of the 3′UTR of mTOR. Site-directed mutations were generated by PCR using the HmiT006426-MT01 reporter vector (GeneCopoeia) as a template and the QuickChange Lightning Site-Directed Mutagenesis Kit (Agilent Technologies, Santa Clara, CA, USA) according to the manufacturer's instructions. In the first step of the mutagenesis process we mutated the first target sequence (position 746–752) by deleting 2 basepairs from the mTOR 3′UTR of Luciferase reporter vector HmiT006426-MT01 resulting in the mutated vector Luc mTOR Mut BS1. Similarly, we introduced the same deletion into the second target sequence of the 3′UTR of mTOR (position 847–853) resulting in the mutated vector Luc mTOR Mut BS2. Subsequently, vector Luc mTOR Mut BS1 was applied as a template to introduce a mutation into the second target sequence of the 3′UTR of mTOR, resulting in vector Luc mTOR Mut BS1+2 which carries the mutations in both target sequences.
The primers used for site-directed mutagenesis of the first target sequence at position 746–752 were:
Forward: 5′ GTTTTCAGTGGTCAAAACTCTGTTTAGAGCAAGG 3′
Reverse: 5′ CCTTGCTCTAAACAGAGTTTTGACCACTGAAAAC 3′
The primers used for site-directed mutagenesis of the second target sequence at position 847–853 were:
Forward: 5′ GAGCAGAACAAACTCAACTAAATGCACAAAG 3′
Reverse: 5′ CTTTGTGCATTTAGTTGAGTTTGTTCTGCTC 3′
The mutagenized plasmids were isolated using the Qiagen Miniprep Kit (Qiagen). The mutations were confirmed by DNA sequencing (Seq-it, Kaiserslautern, Germany) of the region containing the mutation. Large scale plasmid isolations were performed using the Machery Nagel Plasmid Midiprep PC 100 Kit (Machery Nagel, Düren, Germany). The modified plasmids were designated Luc mTOR Mut BS1, Luc mTOR Mut BS2 and Luc mTOR Mut BS1+2, respectively.
miRNA transfections
miRNA transfection of HeLa-K cells was performed according to the Lipofectamin 2000 Transfection Reagent Handbook from Life technologies (Life technologies, Carlsbad, CA, USA). Briefly, cells were trypsinized, counted, and on average 1 × 10⁵ cells per well of a 12-well plate were seeded and incubated overnight. For the transfection of HeLa-K cells with miRNA mimics, 5 nM of miRNA mimics were diluted in 100 µl of OptiMEM and 6 µl of Lipofectamin 2000 were diluted in 94 µl of OptiMEM and incubated for 5 min. The two samples were then mixed and incubated for 20 min to allow formation of complexes. These were then added drop-wise to the cells and incubated under their normal growth conditions. Gene expression of mTOR was monitored for 48 and 72 hours after transfection with miR-496, at the levels of mRNA and protein, using qRT PCR and western Blot, respectively. Control samples with untransfected cells, a mock-transfection with only transfection reagent, and a negative control miRNA (nc-miR) were also tested. The Pre-miR miRNA precursor of miR-496 (Life Technologies, Cat No. 17100 ID: PM11793) and the negative control (Life Technologies, Cat No. 17110) were purchased from Life Technologies.
RNA and protein isolation from cell lines
To monitor mTOR gene expression after transfection, total RNA from cell lines was isolated using the Qiagen RNeasy Mini Kit (Cat No. 74104, Qiagen) according to manufacturer's instructions. Total protein was prepared by lysing cells with standard lysis buffer in 6-well dishes. Proteins were quantified with the Pierce BCA Protein Assay Reagent Kit (Pierce, Rockford, IL, USA).
Single-strand cDNA synthesis
For mTOR cDNA synthesis the High Capacity Reverse Transcrition Kit (Cat No. 4368814, Life Technologies) was applied to reversely-transcribe 1 µg of each total RNA sample isolated with the Qiagen RNeasy Mini Kit in a final reaction volume of 25 µl containing 1x TaqMan RT buffer, 4 mM dNTPs and 3 U/µl Multiscribe RT as well as 1x random primers. The cycler conditions were 10 min at 27°C, 120 min at 37°C and 5 sec at 85°C. For miRNA cDNA synthesis the TaqMan micro RNA Reverse Transcription kit from Life Technologies (Cat No. 4366597, Life Technologies) was applied to reversely-transcribe 10 ng of total RNA, isolated with the miRNeasy kit, in a final reaction volume of 15 µl containing 1x RT buffer, 1 mM dNTPs 3.33 U/µl Multiscribe RT and 0.05 U/µl RNase inhibitor. Instead of random primers, 1 x specific miR-496 primers were applied in the cDNA synthesis step. The cycler conditions were 30 min at 16°C, 30 min at 42°C and 5 min at 85°C.
Quantitative real-time PCR
qRT-PCR for mTOR mRNA detection was performed using 10 µl 2x Taqman Universal PCR Master Mix II and 1 µl mTOR gene expression assay (Cat No. Hs00234508_m1, Life Technolgies), 8 µl RNase-free water and 1 µl cDNA template (50 ng/µl). qRT-PCR for miR-496 (Cat No. TM 001042, Life Technolgies) detection was performed using the TaqMan MicroRNA Reverse Transcrition Kit (Cat No. 4366597, Life Technolgies) according to the manufacturer's instructions. Duplicates were run for all reactions together with no template controls and an additional control for DNA contamination where the reverse transcriptase was omitted. As detection system the ABI Prism 7900 sequence detector (Life Technologies) was programmed to an initial step of 10 min at 95°C, followed by 40 thermal cycles of 15 s at 95°C and 10 min at 60°C. The log-linear phase of amplification was monitored to obtain CT values for each RNA sample. The expression level of mTOR mRNA was analyzed in relation to the levels of housekeeping genes proteasome subunit β type-6 (PSMB6) and CyclophilinC (cycC) (Cat No. Hs00382586_m1 and Hs00181460_m1, Life Technologies) for mTOR, and RNU48 for miR-496 (Cat No. TM 001006, Life Technologies), respectively. Conversion of the individual CT values to the linear form was performed according to the 2-delta CT method and the relative standard curve method.
Cell culture and reagents
Human embryonic kidney (HEK) cell line 293T and cell line HeLa-K were maintained in Dulbecco's modified Eagle's medium (Life Technologies). The medium contained 10% (v/v) Fetal Bovine Serum Gold (PAA Laboratories GmbH, Pasching, Austria) and 1% (v/v) Penicillin/Streptomycin (Life Technologies). All cell lines were cultured in a 5% CO2-humidified incubator (Nalge Nunc International, Rochester, NY, USA) at 37°C.
Enzyme-linked immunosorbant assay (ELISA)
The expression levels of human phospho-mTOR protein and phospho-p70S6K in the different cell lysates were quantified by sandwich-type ELISA with the R&D duoset DYC896 and DYC1665, respectively (R&D Systems Inc., Minneapolis, MN, USA) according to the manufacturer's protocol. Samples were assayed in duplicate with all values calculated as the mean of 2 measurements. For measurement of protein expression levels, the absorbance at 450 nm (with 562 nm reference wavelength) was read in a 96-well microtiter plate reader. The phospho-mTOR protein concentration from each cell lysate was normalized to the total protein content of each sample.
Western blot analysis
Gene silencing was monitored at 72 h after transfection at the protein level using protein gel blotting. Total protein (15 µg/lane) was separated by SDS-PAGE using a 5% gel and blotted onto nitrocellulose membranes (Hybond ECL, Amersham Biosciences, Piscataway, NJ, USA). Membranes were blocked by incubation in Phosphat-buffered saline (PBS) containing 5% non-fat dry milk and 0.1% Tween 20, for 30 min at room temperature, and were then incubated overnight at 4°C with primary goat polyclonal anti-human mTOR antibody (1:1000, AF15371, R&D Systems Inc.). Blots were washed and incubated at room temperature for 1 h with donkey anti-goat HRP antibody (diluted 1:20,000, sc-2056, Santa Cruz Biotechnology, Santa Cruz, CA USA). Bands were visualized by ECL western blotting analysis systems (Amersham Biosciences). ß-actin served as a loading control.
Calculations and statistical methods
mTOR, miR-496 and luciferase expression profiles are shown as mean and standard error of the mean (SEM). Comparison of luciferase activities was performed with one way analysis of variance (ANOVA) with the Bonferroni-post-hoc-test. Where appropriate, the student's t-test was applied to test for group differences of continuous variables. The significance level was P < 0.05.
Disclosure of potential conflicts of interest
No potential conflicts of interest were disclosed.
Author contributions
C. Rubie was responsible for study concept and design, drafting of the manuscript, analysis and interpretation of data. K. Koelsch accounted for the acquisition of data, further development of practical techniques, the analysis and interpretation of data and critical revision of the manuscript. B. Halajda accounted for technical support. H. Eichler and M. Glanemann contributed crucial materials and funding. K. Roemer provided valuable help in discussions, contributed to the analysis and interpretation of data, the drafting of the manuscript and its critical revision. S. Wagenpfeil accounted for statistical analysis.
Acknowledgments
We are grateful to Jonas Zimmer for providing 19 healthy blood samples of old individuals and F. A. Grasser (Homburg, Germany) for providing us with the cell lines HeLa-K and 293T.
References
- Kunz J, Henriquez R, Schneider U, Deuter-Reinhard M, Movva NR, Hall MN. Target of rapamycin in yeast, TOR2, is an essential phosphatidylinositol kinase homolog required for G1 progression. Cell 1993; 73: 585-96; PMID:8387896; http://dx.doi.org/10.1016/0092-8674(93)90144-F.
- Johnson SC, Rabinovitch PS, Kaeberlein M. mTOR is a key modulator of ageing and age-related disease. Nature 2013; 493: 338-45; PMID:23325216; http://dx.doi.org/10.1038/nature11861.
- Blagosklonny MV. Answering the ultimate question “what is the proximal cause of aging? Aging 2012; 4: 861-77; PMID:23425777.
- Laplante M, Sabatini DM. mTOR signaling in growth control and disease. Cell 2012; 149: 274-93; PMID:22500797; http://dx.doi.org/10.1016/j.cell.2012.03.017.
- Brown EJ, Beal PA, Keith CT, Chen J, Shin TB, Schreiber SL. Control of p70 s6 kinase by kinase activity of FRAP in vivo. Nature 1995; 377: 441-6; PMID:7566123; http://dx.doi.org/10.1038/377441a0.
- Sabatini DM, Erdjument-Bromage H, Lui M, Tempst P, Snyder SH. RAFT1: a mammalian protein that binds to FKBP12 in a rapamycin dependent fashion and is homologous to yeast TORs. Cell 1994; 78: 35-43; PMID:7518356; http://dx.doi.org/10.1016/0092-8674(94)90570-3.
- Vellai T, Takacs-Vellai K, Zhang Y, Kovacs AL, Orosz L, Müller F. Genetics: influence of TOR kinase on lifespan in C. elegans. Nature 2003; 426: 620; PMID:14668850; http://dx.doi.org/10.1038/426620a.
- Blagosklonny MV, Hall MN. Growth and aging: a common molecular mechanism. Aging 2009; 1: 357-62; PMID:20157523.
- Wang X, Chrysovergis K, Kosak J, Kissling G, Streicker M, Moser G, Li R, Eling TE. hNAG-1 increases lifespan by regulating energy metabolism and insulin/IGF-1/mTOR signaling. Aging 2014; 6: 690-704; PMID:25239873.
- Khapre RV, Kondratova AA, Patel S, Dubrovsky Y, Wrobel M, Antoch MP, Kondratov RV. BMAL1-dependent regulation of the mTOR signaling pathway delays aging. Aging 2014; 6: 48-57; PMID:24481314.
- Parkhitko AA, Favorova OO, Khabibullin DI, Anisimov VN, Henske EP. Kinase mTOR: regulation and role in maintenance of cellular homeostasis, tumor development, and aging. Biochemistry 2014; 79: 88-101; PMID:24794724.
- Anisimov VN, Zabezhinski MA, Popovich IG, Piskunova TS, Semenchenko AV, Tyndyk ML, Yurova MN, Rosenfeld SV, Blagosklonny MV. Rapamycin increases lifespan and inhibits spontaneous tumorigenesis in inbred female mice. Cell Cycle 2011; 10: 4230-6; PMID:22107964; http://dx.doi.org/10.4161/cc.10.24.18486.
- Harrison DE, Strong R, Sharp ZD, Nelson JF, Astle CM, Flurkey K, Nadon NL, Wilkinson JE, Frenkel K, Carter CS, et al. Rapamycin fed late in life extends lifespan in genetically heterogeneous mice. Nature 2009; 460: 392-5; PMID:19587680.
- Wilkinson JE, Burmeister L, Brooks SV, Chan CC, Friedline S, Harrison DE, Hejtmancik JF, Nadon N, Strong R, Wood LK, et al. Rapamycin slows aging in mice. Aging Cell 2012; 11: 675-82; PMID:22587563; http://dx.doi.org/10.1111/j.1474-9726.2012.00832.x.
- Filipowicz W, Bhattacharyya SN, Sonenberg N. Mechanisms of post-transcriptional regulation by microRNAs: are the answers in sight? Nat Rev Genet 2008; 9: 102-14; PMID:18197166; http://dx.doi.org/10.1038/nrg2290.
- Carthew RW, Sontheimer EJ. Origins and mechanisms of miRNAs and siRNAs. Cell 2009; 136: 642-55; PMID:19239886; http://dx.doi.org/10.1016/j.cell.2009.01.035.
- Bartel DP. MicroRNAs: target recognition and regulatory functions. Cell 2009; 136: 215-33; PMID:19167326; http://dx.doi.org/10.1016/j.cell.2009.01.002.
- Krol J, Loedige I, Filipowicz W. The widespread regulation of microRNA biogenesis, function and decay. Nat Rev Genet 2010; 11: 597-10; PMID:20661255.
- Cowland JB, Hother C, Grønbaek K. MicroRNAs and cancer. APMIS 2007; 115: 1090-106; PMID:18042145; http://dx.doi.org/10.1111/j.1600-0463.2007.apm_775.xml.x.
- Farazi TA, Spitzer JI, Morozov P, Tuschl T. miRNAs in human cancer. J Pathol 2011; 223: 102-15; PMID:21125669; http://dx.doi.org/10.1002/path.2806.
- Vicinus B, Rubie C, Faust SK, Frick VO, Ghadjar P, Wagner M, Graeber S, Schilling MK. miR-21 functionally interacts with the 3′UTR of chemokine CCL20 and down-regulates CCL20 expression in miR-21 transfected colorectal cancer cells. Cancer Lett 2012; 316: 105-12; PMID:22099878; http://dx.doi.org/10.1016/j.canlet.2011.10.031.
- Rubie C, Kruse B, Frick VO, Kölsch K, Ghadjar P, Wagner M, Grässer F, Wagenpfeil S, Glanemann M. Chemokine receptor CCR6 expression is regulated by miR-518a-5p in colorectal cancer cells. J Transl Med 2014; 12: 48; PMID:24559209; http://dx.doi.org/10.1186/1479-5876-12-48.
- Boehm M, Slack F. A developmental timing microRNA and its target regulate life span in C. elegans. Science 2005; 310: 1954-7; PMID:16373574; http://dx.doi.org/10.1126/science.1115596.
- Noren Hooten N, Abdelmohsen K, Gorospe M, Ejiogu N, Zonderman AB, Evans MK. MicroRNA expression patterns reveal differential expression of target genes with age. PLoS One 2010; 5: 10724; http://dx.doi.org/10.1371/journal.pone.0010724.
- Huang K, Fingar DC. Growing knowledge of the mTOR signaling network. Semin Cell Dev Biol 2014; 0: 79-90; http://dx.doi.org/10.1016/j.semcdb.2014.09.011.
- Katewa SD, Kapahi P. Role of TOR signaling in aging and related biological processes in Drosophila melanogaster. Exp Gerontol 2011; 46: 382-90; PMID:21130151; http://dx.doi.org/10.1016/j.exger.2010.11.036.
- Powers RW, Kaeberlein M, Caldwell SD, Kennedy BK, Fields S. Extension of chronological life span in yeast by decreased TOR pathway signaling. Genes Dev 2006; 20: 174-84; PMID:16418483; http://dx.doi.org/10.1101/gad.1381406.
- Kaeberlein M, Powers RW, Steffen KK, Westman EA, Hu D, Dang N. Ker EO, Kirkland KT, Fields S, Kennedy BK. Regulation of yeast replicative life span by TOR and Sch9 in response to nutrients. Science 2005; 310: 1193-6; PMID:16293764; http://dx.doi.org/10.1126/science.1115535.
- Lamming DW, Ye L, Sabatini DM, Baur JA. Rapalogs and mTOR inhibitors as anti-aging therapeutics. J Clin Invest 2013; 123: 980-9; PMID:23454761; http://dx.doi.org/10.1172/JCI64099.
- Hutvágner G, Zamore PD. A microRNA in a multiple-turnover RNAi enzyme complex. Science 2002; 297: 2056-60; http://dx.doi.org/10.1126/science.1073827.
- Sun W, Julie Li YS, Huang HD, Shyy JY, Chien S. MicroRNA: a master regulator of cellular processes for bioengineering systems. Annu Rev Biomed Eng 2010; 12: 1-27; PMID:20415587; http://dx.doi.org/10.1146/annurev-bioeng-070909-105314.
- Szczyrba J, Löprich E, Wach S, Jung V, Unteregger G, Barth S, Grobholz R, Wieland W, Stöhr R, Hartmann A. The microRNA profile of prostate carcinoma obtained by deep sequencing. Mol Cancer Res 2010; 8: 529-38; PMID:20353999; http://dx.doi.org/10.1158/1541-7786.MCR-09-0443.
- Copp J, Manning G, Hunter T. TORC-specific phosphorylation of mTOR: phospho-Ser2481 is a marker for intact mTORC2. Cancer Res 2009; 69: 1821-7; PMID:19244117; http://dx.doi.org/10.1158/0008-5472.CAN-08-3014.
- Gomez-Cambronero J, Frye T, Baumann M. Ribosomal p70S6K basal activity increases upon induction of differentiation of myelomonocytic leukemic cell lines HL60, AML14 and MPD. Leuk Res 2004; 28: 755-62; PMID:15158097; http://dx.doi.org/10.1016/j.leukres.2003.11.012.
- Grillari J, Hackl M, Grillari-Voglauer R. MiR-17-92 cluster: ups and downs in cancer and aging. Biogerontology 2010; 11: 501-16; PMID:20437201; http://dx.doi.org/10.1007/s10522-010-9272-9.
- ELSharawy A, Keller A, Flachsbart F, Wendschlag A, Jacobs G, Kefer N, Brefort T, Leidinger P, Backes C, Meese E. Genome-wide miRNA signatures of human longevity. Aging Cell 2012; 11: 607-16; PMID:22533606; http://dx.doi.org/10.1111/j.1474-9726.2012.00824.x.
- Chey S, Claus C, Liebert UG. Improved method for simultaneous isolation of proteins and nucleic acids. Anal Biochem 2011; 411: 164-6; PMID:21094121; http://dx.doi.org/10.1016/j.ab.2010.11.020.
- Xiao F, Zuo Z, Cai G, Kang S, Gao X, Li T. miRecords: an integrated resource for microRNA-target interactions. Nucleic Acids Res 2009; 37: D105-10; PMID:18996891; http://dx.doi.org/10.1093/nar/gkn851.
- Dyer BW, Ferrer FA, Klinedinst DK, Rodriguez R. A noncommercial dual luciferase enzyme assay system for reporter gene analysis. Anal Biochem 2000; 282: 158-61; PMID:10860516; http://dx.doi.org/10.1006/abio.2000.4605.