
ABSTRACT
Background: Prolonged mitotic arrest in response to anti-cancer chemotherapeutics, such as DNA-damaging agents, induces apoptosis, mitotic catastrophe, and senescence. Disruptions in mitotic checkpoints contribute resistance to DNA-damaging agents in cancer. MAD2 has been associated with checkpoint failure and chemotherapy response. In this study, a novel splice variant of MAD2, designated MAD2γ, was identified, and its association with the DNA damage response was investigated.
Methods: Endogenous expression of MAD2γ and full-length MAD2 (MAD2α) was measured using RT-PCR in cancer cell lines, normal foreskin fibroblasts, and tumor samples collected from patients with testicular germ cell tumors (TGCTs). A plasmid expressing MAD2γ was transfected into HCT116 cells, and its intracellular localization and checkpoint function were evaluated according to immunofluorescence and mitotic index.
Results: MAD2γ was expressed in several cancer cell lines and non-cancerous fibroblasts. Ectopically expressed MAD2γ localized to the nucleus and reduced the mitotic index, suggesting checkpoint impairment. In patients with TGCTs, the overexpression of endogenous MAD2γ, but not MAD2α, was associated with resistance to cisplatin-based chemotherapy. Likewise, cisplatin induced the overexpression of endogenous MAD2γ, but not MAD2α, in HCT116 cells.
Conclusions: Overexpression of MAD2γ may play a role in checkpoint disruption and is associated with resistance to cisplatin-based chemotherapy in TGCTs.
Introduction
MAD2 is an important activator of the mitotic spindle assembly checkpoint (SAC), which delays the onset of anaphase in response to microtubule disruption or misaligned or unattached kinetochores during mitosis.Citation1 SAC impairment causes cells to prematurely enter anaphase, resulting in chromosome missegregation, aneuploidy or chromosome instability. Aberrant MAD2 expression has been demonstrated to play a role in these chromosomal abnormalities in different types of cancerous cells, including those derived from testicular cancer,Citation2 esophageal adenocarcinoma,Citation3 ovarian cancer,Citation4 colorectal cancer,Citation5 cervical cancer,Citation6 breast cancer,Citation7 and gastric cancer,Citation8 among others.
The SAC has emerged as a promising target for cancer therapy. Targeting the SAC ultimately targets mitosis, offering a greater possibility to kill cancer cells than simply inhibiting the cell cycle.Citation9 Physically or chemically damaged DNA causes problems in kinetochore attachment, triggering the SAC and causing prolonged mitotic arrest,Citation10 which in turn induces apoptosis, mitotic catastrophe, mitotic slippage or senescence.Citation11 Consequently, if the SAC is impaired or disrupted in human cancer cells, it may contribute resistance both to spindle inhibitors and DNA-damaging agents.Citation12,13 MAD2 plays an important role in the SAC-mediated mitotic delay that occurs in response to DNA-damaging agents. In fact, several studies have demonstrated an association between aberrant MAD2 expression and resistance or sensitivity to DNA damage both in vitro and in vivo.Citation6,14-19
In addition to MAD2, the aberrant expression of the transcriptional variant MAD2β has been implicated in the response to DNA damage, as reported by Yin et al.Citation20 MAD2β expression has only been detected in gastric cancer cell lines showing resistance to adriamycin and vincristine and not in adriamycin- and vincristine-sensitive cells. MAD2β expression has also been correlated with a decrease in mitotic index and an increase in the number of multinucleated cells, suggesting a perturbation in the SAC. Therefore, MAD2β expression has been associated with resistance to chemotherapeutic agents that induce DNA damage or inhibit spindle formation, and this resistance is attributed to a failure in SAC signaling.
In this study, we report the discovery of a new isoform of MAD2, which we have named MAD2γ. In making this discovery, we have renamed full-length MAD2 as MAD2α for clarity. MAD2γ is derived from the alternative splicing of MAD2 pre-mRNA; this splicing excludes exons 2 and 3 and generates a transcript that is smaller than MAD2α and MAD2β. MAD2γ is ubiquitously expressed in several cancer cell lines and in normal primary foreskin fibroblasts. The ectopic expression of MAD2γ in the SAC-competent colorectal cancer cell line HCT116 reduced the mitotic index, suggesting an impairment of the SAC. In contrast, the endogenous expression of MAD2γ in HCT116 cells significantly increased in response to treatment with the DNA-damaging agent cisplatin, and this expression was significantly augmented in patients with testicular germ cell tumors (TGCTs) who exhibited resistance to cisplatin-based chemotherapy. This finding suggests that there is an association between MAD2γ expression and resistance to cisplatin and that the resistance phenotype may be related to the SAC dysfunction that can be observed in HCT116 cells. These results highlight the importance of exploring the splice variants of different SAC components, which may compromise SAC signaling and the response to cancer chemotherapy.
Results
MAD2γ expression in different cell lines
MAD2 mRNA expression was analyzed in several distinct cancer cell lines and normal foreskin fibroblasts (passage 4 and 9) by semiquantitative RT-PCR using a pair of primers flanking exon 1 and exon 5 of MAD2. In addition to the expected MAD2 band of approximately 620 bp, 2 additional bands were observed (). DNA sequencing revealed that the upper band corresponded to the human MAD2L1 gene described by Li et al.,Citation21 which is designated MAD2α () in this work. The middle band of approximately 500 bp corresponded to MAD2 mRNA without the third exon, which was likely a result of alternative splicing. In fact, the sequence of this band corresponded to MAD2β, a spliced isoform of MAD2 that Yin et al.Citation20 reported previously (). Finally, the third band of approximately 350 bp was determined to be a MAD2 transcript without exons 2 and 3 (). Through the UCSC Genome Browser and GenBank, this transcript was found to correspond to an expressed sequence tag (EST) generated by alternative splicing of the MAD2 mRNA [GenBank: BP368492]. Therefore, based on this sequence analysis, a third MAD2 isoform is reported in this work; this isoform was designated MAD2γ. The MAD2β and MAD2γ isoforms were differentially expressed in the different cell lines tested. Specifically, MAD2γ expression was higher in HCT116, SiHa, T24, 1A6, U373, and T47D cells. In contrast, MAD2γ was expressed at lower levels in the following cell lines: SW48, HT29, SW480, HeLa, C33, and NT2-D1. MAD2γ expression was also low in normal primary foreskin fibroblasts, including the Fib-P4 and Fib-P9 cell lines ().
Figure 1. Expression of MAD2 isoforms in multiple cancer cell lines and primary non-cancerous foreskin fibroblasts. The three MAD2 isoforms were simultaneously amplified by pairing forward and reverse oligonucleotides to exons 1 and 5, respectively (). β-actin was used as an internal control. The three isoforms were differentially expressed in different cancer cell lines and in non-cancerous primary foreskin fibroblasts (Fib-P4 and Fib-P9).
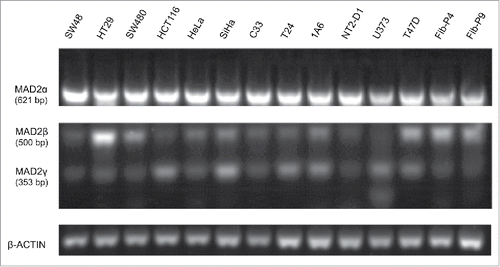
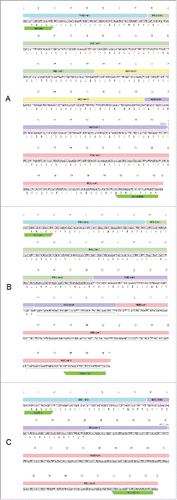
Figure 2. The sequences of the 3 MAD2 isoforms. (A) The coding sequence for MAD2L1 contains a 618-bp open reading frame (pale pink bar) consisting of 5 exonsCitation22 that are translated into a 205-amino acid protein. (B) MAD2β, first described by Yin et al.,Citation20 does not contain exon 3 of MAD2. The transcript contains a 273-bp open reading frame that is translated into a 90-amino acid protein. (C) In MAD2γ, exons 2 and 3 are also removed by alternative splicing. MAD2γ contains a 126-bp open reading frame, which is predicted to encode a 41-amino acid peptide.
MAD2γ overexpression reduces mitotic arrest in a SAC-competent cancer cell line
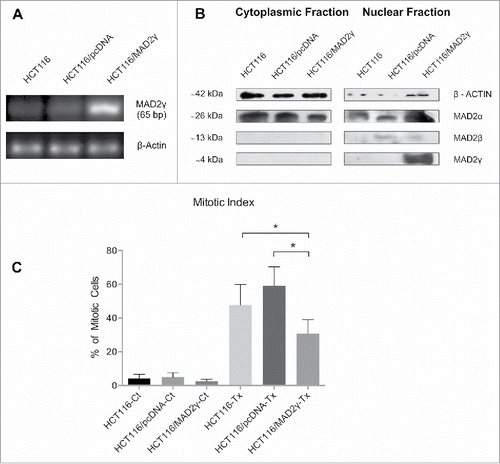
As indicated previously, aberrant levels of MAD2α or MAD2β correlate with SAC impairment and chromosome missegregation.Citation20,23 To test whether MAD2γ plays a role in SAC regulation, mitotic index was evaluated in the HCT116 cell line, which has no chromosome instability and contains a near-diploid karyotype and an intact, fully functional SAC.Citation24,25 To accomplish this, HCT116 cells were transfected with the pcDNA-MAD2γ construct, and MAD2γ expression levels were confirmed by RT-PCR and Western blot (). The cells were then treated with 100 nM Taxol, which disrupts microtubule dynamics and activates the SAC. MAD2γ overexpression significantly decreased the number of cells in mitotic arrest compared to non-transfected control cells and cells transfected with a control vector (). This result suggests that SAC activation is less efficient in cells overexpressing MAD2γ compared to cells expressing normal levels of MAD2γ and MAD2α.
Figure 3. Ectopic expression of MAD2γ in the SAC-competent colorectal cancer cell line HCT116. (A) MAD2γ mRNA expression was determined by semiquantitative RT-PCR using specific primers pairing exon 1 (forward) and the spliced region between exon 1 and exon 4 (reverse). (B) Protein levels were detected by Western blotting using the MAD2 polyclonal antibody N-19, which recognizes the N-terminus of MAD2. (C) When cells were treated with 100 nM Taxol for 12 h, MAD2γ overexpression significantly decreased the mitotic index compared to non-transfected cells (HCT116-Tx, P = 0.03) and cells transfected with empty vector (HCT116/pcDNA-Tx, P = 0.0001).
In silico identification of a MAD2-interacting motif in the C-terminal domain of MAD2γ
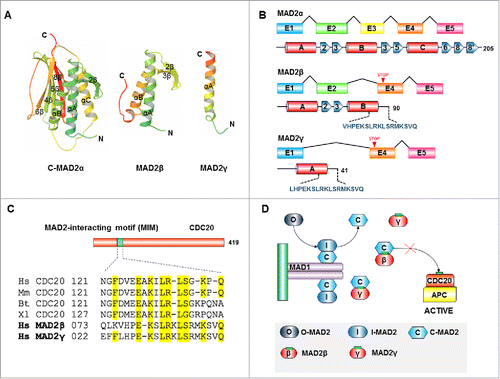
The fact that MAD2γ overexpression might be related to less efficient SAC activation is quite remarkable. Similar results were previously obtained when examining MAD2β overexpression in gastric cancer cell lines.Citation20 This prompted us to investigate whether a possible structural interaction exists between MAD2 isoforms and other SAC components that might explain the inefficient SAC activation. To accomplish this, we utilized in silico analysis of MAD2 isoforms to predict the tertiary structures of MAD2γ and MAD2β using homology modeling. We found that both proteins lack α-helix C and β-strand 6 from MAD2α (). These regions mediate interactions with key proteins involved in SAC signaling.Citation26-31 Therefore, it is likely that the MAD2 isoforms do not interact with other SAC components in the same manner as MAD2α. However, we identified a MAD2-interacting motif-like (MIM) in the C-terminal domains of the MAD2 isoforms. A frameshift and a premature stop codon in both MAD2 isoforms generates a new C-terminal of 17 amino acids length that is not present in MAD2α (). Sequence alignment results revealed that this motif is similar to a motif present in CDC20 (), which is also present in MAD1 and SGO2 and only mediates interactions with the active conformer of MAD2α (C-MAD2α).Citation27,32,33 This finding suggests that a possible interaction exists between MAD2γ and MAD2β with C-MAD2α. Ryan et al. demonstrated that MAD1 overexpression weakened mitotic checkpoints by modulating MAD2.Citation34 Therefore, we propose a model whereby overexpression of MAD2 isoforms disrupts SAC signaling (; see Discussion for details).
Figure 4. In silico identification of a MAD2-interacting motif present in the C-terminal domains of MAD2 isoforms. (A) Ribbon diagram of the crystal structure of the active conformation of MAD2α (C-MAD2α) (PDB ID 1GO4) and a homology model of the isoforms MAD2β and MAD2γ. (B) Exon arrangements (above) and secondary structures of the MAD2α and MAD2 isoforms (below). Alternative splicing produces 2 MAD2 isoforms: MAD2β and MAD2γ, from which exon 3 and exon 2 and 3 are excluded, respectively. A frameshift occurs in exon 4 causing a premature stop codon and the creation of a distinct C-terminus peptide (shown in dark blue). (C) Sequence alignment of the C-terminal peptides of MAD2 isoforms with the MAD2-interacting motifs (MIMs) of CDC20 proteins from various organisms (Hs, Homo sapiens; Mm, Mus musculus; Bt, Bos taurus; Xl, Xenopus laevis). (D) Schematic drawing of SAC inhibition by MAD2 isoforms. Upon SAC activation, MAD1/C-MAD2α catalyzes the conversion of the cytosolic conformation of MAD2α (O-MAD2α) to C-MAD2α. We propose that MAD2 isoforms could compete with CDC20 for C-MAD2α binding. Because the MAD2(β/γ)/C-MAD2 complex cannot bind to CDC20, free CDC20 can activate APC/C and induce the onset of anaphase.
Subcellular localization of MAD2γ in HCT116 cells
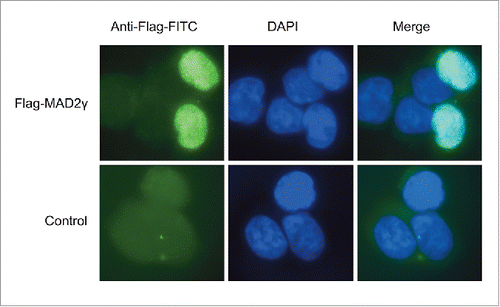
Western blotting revealed that MAD2γ was localized exclusively in the nucleus when it was ectopically overexpressed in HCT116 cells, whereas MAD2α was present in both the nucleus and the cytoplasm (). Several studies have reported that MAD2 localizes to the nucleus, the cytoplasm, or both, depending on the cell line, tumor sample, and histological subtype.Citation2,4,35,36 MAD2, along with MAD1, has also been observed to localize to the nuclear envelope because it interacts with the nuclear pore complex (NPC).Citation37-39 To confirm the subcellular localization of MAD2γ, HCT116 cells were transiently transfected with the Flag-MAD2γ construct. As shown in , immunofluorescence staining for Flag confirmed the nuclear localization of MAD2γ.
Figure 5. Subcellular localization of MAD2γ. HCT116 cells were transiently transfected with the Flag-MAD2γ construct. After 48 h, the cells were fixed, and MAD2γ was immunostained with a FITC-coupled-anti-DDDK tag (ab1259, Abcam, Biotech Co., Cambridge, UK). MAD2γ localized to the nucleus.
Expression of MAD2γ is associated with cisplatin resistance in patients with testicular germ cell tumors
In addition to regulating the SAC, MAD2α has been associated with the DNA damage response.Citation10,14,18 Additionally, disruption of the SAC itself has been associated with resistance to DNA-damaging chemotherapeutic agents.Citation13,14 In particular, MAD2α expression has been implicated in resistance or sensitivity to cisplatin both in vivo and in vitro.Citation6,15 The N-terminal domain of MAD2α has been proposed to be important for this relationship because it interacts with proteins involved in the DNA damage response.Citation17 Therefore, because MAD2γ retains the N-terminal domain of MAD2α and because its overexpression disrupts SAC function, as observed by the reduced mitotic index in HCT116 cells (), MAD2γ expression could also be related to cellular response to cisplatin. To test this hypothesis, primary tumor samples from patients with TCGTs were evaluated because this type of tumor is well known for its sensitivity to cisplatin-based chemotherapy. Indeed, over 80% of patients with TCGTs can be cured using this treatment regimen.Citation40 However, 20–30% of patients are chemoresistant to the therapy and thus do not respond to it.Citation41 The tumor samples were subdivided into 2 groups (cisplatin-resistant and cisplatin-sensitive) based on previously reported clinical criteria.Citation41 The clinical characteristics of patients is summarised in . MAD2γ and MAD2α expression levels were measured in both groups of patients by quantitative real-time RT-PCR. The cut-off value used to distinguish overexpression or underexpression of both isoforms was not arbitrarily defined. Rather, to establish this value, ROC analysis was employed. To accomplish this, we calculated the area under the curve (AUC) and determined the maximum Youden index (J). The best cut-off point for the relative expression of MAD2γ was 3.091 (AUC = 0.6962, 95% CI [0.569, 0.822], J = 0.3923) (). Above this cut-off point, the expression of MAD2γ was significantly higher in the group of patients who were resistant to cisplatin. Approximately 70% of these resistant patients overexpressed MAD2γ, whereas only approximately 30% of the sensitive patients overexpressed this isoform (P = 0.003) (). The patients who overexpressed MAD2γ were more likely to exhibit resistance to chemotherapy (OR = 5.25, 95% CI [1.623783, 16.97425], P = 0.006), and when considering all other clinical characteristics of patients, overexpression of MAD2γ also correlates with the clinical response (OR = 3.73, 95% CI [0.99830, 13.94025], P = 0.05). The best cut-off point for the relative expression of MAD2α was 1.33 (AUC = 0.4032, 95% CI [0.269, 0.538], J = 0.1315). Based on this value, there was no significant difference in the expression of MAD2α between the 2 patient groups (P = 0.98) (). Therefore, MAD2γ overexpression in patients with TGCTs is associated with resistance to cisplatin-based chemotherapy.
Figure 6. MAD2γ and MAD2α expression in patients with TGCTs. (A) ROC curve analysis and the Youden index were used to determine the optimal cut-off point for distinguishing overexpression and underexpression of MAD2γ and MAD2α between cisplatin-sensitive and cisplatin-resistant patients. The cut-off value for MAD2γ was 3.091, and for MAD2α it was 1.33. (B) and (C) Relative quantification of MAD2γ and MAD2α expression levels between both groups of patients as measured by quantitative real-time RT-PCR. MAD2γ was overexpressed in 70% of the cisplatin-resistant patients, whereas only 30% of the cisplatin-sensitive patients overexpressed MAD2γ. There was no significant difference in MAD2α expression between the groups of patients.
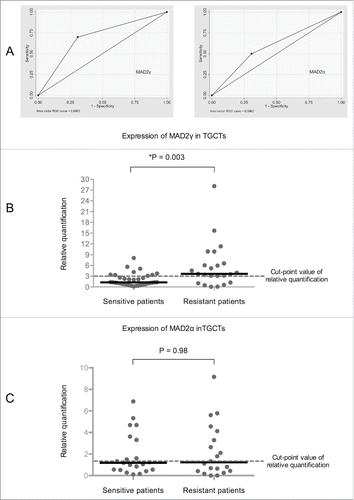
Table 1. Clinical and histopathological characteristics of patients with TGCT
MAD2γ expression increases in response to treatment with cisplatin
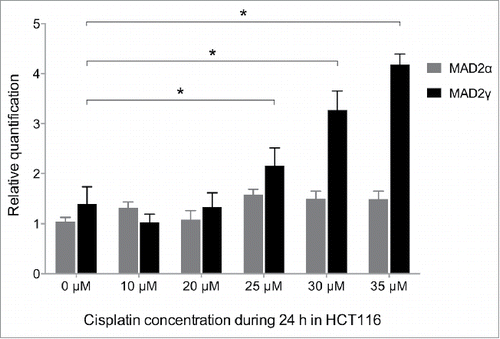
To test whether MAD2γ overexpression can be induced by cisplatin and is associated with chemoresistance in vitro, the SAC-competent colorectal cancer cell line HCT116 was exposed to different concentrations of cisplatin for 24 h. Afterwards, RNA was extracted, and MAD2γ and MAD2α expression levels were measured by quantitative real-time RT-PCR. A statistically significant dose-dependent increase in MAD2γ expression was observed, especially above the IC50 value at 24 h (IC50 = 29 µM). In contrast, MAD2α expression only slightly increased, and this effect was not significant (). Therefore, resistant cells responded to cisplatin treatment by upregulating only the MAD2γ isoform. This result is consistent with our previous results in which MAD2γ, but not MAD2α, was overexpressed in patients who were resistant to cisplatin-based chemotherapy.
Figure 7. MAD2γ and MAD2α expression levels change in response to treatment with cisplatin. The colorectal cancer cell line HCT116 was exposed to different concentrations of cisplatin for 24 h. MAD2γ and MAD2α expression levels were then measured by quantitative real-time RT-PCR. The cells exhibited a significant increase in MAD2γ expression, especially when treated with concentrations close to the IC50 value (IC50 = 29 µM). In contrast, the expression of MAD2α did not significantly change.
Discussion
In the current study, we identified a novel spliced isoform of MAD2, designated MAD2γ. MAD2γ was expressed at distinct levels in several cancer cell lines as well as in non-cancerous primary foreskin fibroblasts (). MAD2β, another spliced variant of MAD2,Citation20 was also expressed in all of these cancer cell lines, including the normal fibroblasts. Therefore, beyond any association with chemotherapeutic responses in cancer cells, MAD2β and MAD2γ may also have a function in normal cells. In several cell lines, an inverse correlation between levels of MAD2β and MAD2γ was observed (except for the SW48, HeLa, C33A and NT2-D1 cell lines), although the reason for this relationship is unknown. Yin et al.Citation20 suggested that alternative splicing not only changes the structures of transcripts and their encoded proteins but also can regulate transcript quantity. This is consistent with other proteins, such as the SR protein SC35 and the SR-like protein HTRA2-Beta1, both of which can regulate alternative splice site selection in a concentration-dependent manner.Citation42,43 Although an inverse relationship between MAD2α and MAD2γ levels was not observed, MAD2β expression was not assessed in our study. It would be interesting to investigate whether there is mechanistic interplay between MAD2β and MAD2γ expression.
Because MAD2α is an important regulator of the SAC and MAD2β has been shown to disturb the SAC,Citation20 we investigated the role of MAD2γ in a SAC-competent cell line, namely, the HCT116 cell line. A significantly lower mitotic index was observed in HCT116 cells stably transfected with MAD2γ compared to non-transfected cells (), indicating that MAD2γ overexpression led to SAC incompetence. Interestingly, other spliced variants that compromise SAC activation have been reported, such as the MAD1 isoform MAD1β, reported by Sze et al.Citation44 MAD1β was shown to induce SAC impairment, chromosome bridge formation, and aberrant chromosome numbers in hepatoma cell lines treated with spindle inhibitors. It was suggested that MAD1β may play an opposing role to MAD1α in the SAC in hepatocarcinogenesis. In contrast, the overexpression of MAD2β reduced the mitotic index and decreased apoptosis in gastric cancer cell lines resistant to adriamycin and vincristine, as reported by Yin et al.Citation20
The fact that MAD2γ and MAD2β overexpression interferes with SAC activation prompted us to investigate whether these isoforms could interact with other components involved in SAC signaling. As we propose in , the overexpression of MAD2γ interfered with SAC activation through interactions formed with C-MAD2α through a MIM motif in the MAD2γ peptide sequence. This motif is formed by a frameshift caused by alternative splicing. Upon SAC activation, as has been reported elsewhere, the MAD1-MAD2α core complex is recruited to unattached kinetochores, where it helps convert the latent, open conformer of MAD2α (O-MAD2α) into a closed conformer (C-MAD2α). This conversion generates a diffusible signal that inhibits APC/CDC20. If MAD2γ could bind to C-MAD2α through the MIM in MAD2γ, the overexpression of this isoform could saturate the existing pool of C-MAD2α. If C-MAD2α is not available to bind to CDC20, then CDC20 becomes activated along with APC, leading to a premature onset of anaphase (). Although pull-down experiments should be performed to prove our model, the model is consistent with another study that found that overexpression of MAD1, another MIM-containing protein, weakened SAC signaling by modulating C-MAD2α.Citation34
Triggering the SAC and prolonging mitotic arrest are effective approaches for cancer therapy.Citation9,13 The cellular response to prolonged mitotic arrest includes apoptosis, mitotic catastrophe, mitotic slippage and senescence, depending on the cell line and inhibitor used.Citation11 Thus, disruptions to the SAC in human cancers may contribute to resistance to both spindle inhibitors and DNA-damaging agents.Citation12,20,45 In the current study, overexpression of MAD2γ disrupted SAC activation in HCT116 cells, a cell line with no chromosome instability that contains a near-diploid karyotype and an intact, fully functional SAC. Interestingly, MAD2γ overexpression was also associated with resistance to cisplatin in patients with TGCTs (). Similarly, treatment of HCT116 cells with cisplatin induced the overexpression of MAD2γ to above the IC50 value in resistant cells (). These results suggest that cancer cells might resist SAC disruption-mediated DNA damage by altering the splicing of MAD2 to favor the expression of MAD2γ rather than MAD2α. It would be interesting to overexpress MAD2γ and investigate the subsequent effects on SAC signaling and cisplatin response in the testicular cancer cell line NT2-D1, which is sensitive to cisplatinCitation41 and shows low expression of MAD2γ ().
MAD2γ localized to the nucleus when it was ectopically overexpressed in HCT116 cells. MAD2 has been reported to localize either to the nucleus, the cytoplasm, or both, depending on the cell line, tumor sample, and histological subtype.Citation2,4,6,35,36 MAD2 also localizes to the nuclear envelope because it interacts with the NPC (Quimby et al, 2005; Schweizer et al, 2013; Rodriguez-Bravo et al, 2014).Citation37,39,46 Lee et al.Citation38 reported that the C-terminal domain of MAD2 is necessary for its interaction with TPR, a component of the NPC. Depletion of TPR shifted the localization of MAD2 from the NPC to the nucleus, which resulted in decreased binding of MAD2 to MAD1 and CDC20, premature induction of anaphase, and chromosome missegregation. Because MAD2γ lacks the C-terminal domain of MAD2α, it was expected to localize to the nucleus. It would be interesting to determine whether this localization pattern disturbs the normal function of MAD2α. Furthermore, the localization of MAD2γ to the nucleus could be associated with its overexpression in tumor tissues. Therefore, it would be interesting to use antibodies to correlate MAD2γ expression and intracellular localization between tumor samples from patients sensitive and resistant to DNA-damaging agents such as cisplatin.
Whether the alternative splicing of SAC components is an adaptive mechanism employed by tumor cells to survive persistent chemotherapy remains to be investigated. It has been proposed that alternative splicing may be involved in the cellular response to DNA damage. Filippov et al.Citation47 demonstrated that osteosarcoma cells treated with mitomycin C modulated their response to DNA damage and survived by upregulating the splicing factor SRp55, which in turn shifted the splicing pattern of the FAS receptor gene (CD95) to favor expression of the soluble, pro-survival isoform (sFAS) over the membrane-bound, pro-apoptotic isoform (FAS). Therefore, cells can respond to external stressors by regulating the expression of splicing factors and changing the splicing profiles of target genes. It would be interesting to determine whether any of the components of the SAC are splicing targets. Remarkable results concerning the induction of mitotic catastrophe in cancer cells were reported by Mu et al.Citation48 The inhibition of the splicing factor CDC5L, which modulates the splicing of a set of genes involved in mitosis and DNA damage response, induced dramatic mitotic arrest and sustained activation of the SAC, eventually leading to mitotic catastrophe. Therefore, it would be quite interesting to correlate the expression of SRp55 and CDC5L, the splicing of MAD1 and MAD2, the regulation of the SAC, the intracellular localization of MAD2γ, and the resistance or sensitivity to DNA-damaging agents in different cancer cell lines and tumor samples.
Overall, our data suggest that MAD2γ, a novel splicing variant of MAD2, may play a role in SAC impairment when it is overexpressed. Furthermore, inefficient mitotic arrest may be associated with resistance to DNA-damaging agents, such as cisplatin, which was observed in patients with TGCTs and in the SAC-competent colorectal cancer cell line HCT116. Our results highlight the importance of identifying alternative splicing events that may compromise both SAC function and the response to cancer therapy.
Material and methods
Cell lines and cell culture
The following cancer cell lines were maintained in DMEM (Life Technologies, Inc., Massachusetts, USA): HeLa, SiHa, and C33A (cervical cancer); T24 and 1A6 (bladder cancer); NT2-D1 (testicular cancer); T47D (breast cancer); SW48 and SW480 (colon cancer); and U373 (glioblastoma). The HCT116 and HT29 (colon cancer) cell lines were maintained in McCoy's 5A (Life Technologies, Inc., Massachusetts, USA). In addition, normal foreskin fibroblasts (passage 4) were maintained until passage 9 in DMEM-F12 (Life Technologies, Inc., Massachusetts, USA). All media were supplemented with 10% FBS and 1% antibiotic/antimycotic (Life Technologies, Inc., Massachusetts, USA). All cells were incubated at 37°C in a 5% CO2 atmosphere.
Primary tumor samples from patients with testicular germ cell tumors
Our recruitment of patients with TGCTs from the National Cancer Institute of Mexico and the clinical criteria used to determine their sensitivity and resistance to cisplatin-based chemotherapy were described previously.Citation41 Briefly, all patients were required to have undergone 3 to 4 cycles of a bleomycin-etoposide-cisplatin (BEP) regimen. After the third or fourth BEP cycle, each patient's response was determined by an oncologist based on tumor markers (α-fetoprotein, β-human chorionic gonadotropin, and lactic dehydrogenase) and computed tomography of the thorax and abdomen. Patients were classified as sensitive if they presented a complete radiological response with no evidence of residual lesions, negativisation of TM to BEP, complete surgical resection of residual lesions, and histopathology showing necrosis, fibrosis, or mature teratoma. In contrast, patients were classified as resistant if they presented a persistence of TM after BEP, unresectable residual disease, or radiologically and biochemically determined disease progression. The project was submitted to and approved by the local IRB, and informed consent was obtained from all patients. A total of 59 tumor samples were used in this study, corresponding to 36 cisplatin-sensitive tumors and 23 cisplatin-resistant tumors.
Plasmid construction and stable transfection
cDNA for MAD2γ was first cloned into a pcDNA3.0 expression vector and then subcloned into a VL3-Flag-MAD2 vector from which the MAD2α insert had been previously removed. The original VL3-Flag-MAD2 plasmid was a gift from Robert Benezra (Addgene plasmid #16047, Massachusetts, USA).Citation49 The HCT116 cell line was transfected with VL3-Flag-MAD2γ, pcDNA-MAD2γ, and empty vector (pcDNA3.0) constructs using Lipofectamine LTX with PLUS reagent (Life Technologies, Inc., Massachusetts, USA) according to the manufacturer's instructions. Stably transfected cells were designated HCT116/MAD2γ and HCT116/pcDNA and selected with 800 µg/ml G418 (Promega Corp. Wisconsin, USA) for 3 weeks. Thereafter, they were maintained in growth medium containing 100 µg/ml G418.
Determining the mitotic index
A total of 300,000 stably transfected HCT116 cells and non-transfected control cells were seeded in 6-well plates in triplicate and allowed to grow for 24 h. The cells were synchronized using a double block of 2 mM thymidine (Sigma-Aldrich Co., Missouri, USA). The cells were washed twice with PBS and then incubated in medium containing 100 nM Taxol for 12 h to activate the SAC. Afterwards, the cells were incubated in a hypotonic solution (HEPES 10 mM, EGTA 260 nM, and KCl 40 mM) at 37°C for 30 min, collected in conical tubes and fixed with a cold mixture of methanol / acetic acid (3:1) at 20°C for 30 min. The fixed cells were washed 3 times with the fixation mixture and mounted on cold slides. Once dried, the cells were stained with eosin and methylene blue. All of the cells on each slide were counted using a Metafer-4 slide-scanning platform (Metasystems GmbH, Altlussheim, Germany) mounted onto a motorized vertical Axio-Imager Z2 microscope (Carl Zeiss AG, Jena, Germany). Mitotic indices were determined by evaluating the percentages of mitotic cells per total number of counted cells.
Cytotoxicity assays and cisplatin treatment
The IC50 of cisplatin for HCT116 cells was determined using a sulforhodamine B (SRB) cell viability assay.Citation50 Briefly, 3,000 cells per well were seeded into 96-well plates and allowed to grow for 24 h. The plates were incubated with a range of cisplatin (Technoplatin, Columbia Lab, Mexico) concentrations for 24 h. The cells were then fixed with cold 10% trichloroacetic acid at 4°C for 1 h, washed, air-dried, and stained with SRB for 30 min. The excess dye was removed by washing with 1% acetic acid. Once dried, the protein-bound dye was dissolved in 10 mM Tris-base solution for OD determination at 510 nm using a microplate reader. The analysis was performed independently in triplicate 3 times, and the IC50 values were calculated using linear regression analysis of dose-response data. To determine the relative expression levels of MAD2γ and MAD2α in HCT116 cells following treatment with cisplatin, 300,000 cells per well were seeded in triplicate into 6-well plates and allowed to grow for 24 h. The cells were then treated with increasing concentrations of cisplatin (10, 20, 25, 30 and 35 µM) and incubated for 24 h before RNA extraction. The experiment was performed 3 times.
RNA extraction and RT-PCR
Total RNA was isolated from the cancer cell lines and non-cancerous primary foreskin fibroblasts using an RNeasy Mini Kit (QIAGEN Co., Limburg, Netherlands). Total RNA was also isolated from the primary tumor samples using TRIzol (Life Technologies, Inc. Massachusetts, USA). The expression levels of all of the MAD2 isoforms were assessed by semiquantitative RT-PCR using a forward primer flanking exon 1 (5′ (HindIII) TAAGCTTAA-GCCATGGCGCTGCAGCTC 3′) and a reverse primer flanking exon 5 (5′ (BamHI) CGGATCC-TCAGTCATTGACAGGAATTTTGTAGG 3′). The PCR conditions were as follows: 94°C/ 2 min; 30 cycles of 94°C/ 30 s, 74°C/ 30 s, 72°C/ 30 s; and 72°C/ 5 min. β-Actin was used as a reference. MAD2γ was specifically amplified using a forward primer complementary to exon 1 (5′ GGGAGCAGGGAATCACC 3′) and a reverse primer complementary to the spliced region between exon 1 and exon 4 (5′ CTCTGGGTGCAAGAAGAACTC 3′). The PCR conditions were as follows: 94°C/ 2 min; 30 cycles of 94°C/ 30 s, 64°C/ 30 s, 72°C/ 30 s; and 72°C/ 5 min. The expression of MAD2γ and MADα in tumor samples and HCT116 cells was quantitatively measured using Taqman probes and primers designed with Primer Express 3.0 software (Life Technologies, Inc. Massachusetts, USA). For MAD2γ, the probe sequence was VIC-CGAGTTCTTCTTGCACCCA, the forward primer was 5′ GGGAGCGCCGAAATCG 3′, and the reverse primer was 5′ CCTGGATAGCTTTCTGAGACTTTTCT 3′. For MAD2α, the probe sequence was NED-ATTGAGTGTGACAAGACT, the forward primer was 5′ CCTGGAAAGATGGCAGTTTGA 3′, and the reverse primer was 5′ TGGGTGCACTGTCATCTTTTG 3′. The PCR conditions were as follows: 50°C/ 2 min; 95°C/ 10 min; and 40 cycles of 95°C/ 30 s and 60°C/ 1 min. HPRT was used as a reference (Hs99999909_m1, Cat. 4331182 from Life Technologies, Inc. Massachusetts, USA.). The data were analyzed using the 2−ΔΔCT method.
Protein extraction and western blotting
Total protein was extracted using lysis buffer (50 mM HEPES, 250 mM NaCl, 5 mM EDTA, and 0.1% NP40) containing protease and phosphatase inhibitors (EZBlockTM, AMS, Biotechnology, Abingdon, UK). In addition, proteins were extracted from nuclear and cytoplasmic fractions using a Chemicon Nuclear Extraction Kit (Millipore Corp, Cat 2900, Darmstadt, Germany) according to the manufacturer's instructions. Protein concentrations were measured using a DC Protein Assay kit (Bio-Rad Inc., California, USA). Equal amounts of protein were loaded onto an 18% SDS-polyacrylamide gel for electrophoresis and then transferred onto PVDF membranes (Immobilon-P, Millipore Corp. Darmstadt, Germany). The membranes were then incubated overnight with MAD2-N19 or β-actin primary antibodies (Santa Cruz Biotechnology, CA, USA). After incubation with the corresponding secondary antibodies, the resultant signals were visualized using Novex Chemiluminescent HRP substrate (Life Technologies, Inc., Massachusetts, USA.).
In silico analysis of MAD2 isoforms
The tertiary structures of the MAD2 isoforms were predicted by homology modeling using SwissModel (http://swissmodel.expasy.org/). Ribbon diagrams were generated using the program CCP4MG (http://www.ccp4.ac.uk/MG/).Citation51 Protein sequences were obtained from http://www.uniprot.org/,Citation52 and sequence alignment was performed using MUSCLE (http://www.ebi.ac.uk/Tools/msa/muscle/).Citation53
Statistical analysis
Differences in mitotic indices were analyzed by both the Kruskal-Wallis test and Student's t-test. Differences in endogenous levels of MAD2γ and MAD2α in HCT116 cells in response to treatment with cisplatin were analyzed using a 2-way ANOVA test. A Mann-Whitney test was performed to compare the expression levels of endogenous MAD2γ or MAD2α between patients with cisplatin-sensitive and cisplatin-resistant tumors; a P value of ≤ 0.05 was considered statistically significant. The cut-off point used to distinguish between overexpression or underexpression of MAD2γ and MADα between the 2 groups of patients was not arbitrarily defined. Instead, it was based on an analysis of the receiver operating characteristic (ROC) curve, which is frequently used in biomedical research to evaluate the effectiveness of biomarkers for distinguishing individuals with certain medical conditions from individuals without that condition, e.g., resistance to cisplatin.Citation54 The effectiveness is determined by calculating the area under the curve (AUC), where 0.5 is random discrimination and 1.0 is perfect discrimination. The Youden index (J) is the maximum vertical distance or difference between the ROC curve and the diagonal or random variation line and is commonly used to establish the optimal cut-off point.Citation55,56 The association between MAD2γ expression and cisplatin resistance was analyzed using a logistic regression model, and the odds ratio and 95% confidence interval were determined to quantify the association. Data analysis was conducted using Stata V.12 (Texas, USA) and GraphPad-Prism V.6 (California, USA).
Disclosure of potential conflicts of interest
No potential conflicts of interest were disclosed.
Acknowledgments
We thank Dr. Robert Benezra for providing the VL3 (Flag-MAD2) plasmid (Addgene plasmid # 16047) and Dr. Ethan Dmitrovsky for his valuable comments.
Funding
This work was supported by the Programa de Apoyo a Proyectos de Investigación e Innovación Tecnológica (PAPIIT, IN208815). ALS was a fellow of the PhD Program of Biomedical Sciences at the National Autonomous University of Mexico (UNAM) and the National Cancer Institute of Mexico (INCan)
References
- Holland AJ, Cleveland DW. Boveri revisited: chromosomal instability, aneuploidy and tumorigenesis. Nat Rev Mol Cell Biol 2009; 10:478-87; PMID:19546858; http://dx.doi.org/10.1038/nrm2718
- Fung MK, Cheung HW, Wong H-L, Yuen H-F, Ling M-T, Chan K-W, Wong Y-C, Cheung AL, Wang X. MAD2 expression and its significance in mitotic checkpoint control in testicular germ cell tumour. Biochim Biophys Acta 2007; 1773:821-32; PMID:17467818; http://dx.doi.org/10.1016/j.bbamcr.2007.03.014
- Doak SH, Jenkins GJ, Parry EM, Griffiths AP, Baxter JN, Parry JM. Differential expression of the MAD2, BUB1 and HSP27 genes in Barrett's oesophagus-their association with aneuploidy and neoplastic progression. Mutat Res 2004; 547:133-44; PMID:15013707; http://dx.doi.org/10.1016/j.mrfmmm.2003.12.009
- Furlong F, Fitzpatrick P, O'Toole S, Phelan S, McGrogan B, Maguire A, O'Grady A, Gallagher M, Prencipe M, McGoldrick A, et al. Low MAD2 expression levels associate with reduced progression-free survival in patients with high-grade serous epithelial ovarian cancer. J Pathol 2012; 226:746-55; PMID:22069160; http://dx.doi.org/10.1002/path.3035
- Li G-Q, Li H, Zhang H-F. Mad2 and p53 expression profiles in colorectal cancer and its clinical significance. World J Gastroenterol 2003; 9:1972-5; PMID:12970887; http://dx.doi.org/10.3748/wjg.v9.i9.1972
- Sumi T, Morishita M, Nakano Y, Teramae M, Fukuda T, Nobeyama H, Yoshida H, Matsumoto Y, Yasui T, Ishiko O. Expression of mitotic-arrest deficiency 2 predicts the efficacy of neoadjuvant chemotherapy for locally advanced uterine cervical cancer. Exp Ther Med 2012; 3:341-6; PMID:22969893; http://dx.doi.org/10.3892/etm.2011.407
- Scintu M, Vitale R, Prencipe M, Gallo AP, Bonghi L, Valori VM, Maiello E, Rinaldi M, Signori E, Rabitti C, et al. Genomic instability and increased expression of BUB1B and MAD2L1 genes in ductal breast carcinoma. Cancer Lett 2007; 254:298-307; PMID:17498870; http://dx.doi.org/10.1016/j.canlet.2007.03.021
- Tanaka K, Nishioka J, Kato K, Nakamura A, Mouri T, Miki C, Kusunoki M, Nobori T. Mitotic checkpoint protein hsMAD2 as a marker predicting liver metastasis of human gastric cancers. Jpn J Cancer Res 2001; 92:952-8; PMID:11572763; http://dx.doi.org/10.1111/j.1349-7006.2001.tb01186.x
- Manchado E, Guillamot M, Malumbres M. Killing cells by targeting mitosis. Cell Death Differ 2012; 19: 369-77; PMID:22223105; http://dx.doi.org/10.1038/cdd.2011.197
- Mikhailov A, Cole RW, Rieder CL. DNA damage during mitosis in human cells delays the metaphase/anaphase transition via the spindle-assembly checkpoint. Curr Biol 2002; 12:1797-806; PMID:12419179; http://dx.doi.org/10.1016/S0960-9822(02)01226-5
- Jackson JR, Patrick DR, Dar MM, Huang PS. Targeted anti-mitotic therapies: can we improve on tubulin agents? Nat Rev Cancer 2007; 7:107-17; PMID:17251917; http://dx.doi.org/10.1038/nrc2049
- Kasai T, Iwanaga Y, Iha H, Jeang K-T. Prevalent loss of mitotic spindle checkpoint in adult T-cell leukemia confers resistance to microtubule inhibitors. J Biol Chem 2002; 277:5187-93; PMID:11729202; http://dx.doi.org/10.1074/jbc.M110295200
- Tao W. The mitotic checkpoint in cancer therapy. Cell Cycle 2005; 4:1495-9; PMID:16258280; http://dx.doi.org/10.4161/cc.4.11.2130
- Nitta M, Kobayashi O, Honda S, Hirota T, Kuninaka S, Marumoto T, Ushio Y, Saya H. Spindle checkpoint function is required for mitotic catastrophe induced by DNA-damaging agents. Oncogene 2004; 23: 6548-58; PMID:15221012; http://dx.doi.org/10.1038/sj.onc.1207873
- Cheung HW, Jin D-Y, Ling M-T, Wong Y-C, Wang Q, Tsao SW, Wang X. Mitotic arrest deficient 2 expression induces chemosensitization to a DNA-damaging agent, cisplatin, in nasopharyngeal carcinoma cells. Cancer Res 2005; 65:1450-8; PMID:15735033; http://dx.doi.org/10.1158/0008-5472.CAN-04-0567
- Fung MK, Cheung H-W, Ling M-T, Cheung AL, Wong Y-C, Wang X. Role of MEK/ERK pathway in the MAD2-mediated cisplatin sensitivity in testicular germ cell tumour cells. Br J Cancer 2006; 95:475-84; PMID:16880791; http://dx.doi.org/10.1038/sj.bjc.6603284
- Fung MK, Han H-Y, Leung SC, Cheung HW, Cheung AL, Wong Y-C, Ling M-T, Wang X. MAD2 interacts with DNA repair proteins and negatively regulates DNA damage repair. J Mol Biol 2008; 381:24-34; PMID:18597777; http://dx.doi.org/10.1016/j.jmb.2008.05.080
- Dotiwala F, Harrison JC, Jain S, Sugawara N, Haber JE. Mad2 prolongs DNA damage checkpoint arrest caused by a double-strand break via a centromere-dependent mechanism. Curr Biol 2010; 20:328-32; PMID:20096585; http://dx.doi.org/10.1016/j.cub.2009.12.033
- Wang L, Yin F, Du Y, Chen B, Liang S, Zhang Y, Du W, Wu K, Ding J, Fan D. Depression of MAD2 inhibits apoptosis and increases proliferation and multidrug resistance in gastric cancer cells by regulating the activation of phosphorylated survivin. Tumour Biol 2010; 31:225-32; PMID:20440596; http://dx.doi.org/10.1007/s13277-010-0036-6
- Yin F, Du Y, Hu W, Qiao T, Ding J, Wu K, Liu Z, Fan D. Mad2beta, an alternative variant of Mad2 reducing mitotic arrest and apoptosis induced by adriamycin in gastric cancer cells. Life Sci 2006; 78:1277-86; PMID:16214181; http://dx.doi.org/10.1016/j.lfs.2005.06.034
- Li Y, Benezra R. Identification of a human mitotic checkpoint gene: hsMAD2. Science 1996; 274:246-8; PMID:8824189; http://dx.doi.org/10.1126/science.274.5285.246
- Gemma A, Hosoya Y, Seike M, Uematsu K, Kurimoto F, Hibino S, Yoshimura A, Shibuya M, Kudoh S, Emi M. Genomic structure of the human MAD2 gene and mutation analysis in human lung and breast cancers. Lung Cancer 2001; 32:289-95; PMID:11390010; http://dx.doi.org/10.1016/S0169-5002(00)00223-3
- Michel LS, Liberal V, Chatterjee A, Kirchwegger R, Pasche B, Gerald W, Dobles M, Sorger PK, Murty VV, Benezra R. MAD2 haplo-insufficiency causes premature anaphase and chromosome instability in mammalian cells. Nature 2001; 409:355-59; PMID:11201745; http://dx.doi.org/10.1038/35053094
- Lengauer C, Kinzler KW, Vogelstein B. Genetic instability in colorectal cancers. Nature 1997; 386:623-7; PMID:9121588; http://dx.doi.org/10.1038/386623a0
- Thompson SL, Compton DA. Examining the link between chromosomal instability and aneuploidy in human cells. J Cell Biol 2008; 180:665-72; PMID:18283116; http://dx.doi.org/10.1083/jcb.200712029
- Luo X, Fang G, Coldiron M, Lin Y, Yu H, Kirschner MW, Wagner G. Structure of the Mad2 spindle assembly checkpoint protein and its interaction with Cdc20. Nat Struct Biol 2000; 7: 224-9; PMID:10700282; http://dx.doi.org/10.1038/73338
- Sironi L, Mapelli M, Knapp S, De Antoni A, Jeang K-T, Musacchio A. Crystal structure of the tetrameric Mad1-Mad2 core complex: implications of a [safety belt] binding mechanism for the spindle checkpoint. EMBO J 2002; 21:2496-506; PMID:12006501; http://dx.doi.org/10.1093/emboj/21.10.2496
- Yang M, Li B, Liu C-J, Tomchick DR, Machius M, Rizo J, Yu H, Luo X. Insights into mad2 regulation in the spindle checkpoint revealed by the crystal structure of the symmetric mad2 dimer. Plos Biol 2008; 6:e50PMID:18318601; http://dx.doi.org/10.1371/journal.pbio.0060050
- Yang M, Li B, Tomchick DR, Machius M, Rizo J, Yu H, Luo X. p31comet blocks Mad2 activation through structural mimicry. Cell 2007; 131:744-55; PMID:18022368; http://dx.doi.org/10.1016/j.cell.2007.08.048
- Tipton AR, Wang K, Link L, Bellizzi JJ, Huang H, Yen T, Liu S-T. BUBR1 and closed MAD2 (C-MAD2) interact directly to assemble a functional mitotic checkpoint complex. J Biol Chem 2011; 286:21173-9; PMID:21525009; http://dx.doi.org/10.1074/jbc.M111.238543
- Hara M, Özkan E, Sun H, Yu H, Luo X. Structure of an intermediate conformer of the spindle checkpoint protein Mad2. Proc Natl Acad Sci U S A 2015; 112:11252-7; PMID:26305957; http://dx.doi.org/10.1073/pnas.1512197112
- Luo X, Tang Z, Rizo J, Yu H. The Mad2 spindle checkpoint protein undergoes similar major conformational changes upon binding to either Mad1 or Cdc20. Mol Cell 2002; 9:59-71; PMID:11804586; http://dx.doi.org/10.1016/S1097-2765(01)00435-X
- Orth M, Mayer B, Rehm K, Rothweiler U, Heidmann D, Holak TA, Stemmann O. Shugoshin is a Mad1/Cdc20-like interactor of Mad2. EMBO J 2011; 30:2868-80; PMID:21666598; http://dx.doi.org/10.1038/emboj.2011.187
- Ryan SD, Britigan EM, Zasadil LM, Witte K, Audhya A, Roopra A, Weaver BA. Up-regulation of the mitotic checkpoint component Mad1 causes chromosomal instability and resistance to microtubule poisons. Proc Natl Acad Sci U S A 2012; 109:E2205-14; PMID:22778409; http://dx.doi.org/10.1073/pnas.1201911109
- Wang L, Yin F, Du Y, Du W, Chen B, Zhang Y, Wu K, Ding J, Liu J, Fan D. MAD2 as a key component of mitotic checkpoint: A probable prognostic factor for gastric cancer. Am J Clin Pathol 2009; 131:793-801; PMID:19461085; http://dx.doi.org/10.1309/AJCPBMHHD0HFCY8W
- Burum-Auensen E, Skotheim RI, Schjølberg AR, Røislien J, Lothe RA, Clausen OP. Spindle proteins are differentially expressed in the various histological subtypes of testicular germ cell tumors. J Carcinog 2010; 9:1; PMID:20411023; http://dx.doi.org/10.4103/1477-3163.60358
- Quimby BB, Arnaoutov A, Dasso M. Ran GTPase regulates Mad2 localization to the nuclear pore complex. Eukaryot Cell 2005; 4:274-80; PMID:15701789; http://dx.doi.org/10.1128/EC.4.2.274-280.2005
- Lee SH, Sterling H, Burlingame A, McCormick F. Tpr directly binds to Mad1 and Mad2 and is important for the Mad1-Mad2-mediated mitotic spindle checkpoint. Genes Dev 2008; 22:2926-31; PMID:18981471; http://dx.doi.org/10.1101/gad.1677208
- Rodriguez-Bravo V, Maciejowski J, Corona J, Buch HK, Collin P, Kanemaki MT, Shah JV, Jallepalli PV. Nuclear pores protect genome integrity by assembling a premitotic and Mad1-dependent anaphase inhibitor. Cell 2014; 156: 1017-31; PMID:24581499; http://dx.doi.org/10.1016/j.cell.2014.01.010
- Schmoll HJ, Souchon R, Krege S, Albers P, Beyer J, Kollmannsberger C, Fossa SD, Skakkebaek NE, de Wit R, Fizazi K, et al. European consensus on diagnosis and treatment of germ cell cancer: a report of the European Germ Cell Cancer Consensus Group (EGCCCG). Ann Oncol 2004; 15:1377-99; PMID:15319245; http://dx.doi.org/10.1093/annonc/mdh301
- Mendoza J, Martínez J, Hernández C, Pérez-Montiel D, Castro C, Fabián-Morales E, Santibáñez M, González-Barrios R, Díaz-Chávez J, Andonegui MA, et al. Association between ERCC1 and XPA expression and polymorphisms and the response to cisplatin in testicular germ cell tumours. Br J Cancer 2013; 109:68-75; PMID:23807173; http://dx.doi.org/10.1038/bjc.2013.303
- Stoilov P, Daoud R, Nayler O, Stamm S. Human tra2-beta1 autoregulates its protein concentration by influencing alternative splicing of its pre-mRNA. Hum Mol Genet 2004; 13:509-24; PMID:14709600; http://dx.doi.org/10.1093/hmg/ddh051
- Sureau A, Gattoni R, Dooghe Y, Stévenin J, Soret J. SC35 autoregulates its expression by promoting splicing events that destabilize its mRNAs. EMBO J 2001; 20:1785-96; PMID:11285241; http://dx.doi.org/10.1093/emboj/20.7.1785
- Sze KM, Ching Y-P, Jin D-Y, Ng IO. Role of a novel splice variant of mitotic arrest deficient 1 (MAD1), MAD1beta, in mitotic checkpoint control in liver cancer. Cancer Res 2008; 68:9194-201; PMID:19010891; http://dx.doi.org/10.1158/0008-5472.CAN-08-2600
- Masuda A, Maeno K, Nakagawa T, Saito H, Takahashi T. Association between mitotic spindle checkpoint impairment and susceptibility to the induction of apoptosis by anti-microtubule agents in human lung cancers. Am J Pathol 2003; 163:1109-16; PMID:12937152; http://dx.doi.org/10.1016/S0002-9440(10)63470-0
- Schweizer N, Ferrás C, Kern DM, Logarinho E, Cheeseman IM, Maiato H. Spindle assembly checkpoint robustness requires Tpr-mediated regulation of Mad1/Mad2 proteostasis. J Cell Biol 2013; 203:883-93; PMID:24344181; http://dx.doi.org/10.1083/jcb.201309076
- Filippov V, Schmidt EL, Filippova M, Duerksen-Hughes PJ. Splicing and splice factor SRp55 participate in the response to DNA damage by changing isoform ratios of target genes. Gene 2008; 420:34-41; PMID:18571879; http://dx.doi.org/10.1016/j.gene.2008.05.008
- Mu R, Wang Y-B, Wu M, Yang Y, Song W, Li T, Zhang W-N, Tan B, Li A-L, Wang N, et al. Depletion of pre-mRNA splicing factor Cdc5L inhibits mitotic progression and triggers mitotic catastrophe. Cell Death Dis 2014; 5:e1151; PMID:24675469; http://dx.doi.org/10.1038/cddis.2014.117
- Wassmann K, Liberal V, Benezra R. Mad2 phosphorylation regulates its association with Mad1 and the APC/C EMBO J 2003; 22:797-806; PMID:12574116; http://dx.doi.org/10.1093/emboj/cdg071
- Voigt W. Sulforhodamine B assay and chemosensitivity. Methods Mol Med 2005; 110:39-48; PMID:15901925; http://dx.doi.org/10.1385/1-59259-869-2:039
- McNicholas S, Potterton E, Wilson KS, Noble ME. Presenting your structures: the CCP4mg molecular-graphics software. Acta Crystallogr D Biol Crystallogr 2011; 67: 386-94; PMID:21460457; http://dx.doi.org/10.1107/S0907444911007281
- The Uniprot Consortium. UniProt: a hub for protein information. Nucleic Acids Research 2015; 43(D1):D204–D212; http://dx.doi.org/10.1093/nar/gku989
- Li W, Cowley A, Uludag M, Gur T, McWilliam H, Squizzato S, Park YM, Buso N, Lopez R. The EMBL-EBI bioinformatics web and programmatic tools framework. Nucleic Acids Res 2015; 43:W580-4; PMID:25845596; http://dx.doi.org/10.1093/nar/gkv279
- Zou KH, Hall WJ, Shapiro DE. Smooth non-parametric receiver operating characteristic (ROC) curves for continuous diagnostic tests. Stat Med 1997; 16:2143-56; PMID:9330425; http://dx.doi.org/10.1002/(SICI)1097-0258(19971015)16:19%3c2143::AID-SIM655%3e3.0.CO;2-3
- Schisterman EF, Perkins NJ, Liu A, Bondell H. Optimal cut-point and its corresponding Youden Index to discriminate individuals using pooled blood samples. Epidemiology 2005; 16:73-81; PMID:15613948; http://dx.doi.org/10.1097/01.ede.0000147512.81966.ba
- Esteghamati A, Ashraf H, Khalilzadeh O, Zandieh A, Nakhjavani M, Rashidi A, Haghazali M, Asgari F. Optimal cut-off of homeostasis model assessment of insulin resistance (HOMA-IR) for the diagnosis of metabolic syndrome: third national surveillance of risk factors of non-communicable diseases in Iran (SuRFNCD-2007). Nutr Metab (Lond) 2010; 7: 26; PMID:20374655; http://dx.doi.org/10.1186/1743-7075-7-26