
ABSTRACT
Metabolic adaptations are emerging as common traits of cancer cells and tumor progression. In vitro transformation of NIH 3T3 cells allows the analysis of the metabolic changes triggered by a single oncogene. In this work, we have compared the metabolic changes induced by H-RAS and by the nuclear resident mutant of histone deacetylase 4 (HDAC4). RAS-transformed cells exhibit a dominant aerobic glycolytic phenotype characterized by up-regulation of glycolytic enzymes, reduced oxygen consumption and a defect in complex I activity. In this model of transformation, glycolysis is strictly required for sustaining the ATP levels and the robust cellular proliferation. By contrast, in HDAC4/TM transformed cells, glycolysis is only modestly up-regulated, lactate secretion is not augmented and, instead, mitochondrial oxygen consumption is increased. Our results demonstrate that cellular transformation can be accomplished through different metabolic adaptations and HDAC4/TM cells can represent a useful model to investigate oncogene-driven metabolic changes besides the Warburg effect.
Introduction
The Class IIa HDACs are important pleiotropic regulators expressed in all eukaryotic cells. The principal features of this gene family, which in mammals include HDAC4, 5, 7 and 9, are: i) the 14-3-3 dependent nuclear-cytoplasmic shuttling, ii) the poor lysine-deacetylase activity and iii) the presence of an extended amino-terminal region devoted to the interactions with different partners, including MEF2 transcription factors.Citation1,2 During embryogenesis, class IIa HDACs play critical roles in specific differentiation pathways, whereas in adults, they also transduce environmental signals to influence adaptive cellular responses.Citation3,4 The large range of differentiative/adaptive responses, under class IIa HDACs supervision, finds confirmation in the assorted genetic programs such as: cell motility, interaction with the ECM, cell cycle and survival/apoptosis, monitored by these enzymes.Citation5-8
In particular, recent studies have underlined the intricate relationships between class IIa HDACs and metabolism.Citation9,10,11 Kinases such as AMPK and SIKs, which fine-tune metabolic adaptations can also modulate class IIa nuclear/cytoplasmic shuttling via phosphorylation of 14-3-3 binding sites.Citation2 SIK2 modulates HDAC4 localization in the adipose tissue linked to the regulation of the GLUT4 transcription and glucose uptake.Citation12 In hepatocytes during fasting glucagon, through the inhibition of AMPK, favors the nuclear accumulation of class IIa HDACs. Here, HDAC4 and HDAC5 in complex with HDAC3 deacetylate and activate FOXO TFs (FOXO1 and FOXO3). FOXOs thus stimulate the transcription of glucose-6-phosphatase and of phosphoenolpyruvate carboxy kinase, 2 key enzymes of the gluconeogenesis.Citation13 The same pathway is hijacked by hepatitis C virus (HCV) through the upregulation of HDAC9.Citation14 Similarly in Drosophila the LKB-SIK3 axis controls HDAC4 nuclear accumulation in the fat body cells under the supervision of different dietary conditions.Citation15
In denervated muscles HDAC4 can repress glycolysis, probably through the repression of MEF2 TFs, and can sustain an oxidative program, favoring the switch from fast-glycolytic type II fibers to the slow-oxidative type I fibers.Citation16 This observation is in contrast with other reports, observing a correlation between class IIa HDACs nuclear export, MEF2-induced transcription and a fiber-switch from fast into the slow type.Citation17 Other studies indicate that HDAC4 is required for the up-regulation of glycolytic genes in response to hypoxia by controlling HIF1α stability.Citation18 In summary, several data indicate that class IIa HDACs are involved in the regulation of metabolic adaptations, however, the final outcome is not totally clarified and it seems to be context dependent.
Previously, we have shown that nuclear resident class IIa HDACs can transform murine NIH 3T3 fibroblasts, thus behaving as conceivable oncogenes. Growth in soft agar and tumor formation in immunocompromised mice can be elicited by HDAC4 mutated in the 14-3-3 binding sites, similarly to RAS oncogene.Citation19
Oncogenic transformation is coupled to metabolic adaptations aimed to sustain the uncontrolled proliferative state.Citation20 The RAS proteins are key switchers, acting as nodes of the growth factors signaling pathway and exhibit a potent transforming potential. RAS-induced transformation has been extensively investigated as a model of the metabolic adaptations during neoplastic growth.Citation21 RAS-transformed cells are marked by the upregulation of regulatory proteins of the glycolysis, including glucose transporters, thus recapitulating Warburg phenotype. Furthermore these cells present an impairment of the mitochondrial respiratory functions.Citation22-24 Importantly these metabolic adaptations are specifically coupled to the transformation-state, since RAS-induced senescence accompanies augmented fatty acid oxidation and higher rates of basal oxygen consumption.Citation25
In this work we have investigated whether, HDAC4-transformed cells exhibit specific metabolic adaptations and utilized, as a reference of transformation-dependent metabolic changes, cells expressing the H-RAS oncogene.
Results
HDAC4/TM-driven transformation does not affect lactate production in NIH 3T3 cells
NIH 3T3 cells expressing HDAC4/WT, its nuclear resident 14-3-3 binding defective mutant (S246A/S467A/S632A), hereafter referred to as triple mutant (HDAC4/TM), RAS (H-RAS/G12V mutation) and GFP as control, were used to investigate transformation-induced metabolic adaptations (). NIH 3T3 cells expressing the HDAC4/TM show a transformed phenotype, characterized by a robust growth in soft agar () and tumor formation in immunocompromised mice.Citation19 The oncogenic properties of HDAC4/TM cells are comparable to cells expressing the RAS oncogene. By contrast, the expression of HDAC4/WT failed to induce overt growth in soft-agar and the number of colonies was comparable to GFP expressing cells ().
Figure 1. Analysis of extracellular medium acidification. (A) Immunoblot assays were performed to visualize the different transgenes as expressed by NIH 3T3 cells. The antibodies used were anti-GFP to detect GFP and HDAC4-GFP, anti-H-RAS, and anti-Actin as a loading control. (B) Growth in soft agar of NIH-3T3 cells expressing the indicated transgenes. 1 × 10⁵ cells/plate were seeded and foci were MTT-stained 21 days later. n = 3; ± SD. (C) Representative soft-agar assay as performed in A). (D) Analysis of acidification in the extracellular medium. The different cell lines were grown for 8 days and the pH of the extracellular medium monitored at the indicated times. n = 3; ± SD. (E) Analysis of lactate concentration in the extracellular medium. The different cell lines were grown for 2 days and the concentration of lactate measured as described in material and methods and normalized for cell numbers. n = 4; ± SD. (F) Resazurin assay was performed as described in material and methods. The different cell lines were treated with the indicated concentration of oxamate for 48 h and the IC50 calculated. n = 7; ± SD. (G) Oxamate IC50 for each cell line calculated as described in Materials and Methods from experiments illustrated in F. *= p < 0.05; **= p < 0.01; ***= p < 0.001 t-test statistics.
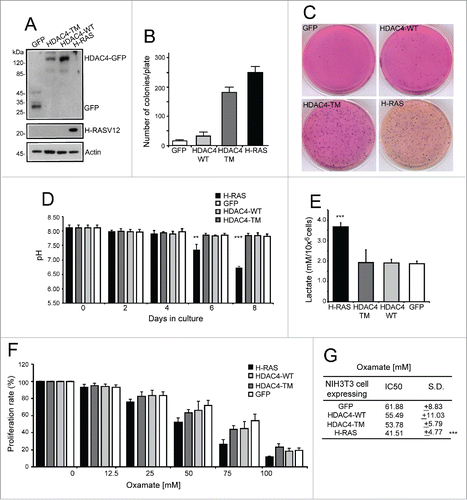
Interestingly, although dimensions and density of colonies in RAS and HDAC4/TM transformed cells were equivalent, the color of the medium used to fill the agar plates was profoundly different (). Only in RAS-transformed fibroblasts, acidification converted from red to yellow the phenol red indicator.
To support this qualitative data, pH measurements of extracellular media were performed in the different transgenic cell lines grown in 2D cultures. The cell growth rates were monitored every 2 days during 8 days and, in parallel, the pH of the culture medium was measured (). Although HDAC4/TM-expressing cells display a proliferative advantage with respect to HDAC4/WT or GFP-expressing cells,Citation19 extracellular acidification was equivalent to the control cell lines, with the pH of the medium remaining around 7.8. In contrast, in RAS-expressing cells extracellular acidification with a pH of 6.7 was evident. Importantly, this pH value is in accordance with previous in vivo studies.Citation26
This extracellular acidification could be a consequence of the increased glycolytic flux, a hallmark of the well-known Warburg phenotype induced by RAS oncogenes.Citation27 To further confirm this observation we analyzed the lactate concentration in the extracellular environment after 2 days of culture (). As expected, the lactate concentration in the medium of RAS-expressing cells was almost the double compared to all the other cell lines. By contrast, the HDAC4/TM transformed cells did not evidence augmented levels of lactate in the extracellular environment.
Lactate is produced from pyruvate by the lactate dehydrogenase (LDH) complex composed by 2 subunits (LDHA and LDHB). Oxamate is a pyruvate analog that acts as a competitive inhibitor of LDH with proved anti-proliferative effects against cancer cells.Citation28,29 Therefore, we examined the dose-dependent response to oxamate of our cell lines. The data reported in demonstrate that NIH 3T3 cells overexpressing RAS are significantly more vulnerable, in terms of growth inhibition, to oxamate treatment compared to all the other cell lines. RAS expressing cells exhibit an IC50 of 41.50 mM (± 4.77; p = 0.000023 vs GFP-expressing cells). By contrast, the IC50 of HDAC4/TM transformed cells for oxamate was 53.78 mM (±5.79 p = 0.089 vs GFP-expressing cells), which is not significantly different from the IC50 of the untransformed cells ().
In summary, these results demonstrate that HDAC4/TM-transformed fibroblasts do not evidence an increase in lactate secretion and suggest that these transformed cells are characterized by a metabolic profile that may divert from the standard features of the Warburg phenotype. In contrast, RAS-transformed cells augment lactate secretion in the extracellular environment, probably as the consequence of an increased glycolytic rate, thus confirming the Warburg effect elicited by this oncogene.
Glycolysis inhibition differentially impacts on HDAC4/TM and RAS-transformed cells
The difference in lactate production between RAS and HDAC4/TM transformed cells prompted us to test the response of these cell lines to glucose shortage. Cells were grown in presence of 2 different glucose concentrations: 25 mM (high glucose) or 5.56 mM (low glucose). To fuel mitochondrial oxidative phosphorylation L-glutamine (2 mM) and sodium pyruvate (1 mM) were added to the medium. As reported in , control cells did not suffer the glucose shortage in terms of cell proliferation, even after 72 h of culture. By contrast, RAS-transformed cells grown in low glucose exhibited a dramatic reduction in cell number, already evident at 48 h after the shift from high to low glucose condition. HDAC4/TM-expressing cells were more susceptible to glucose shortage with respect to GFP or HDAC4/WT-expressing cells, even though to a less extent compared to RAS-transformed cells. In fact, a difference in cell numbers between high and low glucose condition was substantial only after 72 h of glucose reduction. In all cell lines cell death was not overtly observed in low glucose conditions (), suggesting that glucose limitation, under the selected time interval, can arrest cell proliferation without robustly affecting cell viability.
Figure 2. Glycolysis inhibition differentially impacts HDAC4/TM and RAS-transformed cells. (A) Differential sensibility to glucose shortage of the 4 cell lines. 1 × 10⁵ cells/plate were seeded and after 24 h the cells were maintained in DMEM containing 25 mM glucose or shifted to DMEM containing 5,56 mM glucose for 72 h and counted every 24 h; n = 3 ± SD. (B) Analysis of cell death at the indicated times in the 4 cell lines. 1 × 10⁵ cells/plate were seeded and after 24 h the cells were maintained in DMEM containing 25 mM glucose or shifted to DMEM containing 5,56 mM glucose for 72 h. n = 3 ± SD. (C) Resazurin assay of the cell lines treated with different 2-DG concentrations for 48 h; n = 3 ± SD. (D) 2-DG IC50 for each cell line calculated as described in Materials and Methods. (E) Cell count after 48 h treatment with 2-DG at 5 mM (left) and 25 mM (right); n = 3 ± SD. (F) Intracellular ATP content of the 4 cell lines treated for 1 h with 2-DG 25 mM; n = 3 ± SD. *= p < 0.05; **= p < 0.01; ***= p < 0.001 t-test statistics.
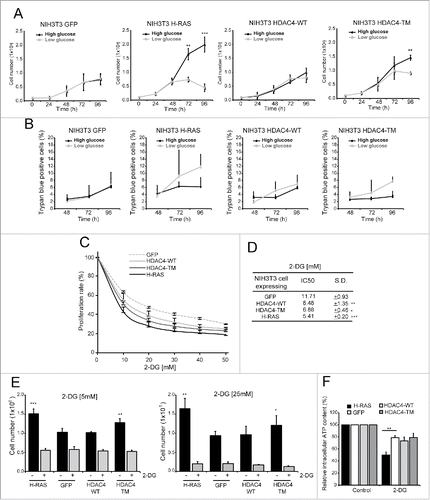
The results obtained in the glucose shortage experiments prompted us to further explore the relationships between glycolysis and proliferation of the different oncogene-transformed fibroblasts. To this end, we challenged our cell lines with several concentrations of 2-deoxy-glucose (2-DG), a commonly used inhibitor of glycolysis, which competitively inhibits glucose up-take, phospho-glucose-isomerase and non-competitively the hexokinase.Citation30 2-DG treatments inhibited cell growth in all cell lines in a dose-dependent manner, hence all cell lines depend on glycolysis for proliferation (). However, RAS-transformed cells display the highest susceptibility to glycolysis inhibition, with an IC50 of 5.41±0.20 mM (p = 0.0003 vs GFP-expressing NIH 3T3 cells). On the other side, GFP-expressing cells show the lowest sensibility to 2-DG (IC50 = 11.71±0.93) (). HDAC4/TM-expressing cells exhibit an intermediate phenotype (IC50 = 6.88±0.46, p = 0.0013 vs GFP-expressing cells and p = 0.007 vs RAS-expressing cells) respect to RAS and GFP expressing cells. To confirm these data, cells were treated for 48 h with 2 different concentrations of 2-DG, the first equimolar to the glucose concentration in the culture medium (25mM) and the second corresponding to the IC50 for RAS-transformed cells (5mM). Both concentrations abrogated the proliferative advantage conferred by oncogenic RAS- and HDAC4/TM (). Notably, in all the cell lines treatments for 48 h with 2-DG did not cause substantial cell death (data not shown). These experiments suggest that the increased cell proliferation observed in RAS- and HDAC4/TM-expressing fibroblasts is intimately linked to an augmented glucose flux through glycolysis. In fact, its inhibition results in the restoration of proliferative levels similar to those of non-tumorigenic cells.
Finally, we tested the impact of 2-DG treatment on intracellular ATP content. As depicted in , a short-term treatment (1 h) with 2-DG (25mM) caused a reduction in ATP levels in all the tested cell lines. However this decrease was much more pronounced in RAS-expressing cells. HDAC4/TM expressing cells decreased ATP level similarly to the control cell lines in response to 2-DG treatment. This result suggests that interfering with the glycolytic flux has a much stronger impact on RAS-transformed cells, which heavily rely on glycolysis for energy production and for their unrestrained proliferation.
HDAC4/TM and RAS differentially impact on mitochondrial respiration
In cancer cells the up-regulation of the glycolytic activity is not always concomitant to a down-regulation of mitochondrial oxidative phosphorylation.Citation31,32 On the other side, previous studies have documented that K-RAS expressing cells can impinge on glycolysis and exhibit defects in oxidative phosphorylation.Citation27,33
In order to compare the overall functionality of the mitochondrial OXPHOS in the 4 cell lines, we measured the mitochondrial oxygen consumption sustained by endogenous substrates in intact cells (). High-resolution respirometry analysis was performed to measure 3 different metabolic states namely: the basal routine respiration (R), the “proton-leak” respiration (L) observed after the inhibition of ATP synthase by oligomycin and representing the non-phosphorylating respiration, and the maximal stimulated respiration (E), observed after mitochondrial membrane potential collapse induced by titration with the protonophore FCCP. E values represent the actual activity of the electron transport system without control by the ATP synthesis system (ETS capacity).
Figure 3. HDAC4/TM overexpression does not alter mitochondrial metabolic functionality. (A) Oxygen consumption rates were measured in intact cells grown in complete medium with 25mM glucose. Metabolic states: basal routine respiration, R; non-phosphorylating respiration, L (measured in the presence of 2.5 µg/mL oligomycin); maximal respiration, E (measured in the presence of 3.3 µM FCCP). n = 4 ± SD *p < 0.05, **p < 0.01 and ***p < 0.005 compared with GFP-expressing cells. (B) The phosphorylating respiration R-L was calculated as the difference between the routine and the “proton leak” respiration. The normalized respiratory flux control ratios were calculated: R/E as the ratio between the routine and the maximal respiration, and (R-L)/E as the ratio between the phosphorylating and the maximal respiration. n = 4 ± SD. *p < 0.05 compared with GFP-expressing cells. (C) Relative mitochondrial DNA content quantified by RT-PCR. The DNA sequences coding for the NADH dehydrogenase subunit ND4 and for the ATP6 subunit of the ATP synthase were chosen as representative of mitochondrial DNA, whereas β2-microglobulin gene was used for genomic DNA normalization, n = 3 ± SD. (D) Mitochondrial membrane potential in intact cells, cultured in 25 mM glucose, measured by cytofluorimetric analysis after mitochondrial staining with 200 nM TMRM. Data are reported as mean fluorescence of stained population. n = 3 ± SD. (E) The different cells, cultured in 25 mM glucose and treated or not with oligomycin (2 µM) and rotenone (1 µM) as indicated, were in vivo stained with TMRM (200nM) and then analyzed by FACS. Data are reported as mean fluorescence of stained population. n =3 ± SD. (F) Relative electron transport system complex I activity biochemically determined as reported in the Materials and Methods section; n = 3 ± SD. (G) Representative immunoblot of complex I protein level. Densitometric analysis is also provided (n = 2 ± SD). *= p < 0.05; **= p < 0.01; ***= p < 0.001 t-test statistics. NS (non-statistically significant).
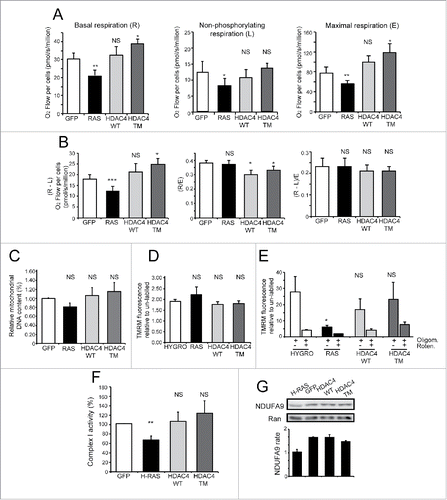
RAS-expressing cells displayed reduced basal respiration rate compared to GFP-expressing cells (−32%). HDAC4/WT-expressing cells did not differ from GFP control, whereas HDAC4/TM-expressing cells showed a higher basal respiration rate (+27%).
When we evaluated the oxygen consumption not coupled to ATP synthase (oligomycin-insensitive non-phosphorylating respiration), the value of RAS-expressing cells was also lower, whereas the other cell lines exhibited a similar behavior.
When mitochondria respiration was maximally stimulated by FCCP, the ETS capacity in RAS-transformed cells was the lowest, reflecting their low value of basal respiration and suggesting an ETS impairment. In contrast, HDAC4/TM cells consumed more oxygen than control cells in their maximal respiratory stimulation state, indicating a greater ETS capacity. The value of HDAC4/WT-expressing cells was higher, compared to GFP-expressing cells, but the difference was not statistically significant.
Next, from the values of the corresponding metabolic states we calculated the phosphorylating respiration (R-L) and the normalized respiratory flux control ratios R/E, and (R-L)/E. As reported in , we observed that the values of R-L were again lower in RAS-transformed cells and higher in HDAC4/TM cell line. Thus, in the latter, the greater activity of ETS under routine conditions resulted in greater respiration used to produce ATP, whereas “proton leak” respiration was unchanged.
Finally, by examining the normalized respiratory flux control ratios as measure of the rate of the basal or phosphorylating respiration related to the ETS capacity, we observed that the values (R-L)/E, denoting the fraction of the respiration used to produce ATP under routine conditions, were the same in the 4 cell lines. These results are in accordance with tumor-derived cell lines grown under high glucose conditions.Citation34 Conversely, the values of normalized routine flux control ratio (R/E) were significantly lower for HDAC4/WT and HDAC4/TM cell lines, with respect to GFP-expressing cells, suggesting more flexibility of respiration, different from RAS-transformed cells. Overall, these data highlight once again the marked metabolic differences existing between RAS and HDAC4/TM transformed cell lines.
These differences in respiration prompted us to compare the mitochondrial mass in the different cell lines. When mitochondrial DNA was quantified by RT-PCR, as a parameter to estimate the mitochondrial mass (), no significant changes were observed among the tested cell lines.
Only RAS-transformed cells are characterized by complex I reduced activity
In order to further characterize the mitochondrial functionality of the different cell lines we measured the mitochondrial membrane potential (Δψm) and evaluated the effects of the OXPHOS inhibitors oligomycin and rotenone. Oligomycin, by inhibiting the ATP synthesis and blocking the proton influx into the matrix, should enhance Δψm; whereas rotenone, by inhibiting complex I, should reduce electron transport flux, proton pumping and Δψm.
To this aim, we first generated new NIH 3T3 cell lines stably expressing flag-tagged HDAC4 proteins, to avoid interference of the GFP during the cytofluorimetric analysis. The effective expression of ectopic proteins was verified by western blot analysis and the proliferative advantage and the tumorigenic properties of the flag-tagged HDAC4/TM-expressing cells were confirmed (data not shown). Cytofluorimetric analysis, after TMRM staining, indicated that Δψm was similar among the different cell lines (). We then analyzed Δψm following a short-term treatment with the OXPHOS inhibitor oligomycin in the absence or presence of rotenone (). The results show that the oligomycin-mediated increase of Δψm was much lower in RAS-transformed cells (about 3 fold vs. more than 10 fold in controls and HDAC4/TM expressing cells). By contrast, rotenone efficiently suppressed the Δψm increase in all the different cell lines, as expected assuming a prevalent role of complex I in providing reducing equivalent to sustain the respiration. Together, these results suggest that the functionality of the ATP synthesis system, coupled with the electron transport chain and consuming Δψm, may be in general unperturbed, and that only in RAS-transformed cells a less active electron transport chain is operating upstream the ATP synthase, in accordance with the lower basal and phosphorylating respiration reported only in these cells (),
Since complex I is down-regulated in K-RAS transformed cells, we next evaluated complex I activity in our different transgenic cell lines.Citation35 Mitochondria-enriched fractions were obtained from each cell line and the complex I activity measured (). In RAS expressing cells, complex I activity was reduced (approximately 30% lower) compared to GFP expressing cells. HDAC4/TM and HDAC4/WT expressing cells did not exhibited significant differences compared to control. To strengthen this data, we also analyzed the expression levels of NDUFA9 complex I subunit. evidences that only in RAS-transformed cells NDUFA9 levels were downregulated compared to GFP-expressing cells.
Different regulation of metabolic genes in RAS and HDAC4/TM-transformed cells
To further substantiate the metabolic differences between RAS and HDAC4/TM transformed cells we compared the transcriptional profiles of NIH 3T3 cells transformed with HDAC4/TM and RAS (GSE29962).Citation19,24 The list of genes down- and upregulated in NIH 3T3 cells expressing HDAC4/TM is shown in the supplementary table S1. Initially, we interrogated 5 curated MSigDB (H) genesets, representing a collection of genes encoding for proteins involved in common metabolic processes with the HDAC4/TM and RAS signatures. As expected, the glycolytic pathway was significantly enriched in RAS transformed cells, whereas, HDAC4 transformed cells are characterized by a significant repression of genes involved in cholesterol and fatty acid metabolism (). When the analysis was extended to all the 67 genesets available on MSigDB, similar results were obtained. In RAS-transformed cells, signatures of genes involved in glycolysis and in glutamine and purine metabolism were significantly up-regulated. In HDAC4/TM transformed cells these pathways were largely unmodified and, instead, only genes involved in lipid metabolism turned out to be significantly repressed ().
Table 1. Enrichment Scores (ES) obtained through a GSEA analysis. Two comparisons were made: GFP vs HDAC4/TM and HYGRO vs RAS. ns means not significant ES, with a p > 0.05.
Table 2. The number of MSigDB genesets that for each category (rows) are significantly enriched in one of the 4 classes, analyzed as in .
To further corroborate these observations, we created genesets comprising selected enzymes of glycolysis (n = 39), TCA cycle (n = 17), mitochondrial respiration and oxidative phosphorylation (n = 92), fatty acid β-oxidation and lipolysis (n = 33). When the whole genesets were analyzed, differences in the expression levels between RAS and HDAC4/TM transformed cells were not appreciated (). We therefore hypothesized that the metabolic distinctiveness described above could arise from a dissimilar regulation of few key metabolic genes. To confirm this hypothesis, we repeated the analysis on subsets of genes, the so-called leading edge for 2 categories, “glycolysis” and “lipid metabolism.”Citation36 The leading edge of glycolysis represents the core of genes that are always enriched in RAS over-expressing cells in all the MSigDB datasets investigated. The leading edge of the category “lipid metabolism” is a collection of 17 genes that codify for proteins involved in the catabolism and anabolism of lipids and are commonly repressed in HDAC4/TM expressing cells. These two signatures represent the minimal transcriptional hallmark to define the metabolic alterations induced respectively by RAS and HDAC4/TM.
Figure 4. Transcriptional reprogramming correlates with metabolic adaptations. (A) Boxplots illustrating the mRNA levels of 39 genes involved in glycolysis, 17 in TCA cycle, 92 in mitochondrial respiration and oxidative phosphorylation and 33 in fatty acid β-oxidation and lipolysis in RAS and HDAC4/TM expressing cells. In each case the levels are expressed as fold relative to control. (B) Boxplots illustrating the mRNA levels in RAS and HDAC4/TM expressing cells of the genes that define 3 categories: leading edge (L.E.) lipid metabolism; L.E. glycolysis; L.E. MEF2-targets, defined after a leading edge analysis as explained in the text and in material and methods. *p < 0.05, **p < 0.01, Mann-Whitney test of significance.
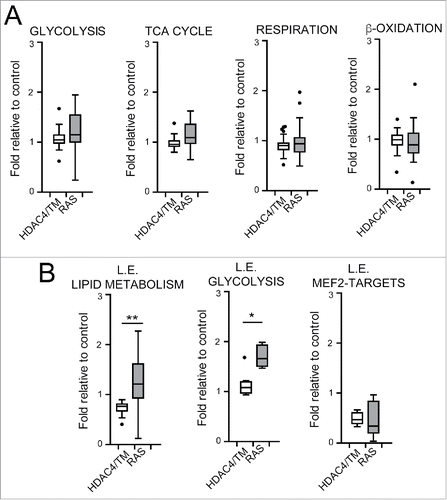
Interestingly, our analysis confirms that these 2 signatures could discriminate successfully between RAS and HDAC4/TM overexpressing cells (). As a control, we also verified that MEF2-targets were repressed in both HDAC4 and RAS-expressing cells as previously reported.Citation7,19 This means that, while both HDAC4/TM and RAS require the repression of a common core of MEF2 target genes in order to transform murine fibroblasts, they activate distinct metabolic programmes that imply the activation of glycolysis by RAS and the subversion of the utilization of lipids in HDAC4/TM expressing cells.
HDAC4 influences the expression of genes involved in lipid metabolism in murine fibroblasts and in breast cancer cells
We verified by qRT-PCR analysis the upregulation of genes encoding for elements of the glycolytic pathway in HDAC4/TM and RAS expressing NIH 3T3 cells. We selected 6 genes: LdhA Pgk1, Tpi1, Pkm2, Eno2 and Hk2 for this analysis. shows that, with the exclusion of LdhA, the expression of these genes involved in glucose metabolism was clearly augmented in RAS-transformed cells and much less upregulated in HDAC4/TM cells.
Figure 5. Differential expression of metabolic genes in RAS and HDAC4/TM transformed cells. (A) The mRNA expression levels for 6 selected genes of the glycolysis (Pgk1,Tpi1, LdhA, Pkm2, Eno2, Hk2) were measured in NIH 3T3 expressing the different transgenes, using qRT-PCR. (B) The mRNA expression levels for 3 selected MEF2-target genes (Klf2, Klf4, RhoB) were measured in NIH 3T3 expressing the different transgenes, using qRT-PCR. (C) The mRNA expression levels for 3 selected genes of the lipid metabolism category (Nsdhl, Gla, Cln3, Cpt1a) were measured in NIH 3T3 expressing the different transgenes, using qRT-PCR. (D) MCF7 cells co-transfected with siRNAs against HDAC4, and HDAC9 or with the same amount of a control siRNA were lysed, and mRNAs were extracted. Fold induction was calculated as the ratio relative to control siRNA-transfected cells.
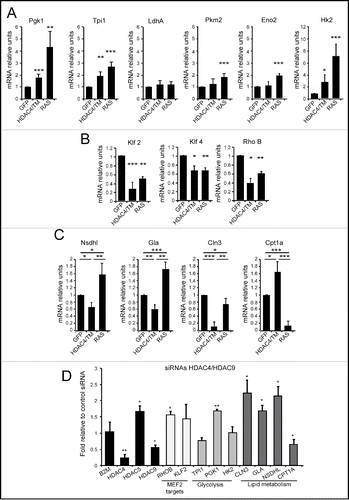
By contrast, qRT-PCR experiments confirmed that repression of the MEF2 target genes, Klf2, Klf4 and RhoB occurs in both HDAC4/TM and RAS-expressing cells (). Next, we selected 4 genes involved in lipid metabolism (Nsdhl, Gla, Cln3 and Cpt1a) to verify their mRNA levels, in HDAC4/TM and RAS expressing cells. Nsdhl, Gla and Cln3 were repressed in HDAC4/TM cells (). On the opposite Nsdhl and Gla were up-regulated in RAS-transformed cells or, in the case of Cln3, slightly repressed. Importantly Cpt1a, a key regulatory enzyme of β-oxidation, showed an opposite behavior. It was up regulated in HDAC4/TM-transformed cells and strongly repressed in the presence of RAS.
Finally, to confirm the importance of HDAC4 in the regulation of the described metabolic adaptations, we evaluated in breast cancer cells the influence of class IIa HDACs on the expression of these metabolic genes. Because of redundancy and compensatory mechanisms, the simultaneous downregulation of 2 class IIa HDACs is necessary to up-regulate MEF2-dependent transcription in MCF7 cells.Citation37 Hence, we simultaneously silenced HDAC4 and HDAC9 expression using specific siRNAs. qRT-PCR analysis shows that the expression of 3 glycolytic genes, highly upregulated by RAS in NIH 3T3 cells, was independent from class IIa HDACs levels (). Indeed, PGK1 expression was slightly repressed by class IIa HDACs. By contrast, the expression of 3 genes involved in lipid metabolism (NSDHL, GLA and CLN3), repressed by HDAC4/TM in NIH 3T3 cells, was up-regulated upon silencing of HDAC4 and HDAC9 in human breast cancer cells. An evolutionary conserved regulation was confirmed also for CPT1A, which is upregulated by HDAC4/TM in mouse fibroblasts and down-regulated, to some extent in human breast cancer cells, after HDAC4/HDAC9 silencing.
Discussion
Oncogenes elicit a profound reorganization of cell behavior, aiming to sustain an uncontrolled proliferation. Reprogramming of metabolism is a hallmark of the oncogene-induced transformation.Citation20,38-41 In tumors this oncogene-reprogramming can also influence the metabolism of the host microenvironment.Citation42 Warburg's pioneering studies have discovered in the glycolytic phenotype under aerobic conditions a dominant marker of neoplastic cells.Citation43 This metabolic shift is frequently coupled to the presence of dysfunctional mitochondria, which exhibit diminished OXPHOS capacity.Citation43
In models of transformation, the oncogene Ras is a prototype of such metabolic reprogramming.Citation23,24,44 RAS-transformed cells show a high glycolytic rate, decreased oxidative flux through the TCA cycle, reduction of mitochondrial complex I activity and increased utilization of glutamine for anabolic synthesis.Citation27,35,44-46
Here, we have confirmed the dominant aerobic glycolytic phenotype, the reduced oxygen consumption and the defect in complex I activity of H-RAS transformed cells. Glycolysis is strictly required for sustaining the ATP levels and the robust proliferation of RAS-transformed cells. The strong dependence of RAS-transformed cells from glycolysis reflects the activation of a specific genetic program. Gene expression profile analysis has identified the mRNA signature “regulators of glycolysis” as a marker of RAS-transformed cells. The up-regulation of phosphoglycerate kinase 1 (Pgk1), triosephosphate isomerase 1 (Tpi1), pyruvate kinase M2 (Pkm2) enolase/phosphopyruvate hydratase 2 (Eno2) and of hexokinase 2 (Hk2) was verified in our RAS-transformed cells.
In particular, Pgk1 was strongly up-regulated by RAS. PGK1 converts 1,3-bisphosphoglycerate into 3-phosphoglycerate. It represents the first ATP-yielding step of glycolysis and is essential for energy generation by the glycolytic pathway. PGK1 plays a key role in coordinating glycolytic energy production with one-carbon metabolism, serine biosynthesis, and cellular redox regulation.Citation47 Interestingly, PGK1 is a hypoxic gene under the regulation of HIF-1α, which expression is frequently deregulated in cancer.Citation48 Whether HIF-1α is involved in RAS-dependent regulation deserves further investigations.
Reduction of glucose concentration in the medium, treatment with 2-DG or with the LDH inhibitor oxamate can also impact proliferation of non-transformed cells. Hence, although not-transformed cells do not augment glycolytic enzymes and lactate production, they depend on glycolysis for an efficient growth in culture. This glycolysis-dependence of normal cells can also be appreciated in other studies.Citation22,23,49
Surprisingly, HDAC4/TM-transformed cells do not exhibit the dominant glycolytic phenotype. Although they multiply in soft agar and form tumors in nude mice, lactate secretion is not augmented and they exhibit a reduced glucose-dependence compared to RAS. A reduction mirrored by a less aggressive growth in culture. The reduced glycolytic flux of HDAC4/TM cells could not allow an adequate amount of glucose-6-phosphate for production of the ribose-5-phosphate in the pentose phosphate pathway and the downstream nucleotide synthesis, thus explaining the reduced accelerated proliferation in comparison with RAS-transformed cells.Citation50 The absence of an overt/full glycolytic reprogramming in HDAC4/TM transformed cells was also confirmed at transcriptional level.
By contrast, the “lipid metabolism” signature characterizes cells transformed by HDAC4/TM. Interestingly, a correlation between HDAC4 and lipid metabolism was observed also in Drosophila where HDAC4 can be consider a lipolytic factor.Citation15 The glycolytic and the lipid metabolism signatures successfully discriminate between RAS- and HDAC4/TM-transformed cells. As a control, we also verified that MEF2-target genes were repressed in both HDAC4/TM- and RAS-expressing cells as previously reported.Citation7,19 These results denote that, while both HDAC4 and RAS promote the repression of a common core of MEF2 target genes, they activate different metabolic programmes.
An important parameter distinguishing HDAC4/TM cells from RAS and the control cell lines is the increased oxygen consumption. This increase can be observed both as basal respiration and ETS capacity, but not as “proton-leak” respiration. Thus, the respiration used to produce ATP appears also greater, in line with a good coupling between ATP synthesis and electron transport chain. Intriguingly, the values of normalized routine flux control ratio for both HDAC4-expressing cell lines are significantly lower than GFP, suggesting a better capability of adapting to conditions of larger request of mitochondrial ATP flux by respiration, especially in the case of HDAC4/TM cells exhibiting greater ETS capacity. Of note, the different respiratory phenotypes are coupled to the opposite effect of HDAC4/TM and RAS on the expression of carnitine palmitoyl transferase 1A (CPT1A), the key enzyme in the transport of long-chain fatty acids for β-oxidation into mitochondria. This result confirms once more, the profound divergent metabolic adaptations triggered by the 2 genes.
Increased oxygen consumption was recently discovered as a distinct feature of a small subpopulation of quiescent/slow proliferating tumor cells responsible for tumor relapse in a mouse model of pancreatic cancer.Citation51 The existence of heterogeneous metabolic adaptations of the neoplastic cells is emerging in several cancers.Citation52 Dependence on OXPHOS for sustaining an aggressive phenotype was observed in different studies.Citation53,54 Importantly, OXPHOS activity seems to be critical in circulating tumor cells during the metastatic process.Citation55 Multistep in vitro transformation studies have indicated an increase in mitochondria biogenesis as cells progress toward greater tumorigenic potential and only after the introduction of H-RAS a decline in mitochondria can be observed.Citation22
In conclusion, our in vitro studies have confirmed that oncogenic transformation can be accomplished through different metabolic adaptations. In particular, HDAC4/TM cells can represent an interesting model to investigate cell transformation in the absence of an overt Warburg effect.
Materials and methods
Cell culture, soft agar assay, siRNA transfection and reagents
NIH 3T3 cells were routinely grown in high glucose (4.5 g/L) DMEM (Lonza). Polyclonal NIH 3T3 cells expressing H-RAS, GFP and the different version of HDAC4 fused by GFP were previously described and characterized.Citation19 For the lactate quantification experiments, the DMEM without phenol red was purchased from Lonza. For the cell proliferation experiments with low glucose concentration (1g/L), the DMEM low glucose from Sigma-Aldrich was used. All culture media were provided with 1mM sodium pyruvate and supplemented with 10%FBS, 2mM L-glutamine, 100U/mL penicillin and 100μg/mL streptomycin (Lonza). For soft agar assays, equal volumes of 1.2% agar and DMEM were mixed to generate 0.6% base agar. A total of 1 × 10Citation5 cells were seeded in 0.3% top agar, followed by incubation at 37°C in humidified conditions. The cells were grown for 21 days, and visualized by MTT staining. Cells were transfected 24 h after plating by adding the OptiMem medium containing Lipofectamine plus the stealth RNAi oligos (Invitrogen, Carlsbad, CA, USA). Cells were collected after 48 h from transfection.Citation37 The following reagents were used: 2-deoxy-D-glucose (2-DG) sodium oxamate, oligomycin A, resazurin, MTT, rotenone, FCCP, antimycin A, NADH, sodium azide, decylubiquinone from (Sigma-Aldrich) and TMRM (Molecular Probes).
Statistics
For experimental data, a Student t test was used. A P value of 0.05 was chosen as the statistical limit of significance. Unless otherwise indicated, data in the figures are arithmetic means and standard deviations from at least 3 independent experiments.
Respirometry analysis
High-resolution respirometry analysis was performed in intact cells [1 × 10⁶/ml] in complete medium with [25 mM] glucose into the polarographic chamber of a high-resolution respirometer Oxygraph 2 k (Oroboros instruments, Innsbruck, Austria). Oxygen consumption in basal condition (routine respiration/R) was recorded after the flow equilibrium was reached. Oligomycin [2.5 µg/mL] was added to measure the proton-leak respiration (L). A titration with the protonophore FCCP was performed to evaluate the maximal uncoupler-stimulated respiratory activity (E) that was reached at 3.3 µM FCCP. Non-mitochondrial oxygen consumption was obtained by adding rotenone [1 µM] and antimycin A [2.5 µM] and this value was subtracted from all the previous measurements to assess the mitochondrial-specific respiration. Data were digitally recorded using DatLab4 software; oxygen flux was calculated as the negative time derivative of the oxygen concentration. A standard correction was performed for instrumental background oxygen flux arising from oxygen consumption of the oxygen sensor and minimal back-diffusion into the chamber.
Nuclei acids extraction and quantitative RT-PCR
For RNA extraction cells were lysed using RiboEx (GeneAll Biotechnology Co., LTD). 1µg of total RNA was retro-transcribed by using 100 units of M-MLV reverse transcriptase (Life Technologies). Total (genomic plus mitochondrial) DNA was extracted from 3×10⁶ cells using DNeasy Blood and Tissue kit (Qiagen). PCRs were performed using the Bio-Rad CFX96 apparatus and SYBR Green technology (Kapa). For qRT-PCRs Gapdh, Hprt or β2-microglobulin were used as normalizer genes. All reactions were done in triplicate. The sequences of used primers are available upon request.
Plasmid construction, transfection and retroviral infection
The retroviral pWZL-Hygro-flag plasmid was obtained by PCR and subsequent EcoRI-SalI/XhoI subcloning of the flag sequence with the entire MCS from pFlag5c plasmid into retroviral pWZL-Hygro construct. The cDNA encoding for human wild-type or triple mutant HDAC4 were cloned into pWZL-Hygro-flag by EcoRI restriction. The correct orientation and sequence of the insert was verified. Cells expressing the different transgenes were generated by retroviral infections as previously described.Citation19 Briefly, retroviral vectors carrying these transgenes or empty vectors expressing only the Hygro resistance gene were used to singularly transfect the ecotropic packaging cell line LinX-E. Transfection was performed by calcium phosphate method. At 60 hours post-transfection, viral supernatants were collected, filtered, supplemented with 8μg/mL polybrene, and combined with fresh medium in order to infect NIH 3T3 murine fibroblasts.
pH measurement, intracellular ATP and extracellular lactate quantification
A total of 1.5 × 10⁴ cells were seeded in Petri dishes and counted every 2 days. In parallel, the supernatant medium was collected and its pH immediately measured by mean of a pH meter. For ATP quantification, 1 × 10⁴ cells/well were seeded in 96 well microtiter and grown for 36 hours. Cells were then treated with 25 mM 2-DG or 2 μM oligomycin for 1 hour at 37°C in humidified conditions. The intracellular ATP content was determined using ATP-Lite kit (Perkin-Elmer) following manufacturer's instruction. For lactate quantification, 1 × 10⁵cells were seeded in 12-well plate. After 24 hours, the culture medium was substituted with complete medium without phenol red and, after other 24 hours, the lactate amount in supernatant media was quantified using lactate colorimetric/fluorometric assay kit (BioVision), following manufacturer's instructions.
Resazurin assay and IC50 calculation
A total of 5 × 10⁴ cells/well were seeded in 48-well plate and, after 24 hours, the cells were treated with increasing doses of sodium oxamate (0; 12.5; 25; 50; 75 and 100 mM) or 2-DG (0; 1; 2.5; 5; 10; 20; 30; 40 and 50 mM). After 48 hours treatment, the culture media were substituted with complete media containing 10 uM resazurin and the cells were incubated for 95 minutes at 37°C in humidified conditions. The resazurin fluorescence was measured using EnSpire multimode plate reader (Perkin-Elmer). The relative fluorescence values were interpolated with a linear regression to calculate the IC50 of oxamate and 2-DG using GraphPad Prism software.
Mitochondrial membrane potential (Δψm) quantification
Collected cells were incubated in phosphate buffer containing 200 nM TMRM and 200 nM cyclosporine A, for 30 minutes at 37°C in humidified conditions. Δψm was analyzed by a FACScan flow cytometer (Becton Dickinson) equipped with a single 488 nm argon laser and data were acquired on a logarithmic scale using Cell Quest software.
Complex I activity measurement
Mitochondria-enriched fractions were obtained from the cell lines as follows: 8 × 10⁶ cells were re-suspended in mitochondrial isolation buffer [250 mM sucrose, 1 mg/mL BSA, 2 mM EDTA, protease inhibitors cocktail (Sigma cat n. P8340), pH 7.4] and sonicated at ice-cold temperature. The resultant homogenates were subjected to differential centrifugations: 800 xg and 16000 xg for 20 minutes at 4°C. The final pellets (i.e. crude mitochondria fractions) were re-suspended in 100 μL of hypotonic buffer containing 25 mM K2PO4 and 5 mM MgCl2, pH 7.2, freezed-and-thawed 2 times to disrupt mitochondrial membranes and immediately used for enzymatic analysis. Complex I activity measurements were performed as previously reported.Citation56 Briefly, 10 μg of mitochondria were suspended in 200 μL of water containing 150 μM NADH, 2.5 μM antimycin A and 4 mM sodium azide with or without 1 μM rotenone. Reactions was started by adding 50 μL of 50 mM Tris-HCl, pH 8.0, containing 80 μM decylubiquinone and the decrease in absorbance at 340 nm, due to the oxidation of NADH, was monitored for 5 minutes. The complex I activity was calculated as rotenone-sensitive activity.
Immunoblot analysis
Immunoblot analysis were performed as previously described.Citation8 The primary antibodies were: anti-actin and anti-FLAG (SIGMA), anti-NDUFA9 sub-unit of complex I and anti-RasV12 (Abcam), anti-RAN (Cell Signaling). The HRP-conjugated secondary antibodies (Sigma-Aldrich) and the Super Signal West Dura substrate (Pierce) were used to visualize the immunocomplexes.
Bioinformatics analysis
The transcriptional profiles of RAS and HDAC4/TM expressing cells were obtained respectively from GEO (GSE29962) and Di Giorgio.Citation19,24 Data were Log2 transformed, median centered and expressed as fold relative to control cells. Gene set enrichment analysis (GSEA) was used in order to identify the metabolic pathways perturbed in RAS and HDAC4/TM expressing cells.Citation36 Five metabolic curated MSigDB genesets defined “hallmarks” were used. Next the analysis was expanded on all the 67 metabolic genesets available on MSigDB. For the analysis, the maximum value of each probe was chosen. The ranking was done according to a signal-to-noise metric, and 1,000 permutations were used to generate the null distribution. The enrichment scores (ES) were defined as significant for values of p < 0.05 and FDR < 0.25.
The expression levels of the key genes involved in glycolysis, TCA cycle, OXPHOS and fatty acid β oxidation in NIH 3T3 RAS and HDAC4/TM cells were calculated and expressed as fold relative to control. Then, a leading edge subset was created for the categories of “lipid metabolism” and “glycolysis,” defined as the core genes commonly de-regulated respectively in HDAC4/TM and RAS expressing cells. A signature of MEF2 target genes, defined as the 10 MEF2 target genes more strongly repressed by HDAC4 and upregulated after HDAC4 silencing was used as a positive control.Citation19 The leading edge analysis was done according to Subramanian.Citation36
Leading edge LIPID METABOLISM: Adm, Aldh3a1, Aldh5a1, Cln3, Dpm2, Gla, Glyat, Hacl1, Mif, Nsdhl, Pdss1, Pigc, Pparg, Prdx6, Sptlc1, St6galnac6, Ugcg.
Leading edge GLYCOLYSIS: Eno2, Hk2, Tpi1, Pgam1, Aldh9a1, Ldha, Pgk1, Pkm2.
Leading edge MEF2: Anxa8, Klf2, Edn1, Klf4, Dhrs3, Irs1, Rhob, Cdkn1a, Ampd3, Nr4a2.
Abbreviations
| 2-DG | = | 2-deoxy-glucose |
| FCCP | = | carbonyl cyanide p-trifuoromethoxy-phenylhydrazone |
| DMEM | = | Dulbecco modified Eagle medium |
| FBS | = | fetal bovine serum |
| LDH | = | lactate dehydrogenase |
| Δψm | = | mitochondrial membrane potential |
| MTT | = | [3-(4,5-dimethyl-2-thiazolyl)-2,5-diphenyl-2H-tetrazolium bromide] |
| TMRM | = | tetramethylrhodamine methyl ester perchlorate |
| TCA | = | tricarboxylic acid |
Disclosure of potential conflicts of interest
No potential conflicts of interest were disclosed.
Supplemental Files
Download MS Excel (48.7 KB)Funding
This work was supported by AIRC (Associazione Italiana per la Ricerca sul Cancro) IG 15640 and PRIN (Progetto 2010W4J4RM_002) to CB. E.D.G. received the Alberta Baruchello e Maurizio Scalabrin fellowship from AIRC.
Related Research Data
References
- Parra M. Class IIa HDACs - new insights into their functions in physiology and pathology. FEBS J 2015; 282:1736-44; PMID:25244360; http://dx.doi.org/10.1111/febs.13061
- Di Giorgio E, Brancolini C. Regulation of class IIa HDAC activities: it is not only matter of subcellular localization. Epigenomics 2016; 8(2):51-69; http://dx.doi.org/10.2217/epi.15.106
- Clocchiatti A, Florean C, Brancolini C. Class IIa HDACs: from important roles in differentiation to possible implications in tumourigenesis. J Cell Mol Med 2011; 15:1833-46; PMID:21435179; http://dx.doi.org/10.1111/j.1582-4934.2011.01321.x
- Martin M, Kettmann R, Dequiedt F. Class IIa histone deacetylases: conducting development and differentiation. Int J Dev Biol 2009; 53:291-301; PMID:19412888; http://dx.doi.org/10.1387/ijdb.082698mm
- Cernotta N, Clocchiatti A, Florean C, Brancolini C. Ubiquitin-dependent degradation of HDAC4, a new regulator of random cell motility. Mol Biol Cell 2011; 22:278-89; PMID:21118993; http://dx.doi.org/10.1091/mbc.E10-07-0616
- Ishikawa F, Miyoshi H, Nose K, Shibanuma M. Transcriptional induction of MMP-10 by TGF-beta, mediated by activation of MEF2A and downregulation of class IIa HDACs. Oncogene 2010; 29:909-19; PMID:19935709; http://dx.doi.org/10.1038/onc.2009.387
- Di Giorgio E, Gagliostro E, Clocchiatti A, Brancolini C. The control operated by the cell cycle machinery on MEF2 stability contributes to the downregulation of CDKN1A and entry into S phase. Mol Cell Biol 2015; 35:1633-47; PMID:25733682; http://dx.doi.org/10.1128/MCB.01461-14
- Paroni G, Mizzau M, Henderson C, Del Sal G, Schneider C, Brancolini C. Caspase-dependent regulation of histone deacetylase 4 nuclear-cytoplasmic shuttling promotes apoptosis. Mol Biol Cell 2004; 15:2804-18; PMID:15075374; http://dx.doi.org/10.1091/mbc.E03-08-0624
- McGee SL, van Denderen BJ, Howlett KF, Mollica J, Schertzer JD, Kemp BE, Hargreaves M. Diabetes. AMP-activated protein kinase regulates GLUT4 transcription by phosphorylating histone deacetylase 5. 2008; 57:860-7; PMID:18184930
- Wang B, Liu TY, Lai CH, Rao YH, Choi MC, Chi JT, Dai JW, Rathmell JC, Yao TP. Glycolysis-dependent histone deacetylase 4 degradation regulates inflammatory cytokine production. Mol Biol Cell 2014; 25:3300-7; PMID:25187650; http://dx.doi.org/10.1091/mbc.E13-12-0757
- Wang B, Moya N, Niessen S, Hoover H, Mihaylova MM, Shaw RJ, Yates JR 3rd, Fischer WH, Thomas JB, Montminy M. A hormone-dependent module regulating energy balance. Cell 2011; 145:596-606; PMID:21565616; http://dx.doi.org/10.1016/j.cell.2011.04.013
- Henriksson E, Säll J, Gormand A, Wasserstrom S, Morrice NA, Fritzen AM, Foretz M, Campbell DG, Sakamoto K, Ekelund M, Degerman E, Stenkula KG, Göransson O. SIK2 regulates CRTCs, HDAC4 and glucose uptake in adipocytes. J Cell Sci 2015; 128:472-86; PMID:25472719; http://dx.doi.org/10.1242/jcs.153932
- Mihaylova MM, Vasquez DS, Ravnskjaer K, Denechaud PD, Yu RT, Alvarez JG, Downes M, Evans RM, Montminy M, Shaw RJ. Class IIa histone deacetylases are hormone-activated regulators of FOXO and mammalian glucose homeostasis. Cell 2011; 145:607-21; PMID:21565617; http://dx.doi.org/10.1016/j.cell.2011.03.043
- Chen J, Wang N, Dong M, Guo M, Zhao Y, Zhuo Z, Zhang C, Chi X, Pan Y, Jiang J, et al. The Metabolic Regulator Histone Deacetylase 9 Contributes to Glucose Homeostasis Abnormality Induced by Hepatitis C Virus Infection. Diabetes 2015; 64:4088-98; PMID:26420860; http://dx.doi.org/10.2337/db15-0197
- Choi S, Lim DS, Chung J. Feeding and Fasting Signals Converge on the LKB1-SIK3 Pathway to Regulate Lipid Metabolism in Drosophila. PLoS Genet 2015; 11:e1005263; PMID:25996931; http://dx.doi.org/10.1371/journal.pgen.1005263
- Tang H, Macpherson P, Marvin M, Meadows E, Klein WH, Yang XJ, Goldman D. A histone deacetylase 4/myogenin positive feedback loop coordinates denervation-dependent gene induction and suppression. Mol Biol Cell 2009; 20:1120-31; PMID:19109424; http://dx.doi.org/10.1091/mbc.E08-07-0759
- Potthoff MJ, Wu H, Arnold MA, Shelton JM, Backs J, McAnally J, Richardson JA, Bassel-Duby R, Olson EN. Histone deacetylase degradation and MEF2 activation promote the formation of slow-twitch myofibers. J Clin Invest 2007; 117:2459-67; PMID:17786239; http://dx.doi.org/10.1172/JCI31960
- Geng H, Harvey CT, Pittsenbarger J, Liu Q, Beer TM, Xue C, Qian DZ. HDAC4 protein regulates HIF1α protein lysine acetylation and cancer cell response to hypoxia. J Biol Chem 2011; 286:38095-102; PMID:21917920; http://dx.doi.org/10.1074/jbc.M111.257055
- Di Giorgio E, Clocchiatti A, Piccinin S, Sgorbissa A, Viviani G, Peruzzo P, Romeo S, Rossi S, Dei Tos AP, Maestro R, Brancolini C. MEF2 is a converging hub for histone deacetylase 4 and phosphatidylinositol 3-kinase/Akt-induced transformation. Mol Cell Biol 2013; 33:4473-91; PMID:24043307; http://dx.doi.org/10.1128/MCB.01050-13
- Hanahan D, Weinberg RA. Hallmarks of cancer: the next generation. Cell 2011; 144:646-74; PMID:21376230; http://dx.doi.org/10.1016/j.cell.2011.02.013
- Kimmelman AC. Metabolic Dependencies in RAS-Driven Cancers. Clin Cancer Res 2015; 21:1828-34; PMID:25878364; http://dx.doi.org/10.1158/1078-0432.CCR-14-2425
- Ramanathan A, Wang C, Schreiber SL. Perturbational profiling of a cell-line model of tumorigenesis by using metabolic measurements. Proc Natl Acad Sci U S A 2005; 102:5992-7; PMID:15840712; http://dx.doi.org/10.1073/pnas.0502267102
- Yang D, Wang MT, Tang Y, Chen Y, Jiang H, Jones TT, Rao K, Brewer GJ, Singh KK, Nie D. Impairment of mitochondrial respiration in mouse fibroblasts by oncogenic H-RAS(Q61L). Cancer Biol Ther 2010; 9:122-33; PMID:19923925; http://dx.doi.org/10.4161/cbt.9.2.10379
- Gaglio D, Metallo CM, Gameiro PA, Hiller K, Danna LS, Balestrieri C, Alberghina L, Stephanopoulos G, Chiaradonna F. Oncogenic K-Ras decouples glucose and glutamine metabolism to support cancer cell growth. Mol Syst Biol 2011; 7:523; PMID:21847114; http://dx.doi.org/10.1038/msb.2011.56
- Quijano C, Cao L, Fergusson MM, Romero H, Liu J, Gutkind S, Rovira II, Mohney RP, Karoly ED, Finkel T. Oncogene-induced senescence results in marked metabolic and bioenergetic alterations. Cell Cycle 2012; 11:1383-92; PMID:22421146; http://dx.doi.org/10.4161/cc.19800
- Newell K, Franchi A, Pouysségur J, Tannock I. Studies with glycolysis-deficient cells suggest that production of lactic acid is not the only cause of tumor acidity. Proc Natl Acad Sci U S A 1993; 90:1127-31; PMID:8430084; http://dx.doi.org/10.1073/pnas.90.3.1127
- Hu Y, Lu W, Chen G, Wang P, Chen Z, Zhou Y, Ogasawara M, Trachootham D, Feng L, Pelicano H, Chiao PJ, Keating MJ, Garcia-Manero G, Huang P. K-ras(G12V) transformation leads to mitochondrial dysfunction and a metabolic switch from oxidative phosphorylation to glycolysis. Cell Res 2012; 22:399-412; PMID:21876558; http://dx.doi.org/10.1038/cr.2011.145
- Goldberg EB, Colowick SP. The role of glycolysis in the growth of tumor cells. 3. lactic dehydrogenase as the site of action of oxamate on the growth of cultured cells. J Biol Chem 1965; 240:2786-90; PMID:14342295
- Xie H, Valera VA, Merino MJ, Amato AM, Signoretti S, Linehan WM, Sukhatme VP, Seth P. LDH-A inhibition, a therapeutic strategy for treatment of hereditary leiomyomatosis and renal cell cancer. Mol Cancer Ther 2009; 8:626-35; PMID:19276158; http://dx.doi.org/10.1158/1535-7163.MCT-08-1049
- Zhang D, Li J, Wang F, Hu J, Wang S, Sun Y. 2-Deoxy-D-glucose targeting of glucose metabolism in cancer cells as a potential therapy. Cancer Lett 2014; 355:176-83; PMID:25218591; http://dx.doi.org/10.1016/j.canlet.2014.09.003
- Moreno-Sánchez R, Rodríguez-Enríquez S, Marín-Hernández A, Saavedra E. Energy metabolism in tumor cells. FEBS J 2007; 274:1393-418; PMID:Can't; http://dx.doi.org/10.1111/j.1742-4658.2007.05686.x
- Ward PS, Thompson CB. Metabolic reprogramming: a cancer hallmark even warburg did not anticipate. Cancer Cell 2012; 21:297-308; PMID:22439925; http://dx.doi.org/10.1016/j.ccr.2012.02.014
- Chiaradonna F, Gaglio D, Vanoni M, Alberghina L. Expression of transforming K-Ras oncogene affects mitochondrial function and morphology in mouse fibroblasts. Biochim Biophys Acta 2006; 1757:1338-56; PMID:16987493; http://dx.doi.org/10.1016/j.bbabio.2006.08.001
- Domenis R, Bisetto E, Rossi D, Comelli M, Mavelli I. Glucose-modulated mitochondria adaptation in tumor cells: a focus on ATP synthase and inhibitor Factor 1. Int J Mol Sci 2012; 13:1933-50; PMID:22408432; http://dx.doi.org/10.3390/ijms13021933
- Baracca A, Chiaradonna F, Sgarbi G, Solaini G, Alberghina L, Lenaz G. Mitochondrial Complex I decrease is responsible for bioenergetic dysfunction in K-ras transformed cells. Biochim Biophys Acta 2010; 1797:314-23; PMID:19931505; http://dx.doi.org/10.1016/j.bbabio.2009.11.006
- Subramanian A, Kuehn H, Gould J, Tamayo P, Mesirov JP. GSEA-P: a desktop application for Gene Set Enrichment Analysis. Bioinformatics 2007; 23:3251-3; PMID:17644558; http://dx.doi.org/10.1093/bioinformatics/btm369
- Clocchiatti A, Di Giorgio E, Ingrao S, Meyer-Almes FJ, Tripodo C, Brancolini C. Class IIa HDACs repressive activities on MEF2-depedent transcription are associated with poor prognosis of ER+ breast tumors. FASEB J 2013; 27:942-54; PMID:23159930; http://dx.doi.org/10.1096/fj.12-209346
- Kerr EM, Gaude E, Turrell FK, Frezza C, Martins CP. Mutant Kras copy number defines metabolic reprogramming and therapeutic susceptibilities. Nature 2016; 531:110-3; PMID:26909577; http://dx.doi.org/10.1038/nature16967
- Le A, Cooper CR, Gouw AM, Dinavahi R, Maitra A, Deck LM, Royer RE, Vander Jagt DL, Semenza GL, Dang CV. Inhibition of lactate dehydrogenase A induces oxidative stress and inhibits tumor progression. Proc Natl Acad Sci U S A 2010; 107:2037-42; PMID:20133848; http://dx.doi.org/10.1073/pnas.0914433107
- Zhai X, Yang Y, Wan J, Zhu R, Wu Y. Inhibition of LDH-A by oxamate induces G2/M arrest, apoptosis and increases radiosensitivity in nasopharyngeal carcinoma cells. Oncol Rep 2013; 30:2983-91; PMID:24064966
- Fiume L, Manerba M, Vettraino M, Di Stefano G. Impairment of aerobic glycolysis by inhibitors of lactic dehydrogenase hinders the growth of human hepatocellular carcinoma cell lines. Pharmacology 2010; 86:157-62; PMID:20699632; http://dx.doi.org/10.1159/000317519
- Martinez-Outschoorn UE, Curry JM, Ko YH, Lin Z, Tuluc M, Cognetti D, Birbe RC, Pribitkin E, Bombonati A, Pestell RG, Howell A, Sotgia F, Lisanti MP. Oncogenes and inflammation rewire host energy metabolism in the tumor microenvironment: RAS and NFκB target stromal MCT4. Cell Cycle 2013; 12:2580-97; PMID:23860378; http://dx.doi.org/10.4161/cc.25510
- Warburg O. On the origin of cancer cells. Science 1956; 123:309-14
- Hsu PP, Sabatini DM. Cancer cell metabolism: Warburg and beyond. Cell 2008; 134:703-7; PMID:18775299; http://dx.doi.org/10.1016/j.cell.2008.08.021
- Palorini R, De Rasmo D, Gaviraghi M, Sala Danna L, Signorile A, Cirulli C, Chiaradonna F, Alberghina L, Papa S. Oncogenic K-ras expression is associated with derangement of the cAMP/PKA pathway and forskolin-reversible alterations of mitochondrial dynamics and respiration. Oncogene 2013; 32:352-62; PMID:22410778; http://dx.doi.org/10.1038/onc.2012.50
- de Candia P, Minopoli G, Verga V, Gargiulo A, Vanoni M, Alberghina L. Nutritional limitation sensitizes mammalian cells to GSK-3β inhibitors and leads to growth impairment. Am J Pathol 2011; 178:1814-23; PMID:21435461; http://dx.doi.org/10.1016/j.ajpath.2010.12.047
- Wang S, Jiang B, Zhang T, Liu L, Wang Y, Wang Y, Chen X, Lin H, Zhou L, Xia Y, Chen L, Yang C, Xiong Y, Ye D, Guan KL. Insulin and mTOR Pathway Regulate HDAC3-Mediated Deacetylation and Activation of PGK1. PLoS Biol 2015; 13:e1002243
- Dayan F, Roux D, Brahimi-Horn MC, Pouyssegur J, Mazure NM. The oxygen sensor factor-inhibiting hypoxia-inducible factor-1 controls expression of distinct genes through the bifunctional transcriptional character of hypoxia-inducible factor-1alpha. Cancer Res 2006; 66:3688-98; PMID:16585195; http://dx.doi.org/10.1158/0008-5472.CAN-05-4564
- Konieczna A, Szczepańska A, Sawiuk K, Węgrzyn G, Łyżeń R. Effects of partial silencing of genes coding for enzymes involved in glycolysis and tricarboxylic acid cycle on the enterance of human fibroblasts to the S phase. BMC Cell Biol 2015; 16:16; PMID:26017754; http://dx.doi.org/10.1186/s12860-015-0062-8
- Vander Heiden MG, Cantley LC, Thompson CB. Understanding the Warburg effect: the metabolic requirements of cell proliferation. Science 2009; 324:1029-33; PMID:19460998; http://dx.doi.org/10.1126/science.1160809
- Viale A, Pettazzoni P, Lyssiotis CA, Ying H, Sánchez N, Marchesini M, Carugo A, Green T, Seth S, Giuliani V. et al. Oncogene ablation-resistant pancreatic cancer cells depend on mitochondrial function. Nature 2014; 514:628-32; PMID:25119024; http://dx.doi.org/10.1038/nature13611
- Hu J, Locasale JW, Bielas JH, O'Sullivan J, Sheahan K, Cantley LC, Vander Heiden MG, Vitkup D. Heterogeneity of tumor-induced gene expression changes in the human metabolic network. Nat Biotechnol 2013; 31:522-9; PMID:23604282; http://dx.doi.org/10.1038/nbt.2530
- Cavalli LR, Varella-Garcia M, Liang BC. Diminished tumorigenic phenotype after depletion of mitochondrial DNA. Cell Growth Differ 1997; 8:1189-98; PMID:9372242
- Tan AS, Baty JW, Dong LF, Bezawork-Geleta A, Endaya B, Goodwin J, Bajzikova M, Kovarova J, Peterka M, Yan B, et al. Mitochondrial genome acquisition restores respiratory function and tumorigenic potential of cancer cells without mitochondrial DNA. Cell Metab 2015; 21:81-94; PMID:25565207; http://dx.doi.org/10.1016/j.cmet.2014.12.003
- LeBleu VS, O'Connell JT, Gonzalez Herrera KN, Wikman H, Pantel K, Haigis MC, de Carvalho FM, Damascena A, Domingos Chinen LT, Rocha RM, et al. PGC-1α mediates mitochondrial biogenesis and oxidative phosphorylation in cancer cells to promote metastasis. Nat Cell Biol 2014; 16:992-1003; PMID:25241037; http://dx.doi.org/10.1038/ncb3039
- Barrientos A. In vivo and in organello assessment of OXPHOS activities. Methods 2002; 26:307-16; PMID:12054921; http://dx.doi.org/10.1016/S1046-2023(02)00036-1