
ABSTRACT
Clear cell renal cell carcinoma (ccRCC) is a common pathological subtype of renal cancer. Although the recent application of molecular-targeted agents has modestly improved the prognosis of ccRCC patients, their outcome is still poor. It is therefore important to characterize the molecular and biological mechanisms responsible for the development of ccRCC. Approximately 25% ccRCC patients involves the loss of RNA-binding protein QKI at 6q26, but the role of QKI in ccRCC is unknown. Here, we found that QKI-5 was frequently downregulated in ccRCC patients and its down-regulation was significantly associated with clinical features including T status, M status, and differentiation grade, and poorer patient prognosis. Moreover, QKI-5 inhibited the proliferation of kidney cancer cells both in vitro and in vivo. The subsequent functional studies showed that QKI-5 stabilized RASA1 mRNA via directly binding to the QKI response element region of RASA1, which in turn prevented the activation of the Ras-MAPK signaling pathway, suppressed cellular proliferation and induced cell cycle arrest. Overall, our data demonstrate a suppressive role of QKI in ccRCC tumourigenesis that involves the QKI-mediated post-transcriptional regulation of the Ras-MAPK signaling pathway.
Introduction
Renal cell carcinoma (RCC) represents 5% of epithelial tumor, and its incidence has shown a steady increase of 2%–4% each year.Citation1 Histologically, the majority of cases (70–85%) are clear cell carcinomas (ccRCC), whereas other less frequent subtypes include papillary cell carcinomas (10–15%).Citation2 Moreover, the outcome for ccRCC is very poor, with a 5-year survival rate of 65–90% for patients with non-metastasized cases and only 10–20% for metastasized cases. The prognosis for ccRCC is largely influenced by a variety of factors that include clinical, pathological, and molecular features including gene mutations.Citation3-5 Thus, the comprehensive investigations of gene mutations and expression alterations are needed for better understanding the molecular mechanisms of kidney tumourigenesis, with the goal of identifying reliable early markers and effective therapeutic targets for ccRCC.
Recently, the aberrant activation of Ras-MAPK signaling has been reported in RCC.Citation6-9 RAS can serve as a molecular switch for RAS signaling in controlling cellular functions, and its activity is regulated by guanine nucleotide exchange factors (GEFs) and GTPase-activating proteins (GAPs).Citation10 Moreover, RAS-GTPase-activating proteins (RASGAPs), acting as RAS signaling terminators, have been reported to be associated with tumourigenicity and tumor progression.Citation11-13 As an important member of the RASGAP group, RAS p21 GTPase-activating protein 1 (RASA1) has also been proven to be a cancer suppressor gene in many types of cancer.Citation14-22
In previous study investigating the comprehensive molecular characterization of ccRCC, approximate 25% patients involved the focal somatic copy number alteration of putative tumor suppressor gene QKI at 6q26.Citation23 The RNA-binding protein Quaking (QKI) is a member of the highly conserved signal transduction and activator of RNA (STAR) family of RNA-binding proteins.Citation24 The QKI gene at least expresses 3 major QKI protein isoforms, designated as QKI-5, QKI-6, and QKI-7.Citation25 These isoforms have distinct C termini because of the alternative splicing. The QKI proteins selectively interact with a short sequence termed the QKI response element (QRE;ACUAAY[N1-20]UAAY).Citation26 Recent studies employing CLIP-Seq and bioinformatics analysis identified thousands of genes containing at least one QRE.Citation27 Among these target genes, many of them are cancer-related genes, such as Ras, Jun, Fos, β-catenin, p27, and p53. These findings denote QKI may associate with cancer initiation and progression.Citation28 Moreover, increasing evidence demonstrated that QKI may be a tumor suppressor in various human cancers, including glioblastoma,Citation29,30 prostate,Citation31 colon,Citation32 lung,Citation33 and gastric cancer.Citation34
However, the role of QKI in kidney cancer has not been investigated. In this study, we investigated the role of QKI in kidney tumourigenesis. We found that QKI expression is frequently reduced in ccRCC tissues and QKI inhibited cancer cell growth both in vitro and in vivo. Moreover,Our results demonstrate that QKI inhibits kidney cancer cell growth in part through the QKI-directed upregulation of RASA1 by directly binding to its QRE region. Together, our data establish a suppressive role for QKI in ccRCC tumourigenesis and present a new QKI/RASA1/Ras-MAPK pathway in regulation of cell proliferation.
Results
QKI-5 is frequently down regulated in archived ccRCC tissues and cell lines
In the present study, we focused on QKI-5 isoform because it contained a nuclear localization signal and functioned in pre-mRNA splicing and/or RNA retention.Citation35 QKI-5 mRNA levels were initially measured in 34 matched primary ccRCC samples and in their corresponding noncancerous normal tissue samples via real-time quantitative PCR (qPCR). The relative expression level of QKI-5 was significantly lower in the tumor tissues than it was in their noncancerous counterparts (, P < 0.01). A downregulation of QKI-5 was also observed in all of the tested ccRCC cell lines compared to HK-2, which derived from human renal proximal epithelial tubular cells(). These findings suggest that the reduction of QKI-5 expression may play a critical role in the development of ccRCC. Importantly, using The Cancer Genome Atlas (TCGA) ccRCC dataset (https://tcga-data.nci.nih.gov/tcga/), 513 primary ccRCC patients with both clinical and QKI-5 expression data were downloaded and analyzed updated to December 2015. The correlations between QKI-5 expression and clinicopathological characteristics were presented in . We found that level of QKI-5 in primary tumors was significantly correlated with the T stage, M status, and grade of differentiation (). In the Kaplan-Meier analysis, decreased QKI-5 expression significantly correlated with poorer overall survival in ccRCC patients (). Multivariate analyses of different prognostic parameters revealed that low QKI-5 expression was an independent, unfavorable prognostic indicator for overall survival (). Taken together, these analyses confirm the critical role of QKI-5 in predicting ccRCC patient outcomes.
Figure 1. Downregulation of QKI-5 mRNA expression in ccRCC tissues and cell lines. (A) QKI-5 mRNA expression levels in 34 paired primary ccRCC tissues (T) and adjacent noncancerous tissues (N) were determined by qPCR assays. P < 0.001, paired t test. (B) qPCR analysis of QKI-5 expression in ccRCC cell lines and HK-2 immortalized renal proximal epithelial tubular cells. (C-E) Correlation of QKI-5 gene expression with tumor T stage, M status, and grade of differentiation. chi-square test, Primary data were taken from TCGA ccRCC data set (https://tcga-data.nci.nih.gov/tcga/). The boxes represent the 25th to 75thpercentiles, and horizontal lines within the box represent median values. The whiskers represent the lowest and highest value in the 25th percentile minus 1.5IQR and 75th percentile plus 1.5IQR regions, respectively. (C)The 25thpercentiles,75thpercentiles,median in T1-2: 9.751695, 10.82361, 10.24365;T3-4: 9.427069, 10.51334, 9.962113.(D) The 25thpercentiles,75thpercentiles,median in M0: 9.651339, 10.74372, 10.19386;M1: 9.514634, 10.50172, 9.968011.(E) the 25thpercentiles,75thpercentiles,median in G1-2: 9.701859, 10.8063, 10.24195;G3-4: 9.547901, 10.6237, 10.04023.(F) Kaplan-Meier survival curve of overall survival for QKI-5 expression in 513 mLRCC patients from TCGA ccRCC dataset (https://tcga-data.nci.nih.gov/tcga/).
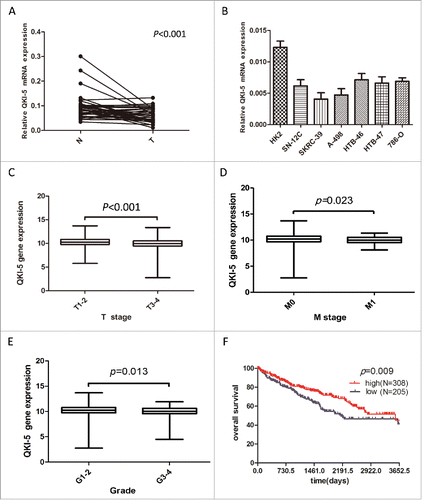
Table 1. Clinical characteristics of patients according to the QKI-5 expresion in the ccRCC patients.
Table 2. Univariate and multivariate analysis of overall survival in the ccRCC patients.
QKI-5 possesses tumor-suppressing abilities in vitro and in vivo
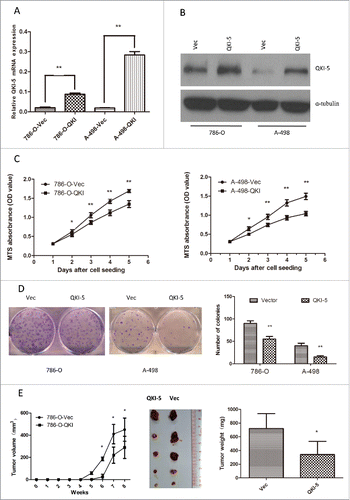
To evaluate the function of QKI-5 in renal cancer, QKI-5 was stably overexpressed in 2 mLRCC cell lines, 786-O and A-498 (786-O-QKI and A-498-QKI, respectively). Empty vector-transfected 786-O and A-498 (786-O-Vec and A-498-Vec, respectively) cells were used as controls. The increased expression of QKI-5 in these cells was confirmed via real-time qPCR and immunoblotting analysis (). In vitro assays revealed that the ectopic expression of QKI-5 effectively inhibited cellular proliferation, resulting in significant inhibition of the cellular growth rate (, P< 0.01) and reduction in the colony forming ability of the cells (, P < 0.01). To further confirm the tumor-suppressing role of QKI-5 in vivo, 786-O-QKI and 786-O-Vec cells were subcutaneously injected into nude mice, and tumor growth rates were evaluated. Tumor growth was significantly suppressed in mice injected with QKI-5-expressing 786-O cells when compared with growth in the controls (, P < 0.05). These results strongly suggest that QKI-5 plays a role in tumor suppression in the development of ccRCC.
Figure 2. Overexpression of QKI-5 inhibits the proliferation of ccRCC cells in vitro and in vivo. (A–E) 786-O and A-498 cells with stably overexpressing QKI-5 or transfected with empty vector (Vec) were analyzed as follows. (A) QKI-5 mRNA expression levels were determined by qPCR assays. (B) QKI-5 protein expression levels were determined by immunoblotting; α-tubulin was used as a loading control. (C) Cell proliferation was determined by the MTS assay; (D) Colony formation ability; representative micrographs (left) and quantification (right) of crystal violet-stained cells from 3 independent experiments; (E) Control or QKI-5-overexpressing 786-O cells were inoculated subcutaneously into nude mice (n = 5/group). Tumor volumes were measured (left) and weighed (right) on the last days of the experiment. Representative images of isolated tumors (middle) are presented; *P < 0.05, **P < 0.01, student's t-test.
Direct binding of QKI-5 enhances the stability of RASA1 mRNA
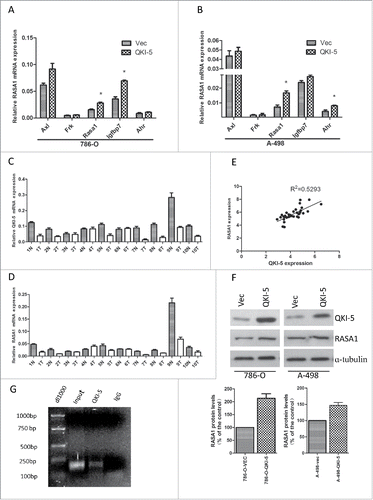
As an RNA-binding protein, QKI functions in modulating the expression of its target mRNAs at the post-transcriptional level. To determine the direct downstream mediator of QKI in the control of cell proliferation, we examined the coding and noncoding regions of cell cycle- and cell proliferation-associated genes which contained potential QREs, including Axl( AXL receptor tyrosine kinase), Frk(fyn related Src family tyrosine kinase), Rasa1(RAS p21 protein activator 1), Igfbp7(insulin like growth factor binding protein 7) and Ahr(aryl hydrocarbon receptor), and qPCR analyses were performed to test whether their mRNA levels were consistently altered upon QKI overexpression. RASA1 was identified as one of the candidates possessing the above-mentioned characteristics in both 786-O and A-498 cells (). To further confirm the relationship between QKI-5 and RASA1, we measured the expression of both molecules in 34 matched ccRCC samples. The results show that RASA1 mRNA expression was positively associated with QKI-5 expression in the clinical samples, with a relevance ratio of 0.5293 (). RASA1 protein expression was also upregulated in QKI-5-overexpressing 786-O and A-498 cells (). Sequence analysis of the 3′-UTR of RASA1 indicated that there was one putative QRE region, RNA-IP assay also confirmed the direct interaction between RASA1 mRNA and QKI-5 (). Taken together, our data reveal that QKI-5 direct up-regulates RASA1 expression.
Figure 3. QKI-5 directly upregulated RASA1 expression via regulating its mRNA stability. (A and B) mRNA expression levels were determined by real-time qPCR assays. The expression levels of RASA1 were significantly upregulated in 786-O and A-498 cells stably overexpressing QKI-5, whereas that of Axl, Frk, Igfbp7 and Ahr were not. *P< 0.05, Student t test. (C and D) QKI-5 and RASA1 mRNA expression was significantly downregulated in the matched primary ccRCC tissues (T) in contrast to the adjacent noncancerous tissues (N). (E) RASA1 mRNA levels were positively correlated with QKI-5 expression in 34 pairs of ccRCC tissues as determined by real-time qPCR (GAPDH was used as reference genes. Linear regression was indicated, r2 = 0.5293; P < 0.0001).(F) Immunoblotting analysis of RASA1 in control or QKI-5-overexpressing 786-O and A-498 cells, α-tubulin was used as a loading control. Data presented here are a representative of 3 different experiments. Densitometry of Western blot to analyze the relative protein expression by using Image J software (G) Direct interaction between RASA1 and QKI-5. QKI-5 overexpressing 786-O cells were immunoprecipitated with anti- QKI-5 antibody or the negative control IgG. The presence of RASA1 mRNA in the immunoprecipitation was detected by RT-PCR and visualized by ethidium bromide staining.
QKI-5 inhibits proliferation by inhibiting the RAS-MAPK pathway
To investigate whether QKI-5 inhibited tumor growth by upregulating RASA1, we designed siRNAs (si-rasa1-1 and si-rasa1-3) targeting RASA1. The suppressive effect of RASA1 in A-498-Vec and A-498-QKI cells was confirmed by real-time qPCR and western blotting (). Next, A-498-QKI cells were infected with si-ctrl, si-rasa1-1, or si-rasa1-3, and the cell proliferation rate was determined using an MTS assay. We found that knockdown of RASA1 in QKI-5 overexpressed A-498 cells partially abrogated the anti-proliferative activity of QKI-5 (). Thus, our data suggest that QKI-5 suppresses cell,at least in part, through direct post-transcriptional regulation of RASA1.
Figure 4. QKI-5 inhibits the proliferation of ccRCC cells via regulating RASA1 and the RAS-MAPK signaling pathway. (A and B) QKI-5-expressing and control A-498 cells were transiently transfected with RASA1siRNA (si-rasa1-1,si-rasa1-3) or scrambled control siRNA (si-ctrl). RASA1 expression levels were evaluated by real-time qPCR assays (A) and immunoblotting analysis(B). (C) MTS analysis of cell proliferation in A-498 cells described in A. (** p,0.01, Student's t-test). (D) Immunoblotting was used to assess the regulatory effect of QKI-5 and RASA1 in the regulation of RAS signaling pathway.
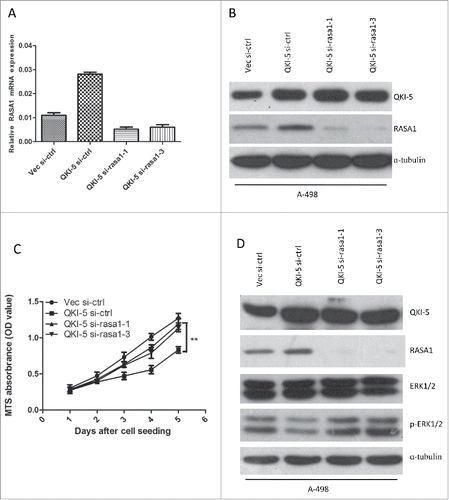
We next analyzed the molecular and biological consequences of QKI-5-driven RASA1 gene expression in A-498 cells. We examined ERK1/2 phosphorylation, which is a characteristic downstream signature of RAS pathway activation, and we found reduced phosphorylation of ERK1/2 in parallel with the up-regulation of QKI-5, was restored by RASA1 knockdown (). Overall, our results reveals that QKI-5 inhibits cellular proliferation and RAS-MAPK signaling via RASA1.
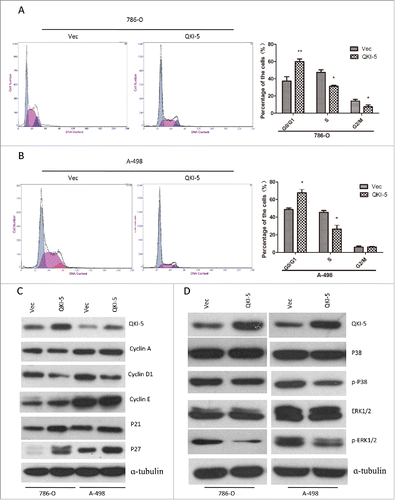
QKI-5 induce cell cycle arrest in G0/G1 phase
The Ras-MAPK signaling could induce cell cycle arrest. We have found that QKI-5 could regulate the phosphorylated forms of ERK1/2. Moreover, ectopic expression of QKI-5 in 786-O and A-498 cells significantly increased the proportion of cells in G0/G1 phase and decreased the proportion in S phase (). In addition, QKI-5-overexpressing 786-O and A-498 cells displayed a reduction in cyclin D1 and an accumulation of P21 and P27 (). The findings suggest that QKI-5 can inhibit the MAPK pathway and induce cell cycle arrest in G0/G1 phase.
Figure 5. QKI-5 promotes cell cycle arrest at the G1/S-phase transition through P27 and Cyclin D1, involving MAPK signaling pathway. (A and B) 786-O or A-498 cells stably overexpressing QKI-5 or transfected with empty vector (Vec) were subjected to cell cycle analysis by flow cytometry. Images and qualification of the cell cycle distribution in 3 experiments are shown; *P < 0.05, **P < 0.01, Student t test. (C) Immunoblotting analysis of cyclin A, cyclin D1, cyclin E, and their inhibitors p21 and p27 in the indicated cell lines. α-tubulin was used as a loading control. (D) Immunoblotting analysis of phosphorylated ERK, total ERK, phosphorylated p38, and total p38 in the indicated cell lines. α-tubulin was used as the loading control.
Discussion
Clear cell renal cell carcinoma (ccRCC) is a common pathological subtype of renal cancer, and a chemotherapy-resistant disease underlying gene mutations.Citation36 A common genetic alteration in ccRCC locate on chromosome 14q associated with loss of HIF1A (about 45% of samples), which has been predicted to drive aggressive diseases.Citation37 Moreover, the loss of RNA-binding protein QKI (about 25% of samples) has also been reported.Citation23 The qki gene locus is located on 6q26-q27, a region commonly associated with abnormalities in human malignancies, including glioblastoma and renal tumor,Citation23,29 indicating qki as a putative tumor suppressor gene. Recently, QKI expression was found to be significantly decreased in many types of cancers, including testis, lung, breast, bladder, cervix, ovary and colon cancer.Citation38 In our study, we also found that QKI-5 was commonly down-regulated in ccRCC tissues. Furthermore, the low expression of QKI-5 was correlated to clinicopathological features, such as T stage, M status, and differentiation status, and was significantly associated with a poorer overall survival in ccRCC patients. The results of multivariate Cox proportional hazards models indicated that the QKI-5 mRNA expression was an independent factor for survival. All of these data demonstrated that QKI-5 plays a key role in the development of ccRCC.
The QKI proteins belong to the heteronuclear ribonucleoprotein particle K homology domain family of RNA binding proteins. QKI could dimerize and bind multiple genes, such as Jun, Fos, β-catenin, MAG, p53, p27, MBP, and CTNNB1, which carried QREs located in the untranslated region (UTR) of mRNAs, resulting in mRNA stability, nuclear retention, RNA transportation, and/or translational modulation.Citation39 RASA1 was was selected as one of QKI candidate target gene because it has one putative QRE region in the 3′-UTR of its mRNA, and RNA-IP assay validated RASA1 was the direct target of QKI-5. As an important member of RASGAPs, RASA1 has been proved to be a cancer suppressor gene in many cancers.Citation18-22 RASA1 suppresses the actions of RAS by enhancing the weak intrinsic GTPase activity of RAS proteins, thus resulting in an increase in the inactive GDP-bound form of RAS, which leads to aberrant intracellular signaling through the RAS-RAF-ERK pathway.Citation40,41 In the present study, we first demonstrated that RASA1 is the direct target of QKI-5 and that QKI-5 may suppress ccRCC cell proliferation by targeting RASA1 and, therefore, downregulating the RAS/MAPK signaling pathway. This discovery adds to our understanding of the role of aberrant RAS signal activation in ccRCC.
In the present study, we revealed that QKI-5 regulated the G1/S phase transition of the cell cycle, and the cell cycle arrest induced by QKI-5 was partially corrected with the MAPK pathway-dependent regulated cell cycle related protein such as Cyclin D1and P27. Interestingly, our results also showed that QKI-5 over-expression could reduce the expression of cyclin D1 which contained no putative QREs in the 3′UTR of its mRNA. Yang et al.Citation42 have reported that cyclin D1 promoter activity was repressed by QKI overexpression. FU et al.Citation43 have also found out MAPK signaling pathway functioned as an upstream regulator of cyclin D1. Consistent with these reports, our results revealed that QKI-5 overexpression resulted in cyclin D1 downregulation and following cell cycle arrest through inhibition of ERK1/2 signaling.
In summary, The key findings of the present study are that QKI-5 directly binds to the QRE of RASA1 and subsequently stabilizes RASA1 mRNA, enhancing RASA1 expression. This inhibits cancer cell proliferation and prevents the activation of the Ras-MAPK signaling pathway. Importantly, a significant correlation was discovered between QKI-5 levels and RASA1 in a cohort of human kidney cancer samples and the low expression of QKI-5 was significantly associated with a poorer overall survival in ccRCC patients. Our findings indicate that QKI-5 is a novel tumor suppressor in ccRCC and may serves as a potential molecular target.
Materials and methods
Cell line selection and culturing, cellular growth curves, and colony-formation assays
The ccRCC cell lines 786-O and A-498 were maintained in RPMI 1640 medium (Invitrogen) supplemented with 10% fetal bovine serum (Invitrogen) at 37°C and 5% CO2. To generate a cellular growth curve, 3 × 10³ cells suspended in 200 μl of medium were seeded into a 96-well plate (Corning) and cultured under normal conditions. At various time points after seeding, the cells in each well were stained with MTS (Promega, G5421), and their OD490 was determined with a microplate reader. For the colony-formation assays, cells were counted and plated at 500 cells per well in a 6-well plate (Corning). Two weeks later, the cells were washed with phosphate-buffered saline (PBS), fixed with methanol for 15 min at room temperature, and stained with crystal violet for 30 min. The colony number was counted for those possessing more than 50 cells.
TCGA data analysis
TCGA data analysis using the publically accessible TCGA data portal (https://tcga-data.nci.nih.gov/tcga/), the clinical and molecule data included age, sex, tumor location, TNM stage, grade, LDH level, hemoglobin level and QKI-5 mRNA expression values were collected and analyzed from 513 mLRCC patients. And, QKI-5 mRNA expression values were quantified based on the TCGA methods using RSEM and upper quartile normalized, according to the TCGA normalization protocol.
Matched tumor tumor and tumor-adjacent tissues
Matched ccRCC tissues and corresponding tumor-adjacent, morphologically normal tissues were obtained from the Sun Yat-Sen University Cancer Center and were frozen and stored in liquid nitrogen until used to compare QKI-5 and RASA1 mRNA expression levels.
Real-time quantitative PCR (qPCR)
Total RNA was extracted from cultured cell lines using TRIzol reagent (Invitrogen) according to the manufacturer's instructions and then reverse-transcribed using a cDNA synthesis kit (Takara, 6111A). Real-time qPCR was performed using a SYBR Green PCR Kit (Bio-Rad, 172–5200). The expression of each target gene was normalized to the endogenous levels of GAPDH. The relative mRNA levels are shown as 2ΔCt values. The sequences of the PCR primers used for amplification were as follows: GAPDH forward, 5′-AAGGTCATCC CTGAGCTGAA-3′; GAPDH reverse, 5′- TGACAAAGTGGTCGTTGAGG-3′; QKI-5 forward, 5′-TCCGAGGCAAAGGCTCAATGAG-3′; QKI-5 reverse, 5′-GCTCTGTTCTGAGCATCTTCCAC-3′; RASA1 forward, 5′-CAGAACGATAGCAGAAGAACGC-3′; RASA1 reverse, 5′-ATGGTTGACAACATTCATCTGGC-3′; AXL forward, 5′-GCGGTCTGCATGAAGGAATTTG-3′; AXL reverse, 5′-AAGGTAAGATGACCACAGGTGC-3′; FRK forward, 5′-TTCTGGACACTTTGCATGAGGG-3′; FRK reverse, 5′-TCCTCAGCCACGTAGTTAGAAG-3′; IGFBP7 forward, 5′-AGCAAGGTCCTTCCATAGTGAC-3′; IGFBP7 reverse, 5′-TTTACCTTGTTCCAGATGAGGAC-3′; AHR forward, 5′-AGCCAAACGGTCCAACTCTGTA-3′; AHR reverse, 5′-ACAGCAGCAGCGCCAACATC-3′.
Lentiviral transduction
To generate cell lines stably overexpressing QKI-5, the QKI-5 coding sequence was cloned into a pLVX-IRES-puro lentiviral vector. The pspAX2 (cat: 12260, Addgene) and pMD2.G (cat: 12259, Addgene) packaging plasmids were used to produce lentiviruses in 293T cells. Then, the cells (786-O and A-498) were infected with the lentiviruses in the presence of 6 μg/ml Polybrene, and 2 μg/mL puromycin was used to select cells for 3 d. Real-time PCR and immunoblotting were also performed to evaluate the efficiency of QKI-5 overexpression.
RNAi treatment
The small-interfering RNA (siRNA) sequence targeting RASA1 was synthesized using by RIBOBIO (RiboBio Co. Ltd., Guangzhou, Guangdong). Growing cells were seeded at 2 × 10⁵ cells per well in a 6-well tissue culture dish, and siRNAs were added 24 h later at a concentration of 80 nM using the RNAiMAX reagent (Invitrogen, 13778–075). The transfected cells were incubated for 6 h and then supplied with fresh medium containing serum.
Cell cycle analysis
Cells were harvested via trypsinization, washed in ice-cold PBS, and fixed in 75% ice-cold ethanol at −20°C for at least 2 h. Before staining, cells were spun down and resuspended in PBS. RNase (Sigma, R3629) was added at a final concentration of 2 mg/ml, and the cells were incubated at 37°C for 15 min, followed by incubation in 15 mg/ml propidium iodide (PI, Sigma, P4170) for 15 min at room temperature. At least 10000 cells per sample were collected and analyzed using a flow cytometer (Beckman Coulter, Cytomics FC500).
Immunoblotting
Immunoblotting was performed according to standard methods as previously described.Citation44,45 The primary antibodies used included those for QKI-5 (Merck, 03–112); RASA1 (Santa Cruz, SC-63); cyclin A, D1, and E; p21; p27 (all from Santa Cruz Biotechnology); and α-tubulin (Sigma, T6199), as well as a number of antibodies from Cell Signaling Technology, including those for ERK (4780), phospho-ERK1/2 (5726), p38(8690), phospho-p38 (Thr180/Tyr182, 4511), and Raf-1 (9422). Anti-mouse and anti-rabbit peroxidase-conjugated secondary antibodies were purchased from Promega.
RNA-immunoprecipitation
QKI-5-expressing 786-O cells were seeded in 100-mm dishes. After being treated with 1% formaldehyde, the cells containing the cytoplasmic RNA protein complex were lysed in RIPA buffer and centrifuged at 12,000 g for 10 min at 4°C. The supernatants were precleaned for 60 min at 4°C using 5 μl of Protein-A Sepharose beads (Amersham Biosciences). After centrifugation, the supernatant was incubated with 10 μl of normal mouse IgG as a negative control (Santa Cruz Biotechnology) or anti-QKI-5 at 4°C for 60 min. After incubation, 5 μl of protein-A Sepharose beads were added to all tubes, and they were incubated for another 60 min at 4°C. After centrifugation at 12,000 g for 5 min, the precipitated beads were washed 3 times with RIPA buffer. The RNA in the immunoprecipitated complex and the RNA in the previously saved input fraction were released by reversing the cross-linking at 65°C for 2 h with 200 mM NaCl and 20 μg of proteinase K. The RNA was extracted and reverse transcribed before detection via real-time PCR.
Animal experiments
All animal experiments were approved by the Sun Yat-Sen University Cancer Center Institutional Animal Care and Usage Committee. Mice were housed under standard conditions and cared for according to institutional guidelines. BALB/c (nu/nu) nude mice (4 wk of age, 15–18 g) were randomly divided into 2 groups (5 mice each group). 786-o cells with stable QKI-5 overexpression or transfected with an empty vector (1.5 × 10⁶/150 μl RPMI 1640 medium) were injected subcutaneously into the flank of mice. Tumor diameters were measured using calipers every week, and the volume was calculated using the formula (Volume = length × width2 × 0.5236). Finally, the mice were euthanized, and the primary tumors were isolated and weighed.
Statistical analyses
All statistical analyses were performed using the SPSS 17.0 statistical software. Data from 3 independent experiments are presented as the mean values with standard deviations. The differences between groups were evaluated using student's t-test. The correlation between QKI-5 and RASA1mRNA levels in ccRCC tissues was evaluated using linear regression analysis. The clinical and molecule data for 513 mLRCC patients were collected and analyzed using the publically accessible TCGA data portal (https://tcga-data.nci.nih.gov/tcga/). Kaplan–Meier survival plot and log-rank test was performed to evaluate the association of QKI-5 mRNA level and overall survival using TCGA data. The significance test was defined as 2-tailed test, and P < 0.05 was considered statistically significant.
Disclosure of potential conflicts of interest
No potential conflicts of interest were disclosed.
Funding
This work was supported by grants from the National Natural Science Foundation of China (No. 81472386, No. 81272340, No. 81572901, No. 81572848, No. 81402248 and No. 81560388), the National High Technology Research and Development Program of China (863 Program) (No. 2012AA02A501), the Science and Technology Planning Project of Guangdong Province, China (No. 2014B020212017, No. 2014A020209024, No. 2014B050504004, and No. 2015B050501005), and the Natural Science Foundation of Guangdong Province, China (2016A030311011).
References
- Znaor A, Lortet-Tieulent J, Laversanne M, Jemal A, Bray F. International variations and trends in renal cell carcinoma incidence and mortality. Eur Urol 2015; 67(3):519-30; PMID:25449206; http://dx.doi.org/10.1016/j.eururo.2014.10.002
- Linehan WM, Srinivasan R, Schmidt LS. The genetic basis of kidney cancer: a metabolic disease. Nat Rev Urol 2010; 7(5):277-85; PMID:20448661; http://dx.doi.org/10.1038/nrurol.2010.47
- Qian CN. Hijacking the vasculature in ccRCC–co-option, remodelling and angiogenesis. Nat Rev Urol 2013; 10(5):300-4; PMID:23459032; http://dx.doi.org/10.1038/nrurol.2013.26
- Qian CN, Tan MH, Yang JP, Cao Y. Revisiting tumor angiogenesis: vessel co-option, vessel remodeling, and cancer cell-derived vasculature formation. Chinese J Cancer 2016; 35(1):10.
- Zhang ZL, Li YH, Xiong YH, Hou GL, Yao K, Dong P, Liu ZW, Han H, Qin ZK, Zhou FJ. Oncological outcome of surgical treatment in 336 patients with renal cell carcinoma. Chinese J Cancer 2010; 29(12):995-9; PMID:21114919; http://dx.doi.org/10.5732/cjc.010.10383
- Huang D, Ding Y, Luo WM, Bender S, Qian CN, Kort E, Zhang ZF, VandenBeldt K, Duesbery NS, Resau JH, et al. Inhibition of MAPK kinase signaling pathways suppressed renal cell carcinoma growth and angiogenesis in vivo. Cancer Res 2008; 68(1):81-88; PMID:18172299; http://dx.doi.org/10.1158/0008-5472.CAN-07-5311
- Liang YY, Zheng LS, Wu YZ, Peng LX, Cao Y, Cao X, Xie P, Huang BJ, Qian CN. RASSF6 promotes p21(Cip1/Waf1)-dependent cell cycle arrest and apoptosis through activation of the JNK/SAPK pathway in clear cell renal cell carcinoma. Cell Cycle 2014; 13(9):1440-9; PMID:24626183; http://dx.doi.org/10.4161/cc.28416
- Liu Y, Zhang M, Qian J, Bao M, Meng X, Zhang S, Zhang L, Zhao R, Li S, Cao Q, et al. miR-134 functions as a tumor suppressor in cell proliferation and epithelial-to-mesenchymal Transition by targeting KRAS in renal cell carcinoma cells. DNA Cell Biol 2015; 34(6):429-36; PMID:25811077; http://dx.doi.org/10.1089/dna.2014.2629
- Salinas-Sanchez AS, Gimenez-Bachs JM, Serrano-Oviedo L, Nam Cha S, Sanchez-Prieto R. Role of mitogen-activated protein kinase (MAPK) in the sporadic renal cell carcinoma. Actas Urologicas Espanolas 2012; 36(2):99-103; PMID:21959062
- Bos JL, Rehmann H, Wittinghofer A. GEFs and GAPs: critical elements in the control of small G proteins. Cell 2007; 129(5):865-77; PMID:17540168; http://dx.doi.org/10.1016/j.cell.2007.05.018
- Kolfschoten IG, van Leeuwen B, Berns K, Mullenders J, Beijersbergen RL, Bernards R, Voorhoeve PM, Agami R. A genetic screen identifies PITX1 as a suppressor of RAS activity and tumorigenicity. Cell 2005; 121(6):849-58; PMID:15960973; http://dx.doi.org/10.1016/j.cell.2005.04.017
- Ohta M, Seto M, Ijichi H, Miyabayashi K, Kudo Y, Mohri D, Asaoka Y, Tada M, Tanaka Y, Ikenoue T, et al. Decreased expression of the RAS-GTPase activating protein RASAL1 is associated with colorectal tumor progression. Gastroenterology 2009; 136(1):206-16; PMID:18992247; http://dx.doi.org/10.1053/j.gastro.2008.09.063
- McLaughlin SK, Olsen SN, Dake B, De Raedt T, Lim E, Bronson RT, Beroukhim R, Polyak K, Brown M, Kuperwasser C, et al. The RasGAP gene, RASAL2, is a tumor and metastasis suppressor. Cancer Cell 2013; 24(3):365-78; PMID:24029233; http://dx.doi.org/10.1016/j.ccr.2013.08.004
- Yang XY, Guan M, Vigil D, Der CJ, Lowy DR, Popescu NC. p120Ras-GAP binds the DLC1 Rho-GAP tumor suppressor protein and inhibits its RhoA GTPase and growth-suppressing activities. Oncogene 2009; 28(11):1401-9; PMID:19151751; http://dx.doi.org/10.1038/onc.2008.498
- Calvisi DF, Ladu S, Conner EA, Seo D, Hsieh JT, Factor VM, Thorgeirsson SS. Inactivation of Ras GTPase-activating proteins promotes unrestrained activity of wild-type Ras in human liver cancer. J Hepatol 2011; 54(2):311-9; PMID:21067840; http://dx.doi.org/10.1016/j.jhep.2010.06.036
- Mai A, Veltel S, Pellinen T, Padzik A, Coffey E, Marjomaki V, Ivaska J. Competitive binding of Rab21 and p120RasGAP to integrins regulates receptor traffic and migration. J Cell Biol 2011; 194(2):291-306; PMID:21768288; http://dx.doi.org/10.1083/jcb.201012126
- Sun D, Yu F, Ma Y, Zhao R, Chen X, Zhu J, Zhang CY, Chen J, Zhang J. MicroRNA-31 activates the RAS pathway and functions as an oncogenic MicroRNA in human colorectal cancer by repressing RAS p21 GTPase activating protein 1 (RASA1). J Biol Chem 2013; 288(13):9508-18; PMID:23322774; http://dx.doi.org/10.1074/jbc.M112.367763
- Anand S, Majeti BK, Acevedo LM, Murphy EA, Mukthavaram R, Scheppke L, Huang M, Shields DJ, Lindquist JN, Lapinski PE, et al. MicroRNA-132-mediated loss of p120RasGAP activates the endothelium to facilitate pathological angiogenesis. Nat Med 2010; 16(8):909-14; PMID:20676106; http://dx.doi.org/10.1038/nm.2186
- Organ SL, Hai J, Radulovich N, Marshall CB, Leung L, Sasazuki T, Shirasawa S, Zhu CQ, Navab R, Ikura M, et al. p120RasGAP is a mediator of rho pathway activation and tumorigenicity in the DLD1 colorectal cancer cell line. PloS One 2014; 9(1):e86103; PMID:24465899; http://dx.doi.org/10.1371/journal.pone.0086103
- Sharma SB, Lin CC, Farrugia MK, McLaughlin SL, Ellis EJ, Brundage KM, Salkeni MA, Ruppert JM. MicroRNAs 206 and 21 cooperate to promote RAS-extracellular signal-regulated kinase signaling by suppressing the translation of RASA1 and SPRED1. Mol Cell Biol 2014; 34(22):4143-64; PMID:25202123; http://dx.doi.org/10.1128/MCB.00480-14
- Liu Y, Liu T, Sun Q, Niu M, Jiang Y, Pang D. Downregulation of Ras GTPaseactivating protein 1 is associated with poor survival of breast invasive ductal carcinoma patients. Oncol Rep 2015; 33(1):119-24; PMID:25394563
- Li Z, Li D, Zhang G, Xiong J, Jie Z, Cheng H, Cao Y, Jiang M, Lin L, Le Z, et al. Methylation-associated silencing of MicroRNA-335 contributes tumor cell invasion and migration by interacting with RASA1 in gastric cancer. Am J Cancer Res 2014; 4(6):648-62; PMID:25520857
- Cancer Genome Atlas Research N. Comprehensive molecular characterization of clear cell renal cell carcinoma. Nature 2013; 499(7456):43-9; PMID:23792563; http://dx.doi.org/10.1038/nature12222
- Galarneau A, Richard S. Target RNA motif and target mRNAs of the Quaking STAR protein. Nat Structural Mol Biol 2005; 12(8):691-8; PMID:16041388; http://dx.doi.org/10.1038/nsmb963
- Chenard CA, Richard S. New implications for the QUAKING RNA binding protein in human disease. J Neurosci Res 2008; 86(2):233-42; PMID:17787018; http://dx.doi.org/10.1002/jnr.21485
- Biedermann B, Hotz HR, Ciosk R. The Quaking family of RNA-binding proteins: coordinators of the cell cycle and differentiation. Cell Cycle 2010; 9(10):1929-33; PMID:20495365; http://dx.doi.org/10.4161/cc.9.10.11533
- Hafner M, Landthaler M, Burger L, Khorshid M, Hausser J, Berninger P, Rothballer A, Ascano M, Jr, Jungkamp AC, Munschauer M, et al. Transcriptome-wide identification of RNA-binding protein and microRNA target sites by PAR-CLIP. Cell 2010; 141(1):129-41; PMID:20371350; http://dx.doi.org/10.1016/j.cell.2010.03.009
- Darbelli L, Richard S. Emerging functions of the Quaking RNA-binding proteins and link to human diseases. Wiley Interdisciplinary Rev RNA 2016; 7(3):399-412.
- Bandopadhayay P, Ramkissoon LA, Jain P, Bergthold G, Wala J, Zeid R, Schumacher SE, Urbanski L, O'Rourke R, Gibson WJ, et al. MYB-QKI rearrangements in angiocentric glioma drive tumorigenicity through a tripartite mechanism. Nature Genetics 2016; 48(3):273-82; PMID:26829751
- Chen AJ, Paik JH, Zhang H, Shukla SA, Mortensen R, Hu J, Ying H, Hu B, Hurt J, Farny N, et al. STAR RNA-binding protein Quaking suppresses cancer via stabilization of specific miRNA. Genes Dev 2012; 26(13):1459-72; PMID:22751500; http://dx.doi.org/10.1101/gad.189001.112
- Zhao Y, Zhang G, Wei M, Lu X, Fu H, Feng F, Wang S, Lu W, Wu N, Lu Z, et al. The tumor suppressing effects of QKI-5 in prostate cancer: a novel diagnostic and prognostic protein. Cancer Biol Ther 2014; 15(1):108-8; PMID:24153116; http://dx.doi.org/10.4161/cbt.26722
- Yang G, Fu H, Zhang J, Lu X, Yu F, Jin L, Bai L, Huang B, Shen L, Feng Y, et al. RNA-binding protein quaking, a critical regulator of colon epithelial differentiation and a suppressor of colon cancer. Gastroenterology 2010; 138(1):231-40 e231-235; http://dx.doi.org/10.1053/j.gastro.2009.08.001
- Zong FY, Fu X, Wei WJ, Luo YG, Heiner M, Cao LJ, Fang Z, Fang R, Lu D, Ji H, et al. The RNA-binding protein QKI suppresses cancer-associated aberrant splicing. PLoS Genetics 2014; 10(4):e1004289; PMID:24722255; http://dx.doi.org/10.1371/journal.pgen.1004289
- Bian Y, Wang L, Lu H, Yang G, Zhang Z, Fu H, Lu X, Wei M, Sun J, Zhao Q, et al. Downregulation of tumor suppressor QKI in gastric cancer and its implication in cancer prognosis. Biochem Biophys Res Commun 2012; 422(1):187-93; PMID:22569043; http://dx.doi.org/10.1016/j.bbrc.2012.04.138
- Pilotte J, Larocque D, Richard S. Nuclear translocation controlled by alternatively spliced isoforms inactivates the QUAKING apoptotic inducer. Genes Dev 2001; 15(7):845-58; PMID:11297509; http://dx.doi.org/10.1101/gad.860301
- Wang L, Ma L, Wang X, Li B, Guo S, Qiao Q. Therapeutic effects and associated adverse events of first-line treatments of advanced renal cell carcinoma (RCC): a meta-analysis. Int Urol Nephrol 2015; 47(4):617-24; PMID:25686740; http://dx.doi.org/10.1007/s11255-015-0932-1
- Gudas LJ, Fu L, Minton DR, Mongan NP, Nanus DM. The role of HIF1alpha in renal cell carcinoma tumorigenesis. J Mol Med 2014; 92(8):825-36; PMID:24916472; http://dx.doi.org/10.1007/s00109-014-1180-z
- Novikov L, Park JW, Chen H, Klerman H, Jalloh AS, Gamble MJ. QKI-mediated alternative splicing of the histone variant MacroH2A1 regulates cancer cell proliferation. Mol Cell Biol 2011; 31(20):4244-55; PMID:21844227; http://dx.doi.org/10.1128/MCB.05244-11
- Teplova M, Hafner M, Teplov D, Essig K, Tuschl T, Patel DJ. Structure-function studies of STAR family Quaking proteins bound to their in vivo RNA target sites. Genes Dev 2013; 27(8):928-40; http://dx.doi.org/10.1101/gad.216531.113
- Donovan S, Shannon KM, Bollag G. GTPase activating proteins: critical regulators of intracellular signaling. Biochim Et Biophys Acta 2002; 1602(1):23-45; PMID:11960693
- Buday L, Downward J. Many faces of Ras activation. Biochim Et Biophys Acta 2008; 1786(2):178-87; PMID:18541156
- Yang G, Lu X, Wang L, Bian Y, Fu H, Wei M, Pu J, Jin L, Yao L, Lu Z. E2F1 and RNA binding protein QKI comprise a negative feedback in the cell cycle regulation. Cell Cycle 2014; 10(16):2703-13; http://dx.doi.org/10.4161/cc.10.16.15928
- Fu X, Feng Y. QKI-5 suppresses cyclin D1 expression and proliferation of oral squamous cell carcinoma cells via MAPK signalling pathway. Int J Oral Maxillofacial Surg 2015; 44(5):562-7; PMID:25457822; http://dx.doi.org/10.1016/j.ijom.2014.10.001
- Li XJ, Peng LX, Shao JY, Lu WH, Zhang JX, Chen S, Chen ZY, Xiang YQ, Bao YN, Zheng FJ, et al. As an independent unfavorable prognostic factor, IL-8 promotes metastasis of nasopharyngeal carcinoma through induction of epithelial-mesenchymal transition and activation of AKT signaling. Carcinogenesis 2012; 33(7):1302-9; PMID:22610073; http://dx.doi.org/10.1093/carcin/bgs181
- Luo LL, Zhao L, Xi M, He LR, Shen JX, Li QQ, Liu SL, Zhang P, Xie D, Liu MZ. Association of insulin-like growth factor-binding protein-3 with radiotherapy response and prognosis of esophageal squamous cell carcinoma. Chinese J Cancer 2015; 34(11):514-21; PMID:26370590