ABSTRACT
Cyclin G-associated kinase (GAK) harbors a consensus phosphorylation motif (Y412) for c-Src; however, its physiological significance remains elusive. Here, we show that GAK is phosphorylated by c-Src not only at Y412 but also at Y1149. An anti-GAK-pY412 antibody recognized the shifted band of GAK during M phase. Immunofluorescence (IF) showed that GAK-pY412/pY1149 signals were present in the nucleus during interphase, translocated to chromosomes at prophase and prometaphase, moved to centrosomes at metaphase, and finally translocated to chromosomes at the end of telophase, when nuclear membrane formation was almost complete. These subcellular movements of GAK resemble those of DNA licensing factors. Indeed, mass spectrometry identified mini-chromosome maintenance (MCM) 3, an essential component of the DNA licensing system, as one of the association partners of GAK; immunoprecipitation-mediated Western blotting confirmed their association in vivo. These results suggest that the c-Src_GAK_MCM axis plays an important role in cell cycle progression through control of the DNA replication licensing system.
Introduction
Cyclin G-associated kinase (GAK), a ubiquitously expressed Ser/Thr kinase,Citation1 regulates clathrin-mediated endocytosis as an essential cofactor for HSC70-dependent uncoating of clathrin-coated vesicles.Citation2 GAK and its association partner clathrin heavy chain localize to both the cytoplasm and nucleus with distinct association modes.Citation3 GAK acts as a transcriptional coactivator of the androgen receptor in the nucleus.Citation4 GAK also plays an essential role in proper cell cycle progression during M phase because small interfering RNA (siRNA)-mediated knockdown of GAK causes an abnormality in the maintenance of centrosome stability and generates protruded, misaligned, or abnormally condensed chromosomes, thereby leading to cell cycle arrest at metaphase.Citation5 Thus, GAK is essential for cell growth because GAK knockout (GAK−/−) mice display embryonic lethalityCitation6 and mouse embryonic fibroblasts (MEFs) derived from GAK−/− mice fail to divide and ultimately become senescent.Citation7 This phenotype is independent of the Ser/Thr kinase activity of GAK because the cell cycle of MEFs derived from knockout mice expressing a kinase-dead form of GAK is normal.Citation8 GAK is overexpressed in nuclei of various cancer cells and the GAK expression level is positively correlated with malignancy in surgical specimens from prostate cancer patients.Citation9 The GAK level is also augmented in osteosarcoma cells of patients with a poor prognosis, and siRNA-mediated knockdown of GAK decreases the proliferation of osteosarcoma cells.Citation10
GAK harbors 4 structural domains: an N-terminal Ser/Thr kinase (K) domain, a PTEN-like (T) domain, a clathrin-binding (CB) domain, and a C-terminal J domain. Hampered clathrin-dependent trafficking caused by GAK knockout in fibroblasts is rescued by expressing the CB and J domains, suggesting that they play pivotal roles in GAK function.Citation11 GAK also harbors a consensus c-Src phosphorylation sequence in the T domain. Src family tyrosine kinases (SFKs), a family of proto-oncogenic non-receptor tyrosine kinases, are involved in various subcellular events, including mitotic entry, cleavage furrow ingression, and cytokinesis abscission.Citation12,13,14 Notably, the kinase activity of c-Src is remarkably augmented upon mitotic entry through cyclin-dependent kinase (Cdk) 1-induced phosphorylation.Citation15 Indeed, microinjection of an anti-Src antibody into G2 phase cells prevents mitotic entry,Citation16 and c-Src promotes proper spindle orientation in early prometaphase through centrosome-mediated aster formation,Citation17 suggesting a pivotal role of SFKs including c-Src in the regulation of mitosis and cytokinesis.Citation18 However, the precise roles of c-Src during M phase have remained elusive.
DNA replication starts at thousands of DNA replication origins, and their firing is regulated to occur only once in a single cell cycle to maintain genomic stability.Citation19 Failure of this once-per-cell-cycle replication generates replicative stress and DNA damage, thereby leading to chromosome instability seen in cancers.Citation20 This delicate regulation is guaranteed by temporally limiting 2 separate steps to occur once per cell cycle; DNA replication licensing and origin firing.Citation21 Crucial components of the DNA replication licensing system include 6 mini-chromosome maintenance (MCM) proteins (MCM2–7), which act as the eukaryotic DNA replicative helicase, 6 origin recognition complex (ORC) proteins (ORC1–6), CDC6, and Cdt1, which assemble step-wise to form the pre-replicative complex (pre-RC) from late M to early G1 phase of the cell cycle; ORC1–6 proteins function as a scaffold for the assembly of the pre-RC.Citation22,23,24 Then, the pre-RC helps to recruit other initiation proteins to form the pre-initiation complex for origin firing in late G1 phase. The MCM4, −6, and −7 subunits harbor DNA helicase activity, and the DNA entry gate for ORC-Cdc6-Cdt1-dependent helicase loading comprises the MCM2 and MCM5 subunits.Citation25 Compared with detailed understanding of their molecular mechanisms at G1/S phase, their behavior at late M to G1 phase is poorly understood.
In the present study, we show by immunofluorescence (IF) that MCM proteins such as MCM2 and MCM3 are loaded onto chromatin at the end of M phase when nuclear membrane formation is almost complete. This timing coincides with that of the phosphorylated form of GAK (GAK-pY412 and GAK-pY1149); these phosphorylations were generated by the c-Src protein kinase. Indeed, mutant cells expressing the non-phosphorylatable GAK-Y1149F protein showed a delayed S phase and a reduced growth rate. Moreover, GAK associated with MCM3 in vivo. We will discuss the potential importance of the c-Src_GAK_MCM axis for proper progression of the cell cycle.
Results
GAK is phosphorylated by c-Src during M phase
We previously reported that an anti-GAK monoclonal antibody detects multiple bands by Western blot (Wb) analysis in growing HeLa S3 cells.Citation3 To determine if these bands appear at a specific phase of the cell cycle, we synchronized cells using thymidine (S phase), mimosine (G1 phase), nocodazole (prometaphase), or taxol (meta/anaphase), and found that the band shift occurred primarily during M phase (arrowhead in ), as determined by flow cytometric analysis (Fig. S1). When we added λ-phosphatase to the cell extract in the absence of phosphatase inhibitors, the upper band (arrowhead in ) migrated slightly faster (red arrow in lane 2 of ); this effect was blocked when Y (sodium orthovanadate) and/or S/T (sodium fluoride) phosphatase inhibitors were also present (lanes 3–5 in ), suggesting that GAK is phosphorylated by Y and/or S/T protein kinases.
Figure 1. GAK is phosphorylated by c-Src in vitro. (A) GAK showed a band shift (arrowhead) during M phase when the cell cycle of HeLa S3 cells was synchronized by nocodazole (prometaphase; 40 ng/mL for 18 h) or taxol (meta/anaphase; 33 nM for 18 h), but not when the cells were synchronized by thymidine (S phase; 2.5 mM for 24 h), mimosine (G1 phase; 0.5 μM for 24 h), or unsynchronized. (B) Wb analysis of phosphorylation modifications of endogenous GAK in HeLa S3 cells after taxol treatment using λ-phosphatase (PPase) alone or together with the phosphatase inhibitors sodium orthovanadate (Na3VO4), sodium fluoride (NaF), and β-glycerophosphate (β-gp). GAK was detected by the anti-GAK monoclonal antibody (9–10). The asterisk shows a putative band for non-phosphorylated GAK. Red arrow indicates a shifted band in the presence of λ-PPase. α-tubulin was detected as a loading control. (C) GAK was phosphorylated by c-Src, as detected by in vitro kinase assays. (i) A schematic representation of the GAK structure with functional domains and amino acid numbers. K, T, CB, and J denote the regions of GAK fragment proteins used as a substrate. The amino acid sequence around Y412 is also shown in red font. (ii) Radio-autograph of SDS-PAGE analysis after in vitro kinase assays of the K, T, CB, and J fragments using c-Src. Crimson and turquoise arrowheads indicate the phosphorylated and non-phosphorylated bands, respectively. The horizontal pink arrowhead indicates the band for auto-phosphorylation of c-Src protein. (iii) CBB staining of the same SDS-PAGE gel to show the existence of the band at the same location. (iv) Radio-autograph (left) and CBB staining (right) of SDS-PAGE gels after in vitro kinase assays of 2 narrowed-down fragments (see red arrows in ) of the CB region using c-Src. Crimson and turquoise arrowheads indicate the phosphorylated and non-phosphorylated bands, respectively. (v) A schematic representation of the sites (Y412 and Y1149) of GAK that are phosphorylated by c-Src to indicate their locations at a glance.
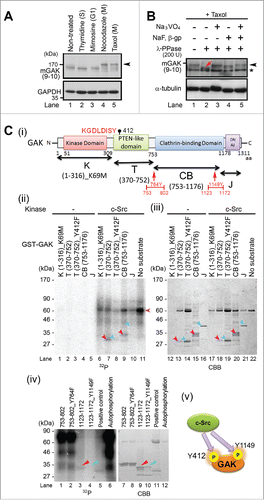
GAK harbors a consensus phosphorylation motif for c-Src (KGDLDISY) in the T domain (). Indeed, the T domain fused with glutathione S-transferase (GST) was phosphorylated by c-Src in vitro (lane 7 in ), whereas the T domain in which Y412 was replaced by non-phosphorylatable phenylalanine (Y412F) showed no phosphorylation (lane 8 in ). We also tested the K, CB, and J domains of GAK and found that GST-CB was phosphorylated by c-Src in vitro (lane 9 in ). The presence of these proteins was confirmed by staining with Coomassie brilliant blue (CBB) (). Because GST-CB contains 2 tyrosine residues (Y764 and Y1149), we divided it into 2 fragments and found that only the 1123–1172 fragment was phosphorylated by c-Src in vitro (lane 3 in ), whereas this fragment harboring the Y1149F mutation showed no phosphorylation (lane 4 in ). From these results, we conclude that c-Src phosphorylated GAK at Y412 and Y1149 in vitro ().
Antibodies against GAK-pY412 and GAK-pY1149 recognize the shifted band of GAK during M phase
Next, we generated anti-GAK-pY412 and anti-GAK-pY1149 antibodies and confirmed that they recognized the phosphopeptides used as antigens and for affinity purification, but not the non-phosphopeptide used for affinity purification alone ( and ). Notably, the intensities of the band detected by the anti-GAK-pY412 and anti-GAK-pY1149 antibodies were decreased (arrows in ) following GAK knockdown with Ki9-siRNA for 48 h.Citation5 Moreover, the GAK-pY412 band shift caused by synchronization at M phase using nocodazole and taxol coincided with the band shift that was detected by the anti-GAK monoclonal antibody (arrow in ), suggesting that phosphorylation of GAK-Y412 occurs predominantly at M phase. Indeed, when the cell cycle of U205 cells was synchronized by thymidine double block and release (TDBR), the intensity of the GAK-pY412 band peaked at 9 h (M phase) after TDBR ().
Figure 2. Phosphorylation of GAK by c-Src occurs during M phase of the cell cycle in vivo. (A, B) Peptide dot blot analysis of the anti-GAK-pY412 (A) and anti-GAK-pY1149 (B) polyclonal antibodies generated using the KLH-conjugated phosphopeptides, namely, DLDISpYITSR for the anti-GAK-pY412 antibody and TQPRPNpYASNFSVI for the anti-GAK-pY1149 antibody. These antibodies recognized the phosphopeptides at the indicated concentrations more strongly than the non-phosphorylated peptide. (C) Treatment of HeLa S3 cells with Ki9 siRNA downregulated the protein levels of GAK, GAK-pY412 (arrow), and GAK-pY1149 (arrow), as detected by anti-GAK (9–10), anti-GAK-pY412, and anti-GAK-pY1149 antibodies, respectively. GL2 was the negative control siRNA. (D) The anti-GAK-pY412 antibody recognized the shifted band of GAK during M phase (arrows), which was detected after cell cycle synchronization of HeLa S cells using nocodazole (Noc; meta/anaphase) or taxol (Tax; prometaphase), but not by thymidine (Thy; S phase) or mimosine (Mim; G1 phase). NT, non-treated. MCM2 (S phase), cyclin B1 (M phase) and Aurora-A (M phase) proteins were detected to monitor cell cycle synchronization. (E) Phosphorylation of GAK at Y412 by c-Src peaks at 9 h (M phase of the cell cycle) in U2OS cells synchronized by TDBR, which was carried out by addition of 2.5 mM thymidine twice, followed by collection of cell extract at 3, 6, 9, 12, and 15 h after replacement of medium, according to the time schedule shown at the top panel. GAK-pY412 bands detected in the presence of the non-phosphopeptide (top panel) disappeared in the presence of the phosphopeptide (second panel). Aurora-B and cyclin B1 were detected to monitor the successful synchronization of the cell cycle. M phase cells accumulated at around 9 h after TDBR. Red arrowhead denotes a putative band for GAK-Y412 phosphorylated at a single site or non-phosphorylated form of GAK detected by anti-GAK-pY412 antibody (C, D, and E). α-tubulin was detected as a loading control (C, D, and E).
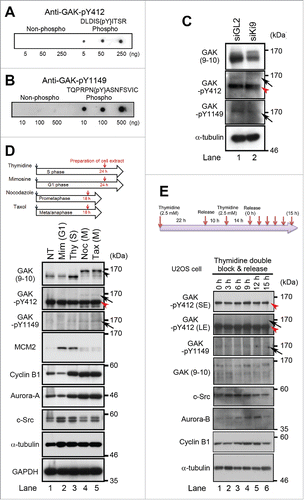
These putatively phosphorylated bands disappeared after competition with the phosphopeptide, but not with the non-phosphopeptide (Fig. S2A). The lower highly intense GAK band (red arrowheads in ) appears to be derived from Y412-phosphorylated GAK because it was detected by anti-GAK-pY412 antibody and disappeared after competition with the phosphopeptide (orange arrowhead in Fig. S2A). These results suggest that Y412-phosphorylated GAK proteins are present in both shifted and non-shifted GAK bands; the non-shifted band may correspond to GAK-Y412 phosphorylated at a single site, while the shifted band may correspond to GAK-Y412 phosphorylation at additional sites (GAK-Y1149 and other residues). We cannot exclude a possibility, however, that this lower intense band is derived from non-phosphorylated form of GAK. Notably, the intensities of the GAK-pY412 and GAK bands peaked similarly during M phase (9 h after TDBR; ). By contrast, no apparent increase of c-Src at 9–12 h was observed (). The increases in the intensities of Aurora-A and cyclin A bands at 9–12 h suggest that most cells reached M phase due to successful synchronization by TDBR.
Anti-GAK-pY1149 antibody also recognized the shifted band of GAK, the intensity of which was reduced by siRNA-mediated GAK knockdown (arrow in ). This band appeared not only at M phase (lanes 4 and 5 of ), but also at S phase (lane 3), suggesting a role for GAK-Y1149 phosphorylation, but not for GAK-Y412 phosphorylation at S phase. These results suggest that the band shift of GAK at M phase was primarily due to phosphorylation of its Y412 and Y1149 residues.
GAK-pY412 and GAK-pY1149 signals localize at centrosomes during M phase
When we performed IF in HeLa S3 cells, both GAK-pY412 and GAK-pY1149 signals were weakly detected in the nucleus during interphase and in the vicinity of chromosomes at prophase and prometaphase (). Then, the GAK-pY412 signals accumulated at the centrosome at metaphase and microtubules at anaphase (). By contrast, the GAK-pY1149 signals were detected at both the centrosome and chromosomes immediately before metaphase, and then the centrosome signals disappeared rapidly after metaphase; this chromosome signal was intensified at anaphase when the GAK-pY1149 signal appeared at the midbody (). At cytokinesis, the chromosome and midbody signals of GAK-pY1149 became faint when the cell entered a new interphase. Notably, the GAK-pY1149 signals were also detected at the cell membrane and their at this location peaked at metaphase ().
Figure 3. Subcellular localizations of GAK, GAK-pY412, and GAK-pY1149. (A, B) Immunostaining of logarithmically growing HeLa S3 cells with the polyclonal anti-GAK-pY412 (A) and anti-GAK-pY1149 (B) antibodies. Typical IF images at interphase and M phase are arranged along the time sequence of cell cycle progression. Contrast-enhanced images of GAK-pY412 (A) and GAK-pY1149 (B) are also shown in the rightmost panels. Yellow arrowheads indicate the putative localizations of these signals at the centrosome. α-tubulin signals were observed to monitor the cell cycle stage. (C–F) Typical IF images at metaphase are shown, which were obtained by immunostaining HeLa S3 cells with anti-GAK-pY412 (C, F), anti-GAK-pY1149 (D, E), anti-γ-tubulin (C, D), and anti-GAK (9–10) antibodies (E, F). (A–F) DNA was counterstained with Hoechst 33258 to detect the localization of chromatin. Bars, 10 µm.
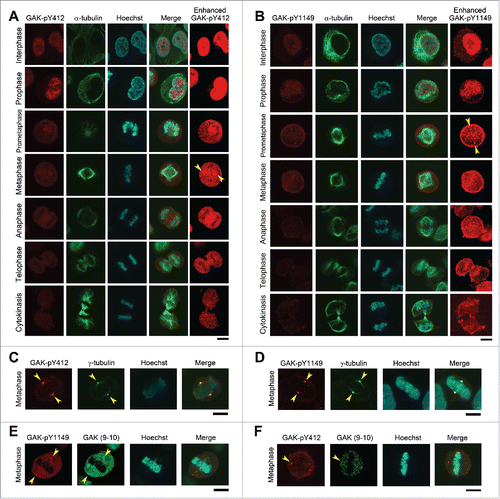
We confirmed that these signals are derived from the phosphorylated form of GAK-pY412/pY1149 by competition experiments using phospho/non-phosphopeptide antibodies (Fig. S2B, Fig. S2C). We also confirmed the centrosomal localization of GAK-pY412/pY1149 signals by co-immunostaining with an antibody against γ-tubulin, a centrosome marker (). Co-immunostaining with the anti-GAK antibody (9–10) also showed that the major portion of GAK localized at centrosomes during M phase (). Immunostaining with the anti-GAK antibody also showed similar signals to GAK-pY412/pY1149 signals at interphase and during M phase, including its centrosomal localization (Fig. S3). These results suggest that GAK-pY412/pY1149 play an important role in M phase progression.
GAK-pY1149 controls S phase progression
To examine the biological effects of these phosphorylations, we generated Tet-ON inducible cell lines that express the non-phosphorylated or constitutively phosphorylated form of mutant proteins in which the Y412 or Y1149 residue was replaced by phenylalanine (F) or glutamic acid (D), respectively, in response to doxycycline (Dox). We first performed flow cytometry and found that GAK-Y1149F HeLa S3 cells cultured in the presence of Dox (Dox (+)) showed delayed S phase progression compared with wild-type (GAK-WT), vector alone (Vec), and Dox (+) GAK-Y1149D cells (Fig. S4). By contrast, Dox (+) GAK-Y412F U2OS cells showed normal S phase progression; this difference may not be due to the difference in the cell lines used because the GAK-pY1149 band, but not the GAK-pY412 band, was also detected at S phase (lane 3 of ).
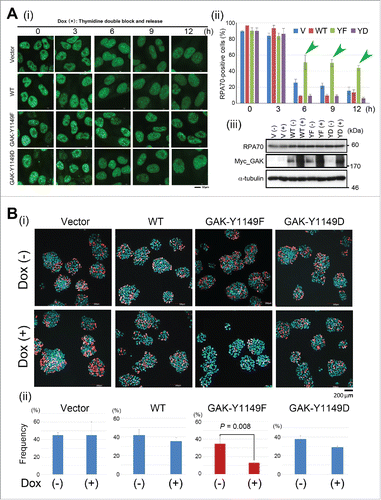
To test if S phase of Dox (+) GAK-Y1149D cells were actually delayed, we observed the amount of RPA70, a DNA replication regulator, to monitor S phase progression by immunostaining, and found that the RPA70 signal was retained at 6–12 h only in Dox (+) GAK-Y1149F cells (). We also examined newly synthesized DNA by monitoring the incorporation of a thymidine analog, 5-ethynyl-2′-deoxyuridine (EdU), and found that DNA replication was delayed only in Dox (+) GAK-Y1149F cells ().
Figure 4. GAK-Y1149F cells show a delay in S phase progression. (A) (i) Typical IF images, obtained by immunostaining with an anti-RPA70 antibody, of HeLa S3 cells expressing the vector alone (Vector), GAK-WT, GAK-Y1149F, or GAK-Y1149D in the presence of Dox at the indicated number of hours after TDBR treatment. (ii) Bar graphs showing the frequency (%) of HeLa S3 cells harboring more than 20 RPA70 dot signals. Green arrowheads highlight that GAK-Y1149F-expressing cells showed an increased frequency of RPA70-positive cells at 6, 9, and 12 h after TDBR treatment. (iii) Wb analysis indicates that the RPA70 level was unaltered and that the GAK-WT, GAK-Y1149F, and GAK-Y1149D proteins were successfully induced in the presence of Dox. α-tubulin was detected as a loading control. Bar, 10 µm. (B) The amount of newly synthesized DNA was reduced in Dox (+) GAK-Y1149F cells. (i) Typical images of Vector, GAK-WT, GAK-Y1149F, or GAK-Y1149D cells after incorporation of fluorescently labeled EdU in the presence (+) or absence (−) of Dox. Bar, 200 µm. (ii) Bar graphs showing the frequency (%) of the indicated HeLa S3 cells harboring more than 20 EdU dot signals. The difference between (−) and (+) red bars is statistically significant (P = 0.008).
GAK associates with MCM3
To elucidate the molecular mechanism underlying this S phase delay, we searched for GAK association partners using liquid chromatography-tandem mass spectrometry (LC-MS/MS). Although we failed to identify a protein that specifically binds to GAK-pY412, namely, no disappeared band was detected when GAK-Y412F protein was expressed, we identified MCM3 and DNA topoisomerase I, 2 important regulators of DNA replication, as candidate GAK-WT binding proteins (Fig. S5A). We chose MCM3 for further study because immunoprecipitation-mediated Wb analysis (IP/Wb) showed the in vivo association of GAK with MCM3 (), with similar association levels among the GAK mutants (Fig. S5B). By contrast, no association was detected between GAK and c-Src by IP/Wb ().
Figure 5. GAK associates with MCM3 and GAK-1149F cells show a reduced growth rate. (A, B) GAK associated with MCM3 (A), but not with c-Src (B), in U2OS cells. (C) Wb analysis shows that the band shift of MCM2 (red arrowheads) and the peak of the MCM3-pS112 band intensity (blue arrows) and the timing of its decrease (turquoise arrowheads) were delayed in Dox (+) GAK-Y1149F cells, but not in Vec-, GAK-WT-, and GAK-Y1149D-expressing cells (red and blue arrowheads), at around 9–12 h after TDBR treatment. The ORC2 level was almost unaltered, which served as a loading control. LE, long exposure; SE, short exposure. (D) Flow cytometry shows that the ratio between the G1 phase peak (black arrowheads) and the G2/M phase peak (gray arrowheads) was lowered in the following order: Vec > GAK-Y1149D > GAK-WT > GAK-Y1149F in the presence of Dox. (E) Cell cycle progression was delayed in Dox (+) GAK-Y1149F cells (green arrowhead) compared with Vec-, GAK-WT-, and GAK-Y1149D-expressing cells.
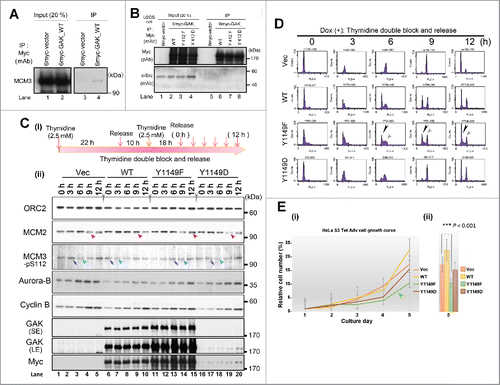
Wb analysis revealed that not only the timing of the band shift (putative phosphorylation) of MCM2, another MCM member, but also the timing of the MCM3-pS112 band intensity peak (blue arrows) and its subsequent decrease (turquoise arrowheads) was delayed in Dox (+) GAK-Y1149F cells (). The almost unaltered band intensity of ORC2, a scaffold factor of DNA replication licensing, throughout the cell cycle served as a loading control. The expression level of exogenous GAK increased in the following order: GAK-Y1149F > GAK-WT > GAK-Y1149D in the presence of Dox, suggesting that GAK-Y1149F proteins are stable in HeLa S3 cells ().
Moreover, flow cytometry after TDBR () also showed delayed cell cycle progression not only in S phase but also in G2/M phase only in Dox (+) GAK-Y1149F cells, as judged by the ratio between the G1 phase peak (black arrowheads) and the G2/M phase peak (gray arrowheads), and the data presented in the line, bar, and box graphs (Fig. S6). Namely, the delayed cell cycle progression decreased in the following order: Vec > GAK-Y1149D > GAK-WT > GAK-Y1149F in the presence of Dox (). Notably, the delayed S phase progression reduced the growth rate of Dox (+) GAK-Y1149F cells (). However, subcutaneous transplantation of HeLa S3 cells expressing Myc-vec, GAK-WT or GAK-Y1149F into the lateral back of nude mice in the presence of Dox resulted in tumors with similar growth rates (Fig. S7).
GAK, MCM2, and MCM3 translocate to chromatin at the end of telophase
IF showed that GAK (Fig. S3), MCM3 (Fig. S6), and MCM2 (Fig. S9) changed their subcellular localizations during M phase. By contrast, ORC2 translocated to chromatin a little earlier than these proteins (Fig. S10). To compare their subcellular localizations at a glance, we arranged typical images at late M phase (). Indeed, most GAK-pY412 signals were located outside of chromatin at anaphase and early telophase (), but suddenly translocated to chromatin, leaving some signals outside of chromatin at late telophase (). Afterward, most GAK-pY412 signals were located at chromatin (), with a similar strong intensity to G1 phase cells in the vicinity (yellow arrow in ). By contrast, most GAK-pY1149 signals located at the plasma membrane in anaphase (), and some signals entered the cytoplasm but did not localize at chromatin (). Some GAK-pY1149 signals translocated to chromatin at late telophase (white arrowheads in ).
Figure 6. GAK-pY412, GAK-pY1149, ORC2, MCM2, and MCM3 translocate to chromatin at the end of telophase. (A–F) The subcellular localizations of GAK-pY412, GAK-pY1149, ORC2, MCM2, MCM3, and Lamin A/C during M phase are shown. Typical IF images are arranged along the time sequence of M phase progression. The yellow arrow (A-vi), white arrowheads (B-iii), green arrowheads (E-ii), and yellow arrowheads (F-ii) denote GAK-pY412 signals at interphase, GAK-pY1149 signals at the end of telophase, ORC2 signals at early anaphase, and the edge of the Lamin A/C envelope that was almost closed, respectively.
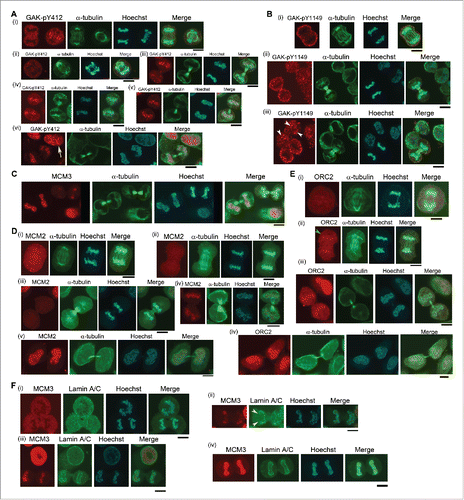
MCM3 () and MCM2 () signals also showed similar subcellular localizations to those of GAK-pY412 signals, showing abrupt translocation to chromatin at late telophase when cells had almost completed cytokinesis. By contrast, although most ORC2 signals were detected outside of chromatin at early anaphase (), a portion had already translocated to chromatin even at late anaphase when cellular constriction started at early telophase (green arrowhead in ). Afterward, most ORC2 signals were located similarly to MCM2 and MCM3.
To visualize the exact timing of translocation to chromatin, we immunostained HeLa cells with antibodies against MCM3 and lamin A/C, a component of the nuclear membrane that is constructed around chromatin at late telophase (Fig. S11). MCM3 was detected outside of chromatin at anaphase when no nuclear membrane was constructed (). By contrast, when formation of the nuclear membrane was almost complete, as highlighted by the yellow arrowhead at the edge of the nuclear membrane, MCM3 started to translocate to chromatin, leaving some MCM3 signals outside chromatin (). Afterward, MCM3 signals at chromatin gradually intensified (compare ). These results suggest the coincidence of chromatin translocation of MCM3 with nuclear membrane formation.
Phosphorylation of GAK at Y1149 is required for its nuclear localization at interphase
To examine if exogenous expression of GAK-Y1149F or GAK-Y1149D alters the subcellular localization of endogenous GAK proteins, we immunostained HeLa S3 cells expressing GAK-Y1149F in the presence of Dox using anti-GAK-pY412 polyclonal, anti-GAK-pY1149 polyclonal, anti-GAK polyclonal (pGAK), anti-GAK monoclonal (9–10), and anti-Myc (for Myc-GAK) monoclonal antibodies. Interestingly, the localization of endogenous GAK-pY412 signals was unaffected by the exogenous expression of GAK-Y1149F or GAK-Y1149D and resembled that observed in normal HeLa S3 cells (pink arrows in ; see also ) with retention of the signals in the nucleus at interphase (). By contrast, endogenous GAK-pY1149 signals no longer appeared in the nucleus and were mostly found in the cytoplasm (pale green arrowheads in ), although endogenous GAK-pY1149 signals were present in the cytoplasm and nucleus in normal HeLa S3 cells (). GAK signals detected by anti-pGAK, -Myc, and -GAK (9–10) antibodies, which detect phosphorylated and non-phosphorylated GAK, were observed predominantly in the cytoplasm (pale green arrowheads in ). Moreover, immunostaining with pGAK and GAK (9–10) antibodies also indicated that most of the GAK molecules localized to the cytoplasm in HeLa S3 cells expressing GAK-Y1149F. By contrast, GAK signals in normal HeLa S3 cells (Fig. S3B) and in other mammalian cellsCitation3 are detected in the cytoplasm and nucleus. This explains why Dox (+) GAK-Y1149F cells showed a delay in S phase. The percentage of pY1149-phosphorylated GAK molecules may be small but they play an important role in the nucleus for proper S phase progression.
Figure 7. Subcellular localizations of GAK, GAK-pY412, and GAK-pY1149 in HeLa S3 cells expressing GAK-Y1149F proteins in the presence of Dox. Anti-GAK-pY412 polyclonal antibody, anti-GAK-pY1149 polyclonal antibody, anti-GAK polyclonal antibody (pGAK), anti-GAK monoclonal antibody (9–10), and anti-Myc (for Myc-GAK) monoclonal antibody were used for immunostaining. Contrast-enhanced images are also shown in the rightmost panels. Pink arrows indicate pY412 images in the nucleus. Pale green arrowheads emphasize the cytoplasmic signals of pY412, pY1149, Myc-GAK, pGAK, and GAK (9–10). Hoechst, Hoechst33258 used to detect DNA in the nucleus. Bar, 10 µm.
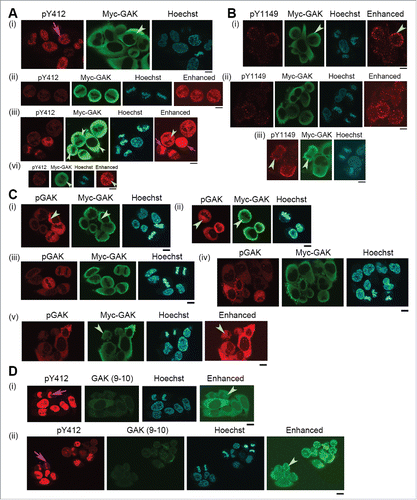
Notably, endogenous GAK proteins detected by anti-pGAK or anti-GAK (9–10) antibodies showed that GAK is localized to the cytoplasm and nucleus at interphase and late M phase in GAK-Y1149D-expressing HeLa S3 cells (highlighted by turquoise arrows in Fig. S12). This GAK localization is similar to that of normal HeLa S3 cells (Fig. S3B) and other mammalian cells.Citation3 Thus, evacuation of GAK signals from the nucleus is an event specific to GAK-Y1149F-expressing HeLa S3 cells. These results suggest that phosphorylation of GAK at Y1149 is required for its nuclear localization at interphase and for its role in proper S phase progression.
Discussion
In the present study, we showed that GAK is phosphorylated by c-Src at Y412 and Y1149 both in vitro () and in vivo (). Wb analysis revealed that the band shift of GAK due to phosphorylation occurred primarily during M phase, which was specifically detected by an anti-GAK-pY412 antibody (). IF suggested that GAK-pY412/pY1149 play important roles in M phase progression because their signals, detected in the nucleus during interphase, translocated in the vicinity of chromosomes at prophase and prometaphase ( and ). Then, GAK-pY412 signals accumulated at centrosomes at metaphase and microtubules at anaphase (). By contrast, the GAK-pY1149 signals were detected at both the centrosome and chromosomes immediately before metaphase, and then the centrosome signals disappeared rapidly after metaphase (). Dox (+) GAK-Y1149F cells, but not Dox (+) GAK-Y412F cells, showed delayed S phase progression compared with GAK-WT, GAK-vec, and GAK-Y1149D cells (Fig. S4). Indeed, S phase progression monitored by the RPA70 signal was retained at 6–12 h only in Dox (+) GAK-Y1149F cells (). The EdU assay also revealed delayed DNA replication in Dox (+) GAK-Y1149F cells (). MS identified MCM3 as an association partner of GAK during M phase, which was confirmed by IP/Wb (). The timing of putative phosphorylation of MCM2, another MCM member, and MCM-pS112 was apparently delayed in Dox (+) GAK-Y1149F cells (), and flow cytometry after TDBR also showed delayed G2/M phase progression only in Dox (+) GAK-Y1149F cells ( and Fig. S6B–D), thereby leading to the reduced growth rate of Dox (+) GAK-Y1149F cells (). IF also revealed the coincidence of chromatin translocation of GAK-pY412, GAK-pY1149, ORC2, MCM2, and MCM3 with nuclear membrane formation (). Exogenous expression of GAK-Y1149F proteins resulted in the loss of endogenous GAK proteins from the nucleus (), suggesting a role for GAK-pY1149 phosphorylation in proper S phase control. These results suggest that GAK-Y1149 phosphorylation by c-Src is required for proper progression of the cell cycle.
DNA replication and centrosome duplication that occur during S phase basically resemble each other because both undergo semi-conservative duplication once-per-cell-cycle, which is initiated by increased Cdk2 activity at the G1/S phase boundary.Citation26 ORC and MCM proteins were detected at the centrosome during the cell cycle, and MCM3 and ORC2 were efficiently co-precipitated with γ-tubulin, suggesting an interdependent regulation of DNA replication and chromosome segregation.Citation27 Cdk2 activators, cyclin A and cyclin E, are essential for centrosome duplication because combined ablation of both cyclin E and cyclin A extinguishes cell division.Citation28 Cyclin E and cyclin A directly interact with MCM5 and recruit it to centrosomes.Citation29 Suppression of MCM3 and ORC2 expression by siRNA causes the generation of multinucleated cells and the abnormal organization of microtubules.Citation27 Src and Aurora-A interact upon Golgi ribbon fragmentation that occurs at the onset of mitosis, and Src phosphorylates Aurora-A at Y148, which allows Aurora-A localization at centrosomes.Citation30 ORC and MCM proteins colocalize with the polo-like protein kinase (PLK1) at centrosomes,Citation27 and MCM7 interacts with PLK1 in a soluble chromatin fraction.Citation31 Notably, siRNA-mediated knockdown of GAK activates the spindle-assembly checkpoint that leads to cell cycle arrest at metaphase, suggesting a pivotal role of GAK in the maintenance of proper centrosome maturation and mitotic chromosome congression.Citation5 Our results here indicate that GAK, GAK-pY412, GAK-pY1149, and c-Src localize at centrosomes in metaphase and anaphase (, Fig. S2), and GAK interacts with MCM3 (). These results indicate that pre-RC proteins accumulate at centrosomes and then translocate to chromatin to form the pre-RC, suggesting a pivotal role of the centrosome in formation of the DNA replication licensing complex at M phase.
We previously reported that a fraction of GAK protein is also found in the nucleus, although GAK mainly localizes to the cytoplasm in normal cells.Citation3 Tissue microarray analysis for neo-adjuvant hormone therapy revealed that GAK expression increases significantly during the progression of prostate cancer to androgen independence.Citation4 GAK is overexpressed in U2OS osteosarcoma cells and knockdown of GAK inhibits their proliferation.Citation10 We recently showed that GAK is modified and overexpressed in metastatic cancer cells, and that nuclear GAK is expressed at high levels in surgical specimens from prostate cancer patients with a positive correlation with the Gleason score.Citation9 These reports and our results here suggest that GAK functions in the regulation of proper M phase progression, in addition to cytoplasmic membrane trafficking. Thus, overexpression of GAK in cancer cells may cause an abnormality in M phase regulation, thereby leading to uncontrolled cell growth, a typical phenotype of cancer cells. Because wild-type Src is weakly oncogenic and its cancer-specific mutations are rare, the role of Src in the progression of human cancer remains unknown.Citation31 Our results also suggest a novel role of c-Src as a proto-oncogene, namely, overexpression of c-Src promotes phosphorylation of GAK, which may cause aberrant M phase control, thereby leading to uncontrolled growth of cancer cells. Taken together, the c-Src_GAK_MCM axis plays an important role in cell cycle progression through DNA replication licensing.
Materials and methods
Cell culture and preparation of Tet-ON advanced cells
U2OS and HeLa S3 cells, purchased from the American Type Culture Collection, were maintained in Dulbecco's Modified Eagle's Medium (DMEM; Sigma-Aldrich, D5796) supplemented with 10% fetal bovine serum (FBS; HyClone, SV30014.03), 100 U/mL penicillin, and 100 μg/mL streptomycin (Nacalai Tesque, #26253-84). For preparation of Dox-inducible U2OS and HeLa S3 advanced cells, the pTet-On advanced plasmid vector (Clontech) was transfected and cells were incubated in DMEM supplemented with 10% FBS, penicillin/streptomycin, and 0.8 mg/mL G418. From these cultures, several single colonies were selected for preparation of Tet-ON inducible cell lines. For culture of pTet-On advanced cells, 0.8 mg/mL G418 Disulfate Aqueous Solution (Nacalai Tesque, #16513–26) was added to the medium.
Antibodies
Antibodies raised against the following proteins were purchased from the indicated commercial sources: monoclonal antibodies against α-tubulin and γ-tubulin (Sigma-Aldrich), GAPDH (MBL), Myc and GST (MBL), Aurora-A (CST), and c-Src (Millipore); and polyclonal antibodies against Aurora-B (Abcam), c-Src (CST), cyclin B1 and cyclin A (Santa Cruz Biotechnology), Aurora-A and RPA70 (CST), and Myc (MBL). A monoclonal antibody against GAK (9–10) was generated in our laboratory.Citation3 GAK-pY412 (DLDISpYITSR) and GAK-pY1149 (TQPRPNpYASNFSVI) was made by EzBiolab and Genscript. MCM2, MCM3 and ORC2Citation25 were made by MBL.
Dot blot and Wb analyses
For dot blot analysis, antigenic peptides were loaded onto PVDF Immobilon-P transfer membrane (Millipore). For Wb analysis, cells were lysed in TNE250 buffer or RIPA buffer (50 mM Tris-HCl [pH 7.5], 150 mM NaCl, 1 mM EDTA, 1% NP-40, and 0.25% sodium deoxycholate) including protease inhibitors (1 mM PMSF, 10 μg/mL leupeptin, 1 μg/mL aprotinin, 1 μg/mL pepstatin A, 1 mM DTT, 1 mM NaF, 1 mM Na3VO4, 10 mM β-glycerophosphate, and 100 ng/mL okadaic acid) at 4°C for 30 min. Following centrifugation (4°C, 15,000 rpm, 30 min), the supernatant was collected and the protein concentration was determined by the Bradford method. The supernatant was mixed with sample buffer (0.4 M Tris-HCl [pH 6.8], 20% glycerol, 8% SDS, 10% 2-mercaptoethanol, and 0.2% bromophenol blue) and boiled. After SDS-PAGE, proteins were transfer to PVDF membrane (Millipore). Blocking was performed with TBST (100 mM Tris-Cl [pH 7.5], 150 mM NaCl, and 0.05% Tween-20) containing 5% nonfat skimmed milk or 5% bovine serum albumin. Antibody specific dots or bands were visualized by Lightning Chemiluminescence Reagent Plus (Perkin-Elmer).
Preparation of Tet-ON inducible cell lines
The pTRET3-6Myc vector was constructed by inserting a multiple cloning site linker containing the 6Myc-tag (BamHI-HindIII-ClaI-6Myc-AscI-EcoRV-NotI-SalI) into the BamHI and SalI sites of the pTRE-Tight vector (Clontech). U2OS/Tet-ON cells were co-transfected with pTRET3-6Myc plasmids (Myc-vector, GAK-WT, GAK-Y412F, or GAK-Y412D). HeLa S3/Tet-ON cells were also co-transfected with pTRET3-6Myc plasmids (Myc-vector, GAK-WT, GAK-Y1149F, or GAK-Y1149D). Then, a linear hygromycin marker (Clontech) was transfected using Lipofectamine and PLUS reagents according to the manufacturer's instructions (Invitrogen). Transfected cells were diluted and selected with selection medium including hygromycin (200 μg/mL). Single colonies were picked and positive clones were identified by Wb analysis after incubation for 48 h in the presence or absence of Dox (1 μg/mL).
RNA interference
siRNAs against GAK (GAT GTG CGG TTG TTC CTG GdTdT for Ki9 sense and CCA GGA ACA ACC GCA CAU CdTdT for Ki9 antisense) were chemically synthesized (Gene Design). Knockdown of GL2 (negative control) and GAK in HeLa S3 cells was carried out in a tissue culture dish using Lipofectamine 2000 Reagent according to the manufacturer's protocol (Invitrogen). The cells were collected and lysed at 48 h after transfection.
Disclosure of potential conflicts of interest
No potential conflicts of interest were disclosed.
Author contributions
K.F., M.W., Y.N., T.S., S.M., Y.K. and N.Y. performed the cell culture, immunostaining, and Wb analyses. K.F. and Y.N. determined the phosphorylation site of GAK by c-Src and performed other phosphorylation-related experiments. S.M. and K.F. isolated the Tet-ON inducible cell lines. K.F. and Y.K. performed flow cytometry. M.W. and K.F. performed the RPA70 assay, the EdU assay, and IF experiments. M.W. and T.U. performed the cell growth experiments. N.Y., S.M., and H.N. conceived the experimental design. H.N. wrote the manuscript. All authors read and approved the final manuscript.
Supplementary files
Download PDF (2.5 MB)Acknowledgments
We thank Dr. Christopher Patil of Bioedit Ltd. for critically reading this manuscript. We also thank Mr. Yusuke Yabuno for technical assistance.
Funding
This work was supported in part by Grants-in-aid for Scientific Research S (No. 15101006), Scientific Research B (No. 20370081 and 23370086), and Exploratory Research (No. 21651085) to H.N. from the Ministry of Education, Culture, Sports, Science, and Technology of Japan.
References
- Kanaoka Y, Kimura SH, Okazaki I, Ikeda M, Nojima H. GAK: a cyclin G associated kinase contains a tensin/auxilin-like domain. FEBS Lett 1997; 402:73-80; PMID:9013862; http://dx.doi.org/10.1016/S0014-5793(96)01484-6
- Kirchhausen T, Owen D, Harrison SC. Molecular structure, function, and dynamics of clathrin-mediated membrane traffic. Cold Spring Harb Perspect Biol 2014; 6:a016725; PMID:24789820; http://dx.doi.org/10.1101/cshperspect.a016725
- Sato J, Shimizu H, Kasama T, Yabuta N, Nojima H. GAK, a regulator of clathrin-mediated membrane trafficking, localizes not only in the cytoplasm but also in the nucleus. Genes Cells 2009; 14:627-41; PMID:19371378; http://dx.doi.org/10.1111/j.1365-2443.2009.01296.x
- Ray MR, Wafa LA, Cheng H, Snoek R, Fazli L, Gleave M, Rennie PS. Cyclin G-associated kinase: A novel androgen receptor-interacting transcriptional coactivator that is overexpressed in hormone refractory prostate cancer. Int J Cancer 2006; 118:1108-19; PMID:16161052; http://dx.doi.org/10.1002/ijc.21469
- Shimizu H, Nagamori I, Yabuta N, Nojima H. GAK, a regulator of clathrin-mediated membrane traffic, also controls centrosome integrity and chromosome congression. J Cell Sci 2009; 122:3145-52; PMID:19654208; http://dx.doi.org/10.1242/jcs.052795
- Lee DW, Zhao X, Yim YI, Eisenberg E, Greene LE. Essential role of cyclin-G-associated kinase (Auxilin-2) in developing and mature mice. Mol Biol Cell 2008; 19:2766-76; PMID:18434600; http://dx.doi.org/10.1091/mbc.E07-11-1115
- Olszewski MB, Chandris P, Park BC, Eisenberg E, Greene LE. Disruption of clathrin-mediated trafficking causes centrosome overduplication and senescence. Traffic 2014; 15:60-77; PMID:24138026; http://dx.doi.org/10.1111/tra.12132
- Tabara H, Naito Y, Ito A, Katsuma A, Sakurai MA, Ohno S, Shimizu H, Yabuta N, Nojima H. Neonatal lethality in knockout mice expressing the kinase-dead form of the gefitinib target GAK is caused by pulmonary dysfunction. PLoS One 2011; 6(10):e26034; PMID:22022498; http://dx.doi.org/10.1371/journal.pone.0026034
- Sakurai MA, Ozaki Y, Okuzaki D, Naito Y, Sasakura T, Okamoto A, Tabara H, Inoue T, Hagiyama M, Ito A, et al. Gefitinib and luteolin cause growth arrest of human prostate cancer PC-3 cells via inhibition of cyclin G-associated kinase and induction of miR-630. PLoS One 2014; 9:e100124. eCollection 2014; PMID:24971999; http://dx.doi.org/10.1371/journal.pone.0100124
- Susa M, Choy E, Liu X, Schwab J, Hornicek FJ, Mankin H, Duan Z. Cyclin G-associated kinase is necessary for osteosarcoma cell proliferation and receptor trafficking. Mol Cancer Ther 2010; 9:3342-50; PMID:20881269; http://dx.doi.org/10.1158/1535-7163.MCT-10-0637
- Park BC, Yim YI, Zhao X, Olszewski MB, Eisenberg E, Greene LE. The clathrin-binding and J-domains of GAK support the uncoating and chaperoning of clathrin by Hsc70 in the brain. J Cell Sci 2015; 128:3811-21; PMID:26345367; http://dx.doi.org/10.1242/jcs.171058
- Bromann PA, Korkaya H, Courtneidge SA. The interplay between Src family kinases and receptor tyrosine kinases. Oncogene 2004; 23:7957-68; PMID:15489913; http://dx.doi.org/10.1038/sj.onc.1208079
- Colello D, Reverte CG, Ward R, Jones CW, Magidson V, Khodjakov A, LaFlamme SE. Androgen and Src signaling regulate centrosome activity. J Cell Sci 2010; 123:2094-102; PMID:20501699; http://dx.doi.org/10.1242/jcs.057505
- Wheeler DL, Iida M, Dunn EF. The role of Src in solid tumors. Oncologist 2009; 14:667-78; PMID:19581523; http://dx.doi.org/10.1634/theoncologist.2009-0009
- Morgan DO, Kaplan JM, Bishop JM, Varmus HE. Mitosis-specific phosphorylation of p60c-src by p34cdc2-associated protein kinase. Cell 1989; 57:775-86; PMID:2470513; http://dx.doi.org/10.1016/0092-8674(89)90792-7
- Roche S, Fumagalli S, Courtneidge SA. Requirement for Src family protein tyrosine kinases in G2 for fibroblast cell division. Science 1995; 269:1567-9; PMID:7545311; http://dx.doi.org/10.1126/science.7545311
- Nakayama Y, Matsui Y, Takeda Y, Okamoto M, Abe K, Fukumoto Y, Yamaguchi N. c-Src but not Fyn promotes proper spindle orientation in early prometaphase. J Biol Chem 2012; 287:24905-15; PMID:22689581; http://dx.doi.org/10.1074/jbc.M112.341578
- Mahankali M, Henkels KM, Speranza F, Gomez-Cambronero J. A non-mitotic role for Aurora kinase A as a direct activator of cell migration upon interaction with PLD, FAK and Src. J Cell Sci 2015; 128:516-26; PMID:25501815; http://dx.doi.org/10.1242/jcs.157339
- Blow JJ, Dutta A. Preventing re-replication of chromosomal DNA. Nat Rev Mol Cell Biol 2005; 6:476-86; PMID:15928711; http://dx.doi.org/10.1038/nrm1663
- Hills SA, Diffley JF. DNA replication and oncogene-induced replicative stress. Curr Biol 2014; 24:R435-44; PMID:24845676; http://dx.doi.org/10.1016/j.cub.2014.04.012
- Evrin C, Clarke P, Zech J, Lurz R, Sun J, Uhle S, Li H, Stillman B, Speck C. A double-hexameric MCM2-7 complex is loaded onto origin DNA during licensing of eukaryotic DNA replication. Proc Natl Acad Sci U S A 2009; 106:20240-5; PMID:19910535; http://dx.doi.org/10.1073/pnas.0911500106
- Fernández-Cid A, Riera A, Tognetti S, Herrera MC, Samel S, Evrin C, Winkler C, Gardenal E, Uhle S, Speck C. An ORC/Cdc6/MCM2-7 complex is formed in a multistep reaction to serve as a platform for MCM double-hexamer assembly. Mol Cell 2013; 50:577-88; PMID:Can't; http://dx.doi.org/10.1016/j.molcel.2013.03.026
- Fragkos M, Ganier O, Coulombe P, Méchali M. DNA replication origin activation in space and time. Nat Rev Mol Cell Biol 2015; 16:360-74; PMID:25999062; http://dx.doi.org/10.1038/nrm4002
- Remus D, Beuron F, Tolun G, Griffith JD, Morris EP, Diffley JF. Concerted loading of Mcm2-7 double hexamers around DNA during DNA replication origin licensing. Cell 2009; 139:719-30; PMID:19896182; http://dx.doi.org/10.1016/j.cell.2009.10.015
- Samel SA, Fernández-Cid A, Sun J, Riera A, Tognetti S, Herrera MC, Li H, Speck C. A unique DNA entry gate serves for regulated loading of the eukaryotic replicative helicase MCM2-7 onto DNA. Genes Dev 2014; 28:1653-66; PMID:25085418; http://dx.doi.org/10.1101/gad.242404.114
- Knockleby J, Lee H. Same partners, different dance: involvement of DNA replication proteins in centrosome regulation. Cell Cycle 2010; 9:4487-91; PMID:21088489; http://dx.doi.org/10.4161/cc.9.22.14047
- Stuermer A, Hoehn K, Faul T, Auth T, Brand N, Kneissl M, Pütter V, Grummt F. Mouse pre-replicative complex proteins colocalise and interact with the centrosome. Eur J Cell Biol 2007; 86:37-50; PMID:17157410; http://dx.doi.org/10.1016/j.ejcb.2006.09.002
- Kalaszczynska I, Geng Y, Iino T, Mizuno S, Choi Y, Kondratiuk I, Silver DP, Wolgemuth DJ, Akashi K, Sicinski P. Cyclin A is redundant in fibroblasts but essential in hematopoietic and embryonic stem cells. Cell 2009; 138:352-65; PMID:19592082; http://dx.doi.org/10.1016/j.cell.2009.04.062
- Ferguson RL, Pascreau G, Maller JL. The cyclin A centrosomal localization sequence recruits MCM5 and Orc1 to regulate centrosome reduplication. J Cell Sci 2010; 123:2743-9; PMID:20663915; http://dx.doi.org/10.1242/jcs.073098
- Barretta ML, Spano D, D'Ambrosio C, Cervigni RI, Scaloni A, Corda D, Colanzi A. Aurora-A recruitment and centrosomal maturation are regulated by a Golgi-activated pool of Src during G2. Nat Commun 2016; 7:11727; PMID:27242098; http://dx.doi.org/10.1038/ncomms11727
- Tsvetkov L, Stern DF. Interaction of chromatin-associated Plk1 and Mcm7. J Biol Chem 2005; 280:11943-7; PMID:15654075; http://dx.doi.org/10.1074/jbc.M413514200
