
ABSTRACT
Glioblastoma (GBM) is a highly aggressive brain cancer with limited therapeutic options. While efforts to identify genes responsible for GBM have revealed mutations and aberrant gene expression associated with distinct types of GBM, patients with GBM are often diagnosed and classified based on MRI features. Therefore, we seek to identify molecular representatives in parallel with MRI classification for group I and group II primary GBM associated with the subventricular zone (SVZ). As group I and II GBM contain stem-like signature, we compared gene expression profiles between these 2 groups of primary GBM and endogenous neural stem progenitor cells to reveal dysregulation of cell cycle, chromatin status, cellular morphogenesis, and signaling pathways in these 2 types of MRI-classified GBM. In the absence of IDH mutation, several genes associated with metabolism are differentially expressed in these subtypes of primary GBM, implicating metabolic reprogramming occurs in tumor microenvironment. Furthermore, histone lysine methyltransferase EZH2 was upregulated while histone lysine demethylases KDM2 and KDM4 were downregulated in both group I and II primary GBM. Lastly, we identified 9 common genes across large data sets of gene expression profiles among MRI-classified group I/II GBM, a large cohort of GBM subtypes from TCGA, and glioma stem cells by unsupervised clustering comparison. These commonly upregulated genes have known functions in cell cycle, centromere assembly, chromosome segregation, and mitotic progression. Our findings highlight altered expression of genes important in chromosome integrity across all GBM, suggesting a common mechanism of disrupted fidelity of chromosome structure in GBM.
Introduction
High-grade gliomas (HGGs) including glioblastoma (GBM) are a devastating adult brain tumor characterized by uncontrolled proliferation, resistance to cell death, robust angiogenesis, and vascular edema. Extensive transcriptome analyses have illustrated molecular candidates of glioblastoma.Citation1-5 Additionally, genomic characterization and mouse modelsCitation5-9 provide an emerging insight into critical networks and pathways central to GBM pathobiology. By mRNA expression profiling and sequencing (single-nucleotide polymorphism, SNP; copy number variants, CNV) of a large cohort of GBM patient samples, The Cancer Genome Atlas (TCGA) Research Network unraveled genomic abnormalities driving tumorigenesis and suggested pathways involving mutations in TP53, RB, and receptor tyrosine kinase responsible for GBM pathogenesis.Citation2 In addition, the TCGA Research Network defined GBM subclasses predominantly by gene expression patterns that include proneural, neural, classical, mesenchymal subtypes.Citation9 Leveraging the TCGA classification further identified mutations and altered expression of EGFR, NF1, and PDGFRA/IDH1 associated with classical, mesenchymal, and proneural subtypes, respectively.Citation9 Of note, these classifications do not account for all the differences in patient outcome and do not routinely influence treatment choices. Moreover, expression patterns at single cell resolution presented intratumoral heterogeneity within GBM subtypes.Citation5 Overall, these comprehensive studies typically concentrate on molecular characteristics of cells constituting GBM without considering tumor location despite studies that suggest anatomic site may reflect differences in tumor biology and potentially cell of origin.Citation10-12 In a clinical setting, initial GBM diagnosis commonly utilizes functional MRI classification of GBM cases. There is thus a potential disparity between GBM subtyping using molecular versus MRI classifications.
MRI is routinely used for standard classification of brain tumor types and has characterized group I GBM and group II GBM associated with a brain region- the subventricular zone (SVZ) adjacent to the lateral ventricle. The SVZ is a known neurogenic niche harboring neural stem and progenitor cells.Citation13 Evidence also highlight that this niche is suspected to be the origin of subtypes of brain tumor.Citation10-12 The intimate relationship between the SVZ and group I GBM/group II GBM supports the hypothesis of cancer arising from stem or progenitor cell population. In line with this hypothesis, previous studies showed that gene expression signature of glioma stem cells (GSCs) resembles those of neural stem cells (NSCs), suggesting GSCs share features with non-neoplastic stem cells.Citation14,15 Yet, up-to-date reports including TCGA classification (http://tcga-data.nci.nih.gov/) and profiling of glioma stem cells do not account for molecular characteristics of MRI-classified SVZ-associated GBM. Using deep RNA-Seq for MRI-classified SVZ-associated group I GBM and group II GBM vs. control specimens, we demonstrated differential expression of cell cycle regulators, metabolic genes, and epigenetic modifiers (i.e. EZH2, KDM) in these SVZ-associated GBM. Our findings reason a potential use of MRI at routine clinical setting for initial prediction of molecular abnormality. Additionally, we sought to interrogate the gene expression signature common across various GBM subclasses (http://tcga-data.nci.nih.gov/),Citation2,9 glioma stem cell profile,Citation14 and the SVZ-associated GBMs.Citation10,16,17 Our analysis across these large data sets identified that 9 genes (PBK, CENPA, KIF15, DEPDC1, CDC6, DLG7, KIF18A, EZH2, HMMR) crucial for cell cycle, centromere assembly, and chromosome segregation were commonly upregulated that highlights a unique mechanism to distinguish GBM from non-neoplastic tissues. Further, the notion that region-specific neural stem and progenitor cells (NSPCs) may give rise to molecularly distinct subtypes of brain tumor upon dysregulation.Citation11,18,19 prompted us to determine the differential gene expression between endogenous undifferentiated SVZ cells and MRI-classified SVZ-associated GBMCitation16 This comparative study is unique as there is no confounding effect by culture-based cell expansion as done in other studies. Importantly, we found that dysregulation of cell cycle, cellular assembly/organization, signaling, and chromatin status in NSPCs potentially changes the cell fate of normal NSPCs. Our findings cast an additional layer of complexity for SVZ-associated GBM, in which the converging zone of aberrant epigenome, metabolome, cell cycle, and signaling pathways could transform the normal stem cell toward cancer-initiating cells that remain to be determined by in vivo models.
Results
MRI-classified SVZ-associated GBM redirects expression signature of endogenous NSPCs
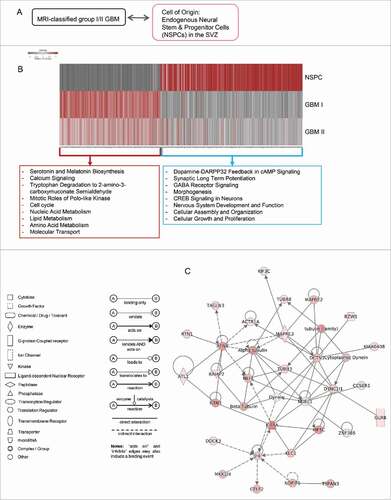
The MRI-characterized group I and group II GBM contact the SVZ intimately and harbor cells expressing markers of neural stem and progenitor cells (NSPCs).Citation10,12 The putative cell of origin hypothesis implicates oncogenesis of GBM as NSPCs losing control of self-renewal and differentiation that necessitate our understanding of the properties of endogenous NSPCs. Currently, most of the genomic studies in neural stem and progenitor cells (NSPCs) are conducted in culture to obtain sufficient materials for analyses. While these studies have been proven invaluable, the in vitro cell culture system cannot fully recapitulate in vivo status of NSPCs because NSPCs constantly interact with niche supports and differential cues from the niche microenvironment can alter chromatin status and gene expression. Yet, obtaining endogenous NSPCs freshly from healthy human brain is ethically unacceptable. To ascertain characteristics of NSPCs as they exist in vivo for gene expression analysis, we purified NSPCs from the non-human primate baboon brain for deep RNA-Seq analysis to reveal gene expression pattern specific in NSPCs.Citation16,17 Using deep RNA-Seq, we had analyzed differential gene expression in MRI-classified group I and group II GBM compared with control specimens. Subsequently, we attempted the comparison of expression profiles between endogenous NSPCs and MRI-classified SVZ-associated GBM (). Our analysis revealed that substantial set of genes are up- or downregulated in GBM while they are either non-detectable or detectable in normal NSPCs, respectively (; Table S1). In contrast to NSPCs, genes with functions in morphogenesis, neuronal activity, signaling, and synaptic function are predominantly downregulated GBM while genes involved in cell cycle as well as lipid and amino acid metabolism are upregulated in these SVZ-associated GBM ( and ).
Figure 1. Differential gene expression between endogenous NSPCs isolated from the SVZ of adult brain and MRI-classified group I/II GBM. (A) Scheme displaying the comparison between group I/II GBM specimens and undifferentiated NSPCs from adult baboon SVZ. (B) Heatmap illustrating baseline gene expression levels in endogenous NSPCs extracted from baboon SVZ (top row) and change in expression of corresponding genes from group I GBM (middle row) and group II GBM (bottom row). Gene expression values (in FPKM) from endogenous NSPCs were converted to log2 values, grouped with associated gene expression values for group I/II GBM specimens, and ordered from lowest to highest before applying cut-offs of log2(NSPC FPKM) ≥ 0 or ≤ −5, log2(fold change GBM I/II) ≥ 1 or ≤ −1. The resulting table was visualized by column-wise scaling. Genes with low expression values in endogenous NSPCs, but increased expression in GBM cases (i.e., fold change GBM compared with control human specimens) were used for input into IPA (red box). Alternatively, genes with detectable expression in NSPCs and associated decreased expression fold changes in GBM were assessed in IPA (blue box). (C) De novo network construction using genes which are detectable in NSPCs and downregulated in group I/II GBM (from blue box in B) using IPA.
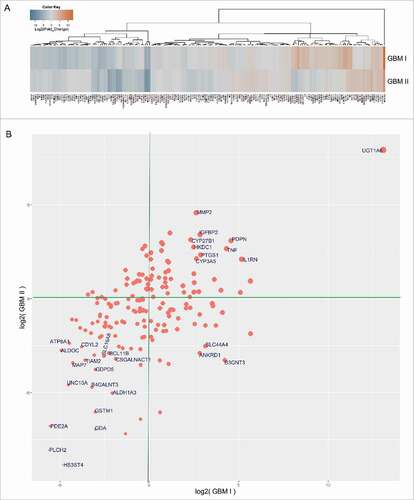
By using unsupervised hierarchical clustering for gene expression data obtained from RNA-Seq, the differential gene expression between MRI-classified group I/II GBM and control specimens was grouped into a distinct cluster, molecular function, and biologic pathways (Table S2). The vast majority of altered expression of genes has function in chromatin regulation (; Table S3), metabolism (; Table S3), morphogenesis, neuronal activity, and signaling. A set of genes related to chromatin regulation is also linked to cell cycle or chromosome segregation (; Table S3). While substantial genes associated with glucose metabolism and ATP production were downregulated, a set of metabolic genes was upregulated that includes UGT1A6 encoding a UDP-glucuronosyltransferase. This is an enzyme of the glucuronidation pathway that transforms small lipophilic molecules (i.e., steroids, bilirubin, hormones, and drugs) into water-soluble metabolites ().
Figure 2. RNA-Seq analysis for MRI-classified group I/group II GBM cases compared with normal brain specimens for genes involved in chromatin activity. Log2-fold change determined by Cuffdiff was applied to analyze the differential gene expression between GBM and controls. Heatmaps (log2-fold) were generated using the function ‘heatmap.3’ within the R program and unsupervised hierarchical clustering using Euclidian distance metric to identify similarities between genes and between samples. (A) Genes involved in chromatin activity or epigenetic regulation are either up- or downregulated in GBM compared with controls. (B) Scatter plot illustrates genes involved in chromatin activity. Points with labels indicate genes with more than 8-fold changes (increase or decrease) in expression level in GBM cases compared with controls. Size of points indicates the sum of the absolute values of GBM gene expression values (i.e., | fold change GBM I | + | fold change GBM II |). X and Y axes represent expression values in units of log2(fold change) for GBM I and GBM II, respectively.
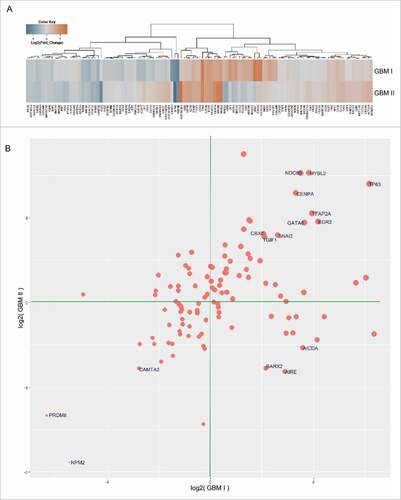
Figure 3. RNA-Seq analysis for MRI-classified group I/group II GBM cases compared with normal brain specimens for genes involved in metabolism. Log2-fold change determined by Cuffdiff was applied to determine the differential gene expression between GBM and controls. Heatmaps (log2-fold) were generated using the function ‘heatmap.3’ within the R program and unsupervised hierarchical clustering using Euclidian distance metric to identify similarities between genes and between samples. (A) Genes involved in metabolism are either up- or downregulated in GBM compared with controls. (B) Scatter plot illustrates genes involved in metabolism. Labeled points indicate genes with more than 8-fold changes (increase or decrease) in expression level in GBM cases compared with controls. Size of points indicates the sum of the absolute values of GBM gene expression values (i.e., | fold change GBM I | + | fold change GBM II |). X and Y axes represent expression values in units of log2(fold change) for GBM I and GBM II, respectively.
MRI-classified SVZ-associated GBM has alteration of epigenetic modifiers in the absence of IDH mutation
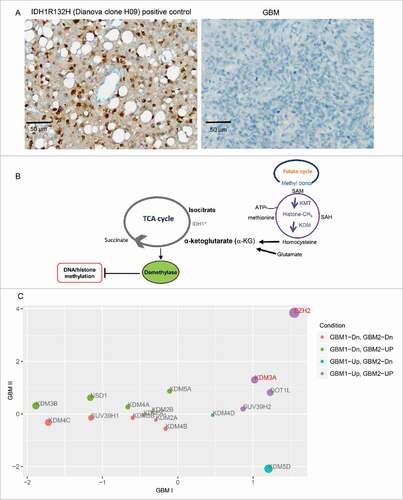
The converging fields of epigenetics and metabolism has received great attention in cancer biology.Citation20,21 For instance, patients with IDH mutation showed hypermethylation of the CpG island and increased histone demethylation.Citation22-24 IDH converts isocitrate to α-ketoglutarate (α-KG) during normal TCA cycle, whereas mutant IDH converts α-KG to D-2-hydroxyglutarate (D-2HG) in an NADPH-dependent manner that has been associated with secondary GBM.Citation22-26 Nonetheless, 4 independent cases of MRI-classified SVZ-associated GBM used in this study do not contain IDH mutation (). As α-KG is a substrate for particular histone and DNA demethylases, changing the levels of α-KG via fluctuation of metabolic influx (i.e., folate or amino acid metabolism) would affect the activity and/or the level of enzymes responsible for specific histone and DNA methylation patterns (). In support of this notion, we found the elevated levels of EZH2 catalyzing H3K27me3 in these subtypes of GBM independent of IDH mutation (). By contrast, the level of KDM2 and KDM4 responsible for H3K36me1/me2 and H3K36me2/me3, respectively are decreased in these SVZ-associated GBM without IDH mutation ().
Figure 4. Altered expression levels of EZH2 and KDM in MRI-classified group I/II GBM independent of IDH mutation. (A) All GBM specimens used in this study are negative for IDH mutation as shown in representative GBM at right panel. (B) In addition to IDH mutation, other metabolic influx from folate cycle or amino acid metabolism can fluctuate the levels of methyltransferases or demethylases. (C) Scatter plot indicating expression fold changes of chromatin modifiers present in gene list common to group I/II GBM. Scale of X- and Y-axes are in units log2(fold change GBM I/II / control). Point colors are grouped by whether differential gene expression increased or decreased in either case of GBM. Size of points is equal to the sum of absolute values of expression values for group I/II GBM (i.e., | fold change GBM I | + | fold change GBM II |). Genes that have values of log2(fold change) ≥ 1 or ≤ −1 in both group I/II GBM are highlighted in red.
To examine whether the level of H3K27me3 is altered in subtypes of GBM, purified histone fractions from normal brain tissues and GBM specimens were analyzed by western blot. We found marginally increased level of H3K27me3 (), thus, globally accumulation of H3K27me3 is not profound in GBM cases compared with controls while the elevation of catalytic unit- EZH2 transcript was detected by RNA-Seq in MRI-classified SVZ-associated GBM. Indeed, our previous work has shown that epigenetic reprogramming by H3K27me3 in heterogeneous populations of MRI-classified SVZ-associated GBM cases acts in gene-specific manner (16). We then examined the abundance of H3K36me3 by western blot analysis of histone fractions and demonstrated that the level of H3K36me3 is higher in GBM compared with normal brain regions (), reasoning that downregulated KDM2 and KDM4 is responsible for the elevation of H3K36me3. Intriguingly, H3K36me3 is also increased in gliosis case, which involves the proliferation or hypertrophy of astrocytes,microglia, and oligodendrocytes in response to damage to the central nervous system (CNS). Whether the levels of KDM2 and KDM4 are affected in reactive change of different types of glial cells remain to be determined.
Figure 5. The abundance of H3K27me3 and H3K36me3 in MRI-classified GBM. (A) Western blot detected slightly elevated levels of H3K27me3 in MRI-classified SVZ-associated group I and group II GBM compared with control regions. (B) The level of H3K36me3 is increased in histone fractions of GBM patients. The unmodified H4 was used for loading control. The comparison was performed using normal brain specimens obtained from temporal, frontal, and parietal lobes. Quantification of enrichment ratio was done by ImageJ software. Enrichment ratio reflects intensity of tumor relative to mean of temporal, frontal, and parietal lobes after normalization to H4 loading control. The MRI-classified group I GBM is associated with both SVZ and cortex (SVZ+ cortex+), group II GBM (SVZ+ cortex−), group III GBM (SVZ− cortex+), group IV GBM (SVZ− cortex−). The gliosis associated with temporal region and gliomas associated with hippocampus were analyzed in parallel.
MRI-classified SVZ-associated GBM has common expression signature correlated with GBM subclasses and GSC
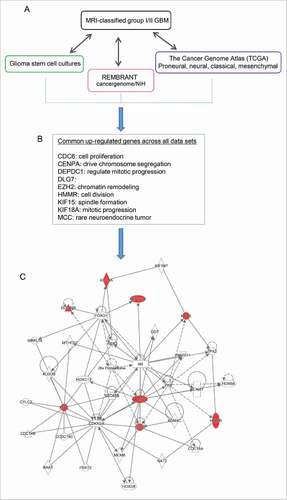
The similarity among glioma stem cells (GSCs) and non-malignant neural stem cells (NSCs) highlights their common stem-like behavior.Citation11 As both MRI-characterized group I and group II GBM cases contain undifferentiated SVZ cell types expressing markers representing neural stem and progenitor cells (NSPCs),Citation12 we hypothesize that these NSPCs may give rise to group I GBM and/or group II GBM upon dysregulation.Citation12 To further explore the correlation among all existing expression data across emerging GBM subtypes, we compared gene expression across MRI-classified SVZ-associated GBM, GSC cultures, as well as large data sets from TCGA (http://tcga-data.nci.nih.gov/),Citation2,9 and REMBRANT database (). Eleven common genes were found to be altered across these data sets. Among these, 9 genes (CDC6, CENPA, DEPDC1, DLG7, HMMR, KIF15, KIF18A, PBK, EZH2) are commonly upregulated in all data sets () whereas LPAR6 and RAPGEF4 are down- and upregulated, respectively, in GSCCitation14 opposing the SVZ-associated GBM subtypes. It is worth noting that EZH2 is upregulated across all data sets, raising the possibility that emerging subtypes of GBM harbor molecular heterogeneity consisting of epigenetic alteration, such as EZH2 and its resulting modification of tri-methylation on histone 3 lysine 27 (H3K27me3). Using Ingenuity Pathway Analysis (IPA), EZH2 is predicted to interact with 6 common upregulated genes in the network of cell cycle and chromosome organization (). In addition, our previous comparative analysis between healthy NSPCs and MRI-characterized group I/II GBM specimens revealed that substantial sets of genes enriched with H3K27me3, catalyzed by EZH2, are altered in the human GBM.Citation17 Furthermore, the deposition of centromeric protein CENPA (a histone H3 variant) are known to be critical for centromere assembly during chromosome segregation at the stage of mitosis and the accurate distribution of genetic materials through cell division depends on the centromere marked by CENPA,Citation27 which is upregulated across GBM cases.
Figure 6. Meta-analysis comparing expression data of MRI-classified GBM I/II with existing large data sets to highlight common genes. (A) Differentially expressed genes common to group I/II GBM specimens derived from the current study were compared with previously published gene lists derived from glioma stem cell cultures, REMBRANT, and The Cancer Genome Atlas (TCGA). (B) Across all data sets, 9 genes were consistently found to be upregulated. Overall, the relative change in expression values in the current group I/II GBM RNA-Seq experiment was largely consistent with up- or downregulation of corresponding genes described previously. (C) The list of genes commonly upregulated across all data sets, including MRI classified group I/II GBM was used for de novo network construction to detect known molecular interactions and infer new biologic functions in the intersect of chromatin remodeling, chromosome segregation, and mitotic progression.
Discussion
The prevailing standard treatment of GBM is surgical resection, radiation, and adjuvant temozolomide (TMZ) chemotherapy targeting DNA methylation of MGMT. Although individual GBM cases likely have different molecular signatures, these patients are typically treated with the same protocol. The inability to define different patient outcomes on the basis of molecular features presents a problem in our understanding of the classification of GBM. Thus, numerous studies have classified subtypes of glioblastoma (GBM) using molecular markers that also correlated with survival rate and recurrent frequency. Among these comprehensive discoveries, the genomic- and genetic based classification of GBM by TCGA lay the groundwork for understanding of GBM molecular signature. GBM manifests heterogeneous cell types within a tumor including a subpopulation regarded as GSCs, which may play a role in de novo initiation of GBM and are thought to be critical in resistance to therapy.Citation28-30 In this regard, the cell types of tumor origin were examined by a study using a combination of gene expression, bioinformatics, and proteomic analyses from numerous GSC cultures, 200 GBM specimens from TCGA database (http://cancergenome.nih.gov/), and 315 GBM/Astrocytoma patients from REMBRANT database (http://cancergenome.nih.gov/) to uncover 20 genes are consistently upregulated in GSC, but are not in non-malignant NSC.Citation14 Extending the studies of TCGA classification and GSC signature, we performed gene expression comparison between a large cohort of these data and MRI-classified SVZ-associated GBM. Strikingly, 9 genes (PBK, CENPA, KIF15, DEPDC1, CDC6, DLG7, KIF18A, EZH2, HMMR) interacted in the same network were commonly altered across these data sets that highlight a unique mechanism crucial for centromere assembly and chromosome segregation to distinguish GBM from non-neoplastic tissues. As the MRI-classified group I/II and TCGA GBM used in this study are newly diagnosed, chromosomal integrity is not altered by radiation or chemotherapy but rather a unique tumor phenotype. We anticipate that this gene list would be meaningful in diagnosis or be further explored as therapeutic targets for clinical application. Furthermore, major progress has been made on the identification of diagnostic and prognostic markers that include the methylation status of methyl guanine methyltransferase (MGMT) and mutations in isocitrate dehydrogenase (IDH1 and IDH2).Citation3,22-26,31,32 during the last decade. These findings provide an integrated view of epigenetics and metabolism in GBM and highlight widespread co-dependency of metabolic and epigenetic events throughout brain tumor evolution. The biologic and clinical relevance of epigenetic dysregulation and intratumoral heterogeneity are becoming more apparent for diagnosis and prediction of patient outcome, in which tumor cells with reversible epigenetic states may drive drug resistance. Therefore, our previous exploration at the forefront of epigenetic heterogeneity in GBM using large-scale and computational approaches presents a high degree of aberrant histone methylation associated with altered gene expression in MRI-classified group I/II GBMCitation16,17 It is worth mentioning that these SVZ-associated group I/II GBM do not harbor mutated IDH, suggesting EZH2/H3K27me3-related network hubs are independent of IDH mutation. Lastly, emerging evidence supports the notion that brain tumors arise from cells with stem and progenitor properties. Even histologically similar tumors from different brain regions have distinct molecular signature, implicating an interaction between the cell of origin and the tumor microenvironment.Citation11 As MRI-classified group I/II GBM are associated with the SVZ niche, there is a compelling need to further explore the niche microenvironment as therapeutic target. In conclusion, our work provides molecular signatures common across GBM that would be of interest to those working on disease mechanism underlying this dynamic brain tumor.
Methods
All specimens used in this study were non-identified human specimens (no patient identifiers). Human GBM specimens were obtained from UCSF Brain Tumor Research Center Tumor Bank, and the controls of correlated human brain regions were purchased from the Cooperative Human Tissue Network (CHTN), an NCI-supported resource. All methods were performed in accordance with relevant guidelines and regulations approved by IRB before initiating these studies. All experimental protocols were approved by EH&S and biosafety committees of the University of Texas at San Antonio and the University of California at San Francisco.
IDH mutation detection
The GBM specimens used in this study were examined for IDH mutation along with control. Immunohistochemistry with antibody anti-IDH1R132H (Dianova, DIA H09; 1:50) was performed on the Ventana Medical Systems Benchmark XT.
Comparison of gene expression between endogenous NSPCs and GBM
For RNA-Seq, we had sample sets for baboon SVZ cells (n = 3), primary GBMI (n = 2), primary GBMII (n = 2), and control region specimens (n = 3) to obtain at least 300 million pass-filtered reads for each sample set. Briefly, total RNA was extracted from snap frozen GBM specimens and sequencing libraries were generated with Illumina Tru-Seq stranded total RNA library prep kit (Illumina; RS-122–2301; RS-122–2302). RNA libraries were deep sequenced using paired-end sequencing, (2 × 36 bp, >350 million reads) on an Illumina HiSeq2500 sequencer. Pass filtered reads (average = 325 million reads) from individual flow cells were aligned to hg38. DESeq was used to normalize raw read counts and Cufflink reported read counts and estimated FPKM (fragments per kilobase of exon per million fragments mapped; http://cufflinks.cbcb.umd.edu/faq.html#fpkm). Genes with expression values >1 FPKM were considered for subsequent analyses. For GBM, Cuffdiff was applied to analyze the differential gene expression between GBM and control specimens. The summarized detectable genes in baboon NSPCs (NIH/GEO accession ID GSE#58531) and up- or downregulated genes in GBM are common across independent samples after standard pipeline of RNA-Seq analysis (Cufflink and Cuffdiff). For comparison, the expression profile of endogenous baboon NSPCs has been described previously using in vivo purification followed by deep RNA-Seq.Citation16 Baboon NSPC RNA-Seq FPKM values were log2 transformed before merging with expression values of genes common to GBM I and GBM II. The merged table contained log2 transformed FPKM values (from NSPCs) and log2 fold-change values (from GBM I and GBM II). To visualize any trends in expression profiles, the merged table was further filtered by performing the following steps: only genes in baboon with log2 (FPKM) value of either ≥ 0 or < −5 (corresponding to NSPC FPKM values of ≥ 1 or < 3.125×10⁻², respectively) and a log2 (fold change) of either ≥ 1 or ≤ 1 (corresponding to GBM expression fold changes of ≥ 2 or ≤ 2, respectively) were retained for visualization. The resulting final, filtered table of log2 values was used as input for heatmap.3 function in R (https://github.com/obigriffith/biostar-tutorials/blob/master/Heatmaps/heatmap.3.R).
Western blot analyses
Histone fractions from human snap-frozen GBM specimens and control brain tissues were purified by histone purification kit (Active Motif # 40025). Protein concentrations were quantified using the Bradford protein assay (Bio-Rad #500–0001). For western blots, equal amounts of protein from histone fraction were denatured in final 1X SDS stop buffer, subjected to gradient 4–12% SDS-PAGE, and transferred to PVDF membranes. Immunoblotting was performed with antibody against H3K27me3 (Upstate #07–449, 1:2000), H3K36me3 (Abcam 9050), or H4 (Abcam 13843). Subsequently, HRP-conjugated secondary IgG (Cell Signaling #70745; 1:5000) and an enhanced chemiluminescence kit (ECL plus; GE#RPN2232) were used for detection. Image J program was used for quantification. After normalization to H4 loading control for each sample, the average of intensity (mean) from temporal, frontal, and parietal lobes was used to compare the intensity of GBM samples. For H3K27me3: (GBMI H3K27me3 / GBM H4) / (Σ [(Temporal H3K27me3 / Temporal H4), (Frontal H3K27me3 / Frontal H4), (Parietal H3K27me3 / Parietal H4)] / 3); For H3K36me3 (GBMI H3K36me3 / GBM H4) / (Σ [(Temporal H3K36me3 / Temporal H4), (Frontal H3K36me3 / Frontal H4), (Parietal H3K36me3 / Parietal H4)] / 3).
Comparison of MRI-characterized group I/group II GBM and TCGA GBM subclasses
RNA-Seq data for MRI-characterized group I GBM (GBM I) and MRI-characterized group II GBM (GBM II) has been deposited to NCBI/GEO. All heatmap analyses were completed in the R environment (https://cran.r-project.org/). Expression sets for GBM I and GBM II were joined into a single table of expression databased on gene symbol. TCGA classification of GBM subclasses defined a predictive list of 840 genes which were clustered using a core set of 173 TCGA GBM samples (http://tcga-data.nci.nih.gov/)Citation2,9. The expression clusters of these 840 genes for each GBM subtype were then merged with the table containing gene expression values common to GBM I and GBM II cases by gene symbol.
Comparison between MRI-characterized group I and group II GBM and GSC signatures
To compare data between GBM I and GBM II expression profiles and GSC signatures, expression sets for GBM I and GBM II were joined into a single table by gene symbol. Genes symbols common to both GBM I and GBM II were then compared with 20 genes comprising a GSC signature.Citation14 Among the 5 genes described in the GSC reference gene list with multiple synonymous gene symbols (i.e., PBK/TOPK, DLG7/DLGAP5/HURP, HMMR/RHAMM/CD168, ATXN7L4/ATXN7L1, P2RY5/LPAR6), at most a single synonymous gene id was detected in the data set for genes common to GBM I and GBM II (i.e., HMMR was detected in genes common to GBM I and GBM II, but RHAMM and CD168 were not). Manual curation of genes common to GBM I, GBM II, and GSC signature ensured accuracy of gene comparisons. After determining genes common to all GBM and GSC states, expression levels were assessed.
GO, network, and pathway analysis
Molecular Functions and Biological Pathways were constructed using Kyoto Encyclopedia of Genes and Genomes (KEGG). Network analysis was performed using Ingenuity Pathway Analysis (IPA) (Ingenuity® Systems, Redwood City, CA, USA). Network analysis inferred de novo interaction networks between input genes (termed focus loci) and a repository of biologic and chemical interactions called the Ingenuity Knowledge Base (IKB). Focus loci are combined into networks that maximize their interconnectedness with each other relative to all molecules they are connected to in the IKB. Scoring of networks is calculated by the right-tailed Fisher's exact test using a hypergeometric distribution. The higher a network score, the lower probability of observing the number of focus loci in a given network by chance.
Disclosure of potential conflicts of interest
No potential conflicts of interest were disclosed.
Author contributions
Conception/design, histone purification, RNA-Seq, material support, manuscript writing: C.A. Lin. Acquisition of data, biostatistics, constructing databases, computational analysis across large data sets: C.T. Rhodes and C.W. Lin. Acquired and managed specimens, technical support of immunohistochemistry: J. J. Phillips. Administrative facility and material support, study supervision, manuscript preparation: M.S. Berger.
1295186_Supplemental_Material.zip
Download Zip (110.4 KB)Acknowledgments
We acknowledge the UCSF, Department of Neurological Surgery, Brain Tumor SPORE Tissue Bank (P50 CA097257) as the resource for the human specimens and immunostaining. We thank technical support from Angela Huang. Sequencing was performed at the High Throughput Genomics Center in the Department of Genome Sciences, University of Washington, Seattle, WA.
Funding
This project is supported by the SPORE grant 5 P50 CA097257–13 to MSB, as well as the SCORE grant SC3GM112543 from the National Institutes of Health and TRAC award to CAL.
Related Research Data
References
- Beroukhim R, Getz G, Nghiemphu L, Barretina J, Hsueh T, Linhart D, Vivanco I, Lee JC, Huang JH, Alexander S, et al. Assessing the significance of chromosomal aberrations in cancer: Methodology and application to glioma. Proc Natl Acad Sci USA 2007; 104:20007-12; PMID:18077431; http://dx.doi.org/10.1073/pnas.0710052104
- McLendon R, Friedman A, Bigner D, Van Meir EG, Brat DJ, Mastrogianakis GM, Olson JJ, Mikkelsen T, Lehman N, Aldape K, et al. Comprehensive genomic characterization defines human glioblastoma genes and core pathways. Nature 2008; 455:1061-8; PMID:18772890; http://dx.doi.org/10.1038/nature07385
- Parsons DW, Jones S, Zhang X, Lin JC, Leary RJ, Angenendt P, Mankoo P, Carter H, Siu IM, Gallia GL, et al. An integrated genomic analysis of human glioblastoma multiforme. Science 2008; 321:1807-12; PMID:18772396; http://dx.doi.org/10.1126/science.1164382
- Gunther HS, Schmidt NO, Phillips HS, Kemming D, Kharbanda S, Soriano R, Modrusan Z, Meissner H, Westphal M, Lamszus K. Glioblastoma-derived stem cell-enriched cultures form distinct subgroups according to molecular and phenotypic criteria. Oncogene 2008; 27:2897-909; PMID:18037961; http://dx.doi.org/10.1038/sj.onc.1210949
- Patel AP, Tirosh I, Trombetta JJ, Shalek AK, Gillespie SM, Wakimoto H, Cahill DP, Nahed BV, Curry WT, Martuza RL, et al. Single-cell RNA-seq highlights intratumoral heterogeneity in primary glioblastoma. Science 2014; 344:1396-401; PMID:24925914; http://dx.doi.org/10.1126/science.1254257
- Bachoo RM, Maher EA, Ligon KL, Sharpless NE, Chan SS, You MJ, Tang Y, DeFrances J, Stover E, Weissleder R, et al. Epidermal growth factor receptor and Ink4a/Arf: Convergent mechanisms governing terminal differentiation and transformation along the neural stem cell to astrocyte axis. Cancer Cell 2002; 1:269-77; PMID:12086863; http://dx.doi.org/10.1016/S1535-6108(02)00046-6
- Uhrbom L, Dai C, Celestino JC, Rosenblum MK, Fuller GN, Holland EC. Ink4a-Arf loss cooperates with KRas activation in astrocytes and neural progenitors to generate glioblastomas of various morphologies depending on activated Akt. Cancer Res 2002; 62:5551-8; PMID:12359767
- Phillips HS, Kharbanda S, Chen R, Forrest WF, Soriano RH, Wu TD, Misra A, Nigro JM, Colman H, Soroceanu L, et al. Molecular subclasses of high-grade glioma predict prognosis, delineate a pattern of disease progression, and resemble stages in neurogenesis. Cancer Cell 2006; 9:157-73; PMID:16530701; http://dx.doi.org/10.1016/j.ccr.2006.02.019
- Verhaak RG, Hoadley KA, Purdom E, Wang V, Qi Y, Wilkerson MD, Miller CR, Ding L, Golub T, Mesirov JP, et al. Integrated genomic analysis identifies clinically relevant subtypes of glioblastoma characterized by abnormalities in PDGFRA, IDH1, EGFR, and NF1. Cancer Cell 2010; 17:98-110; PMID:20129251; http://dx.doi.org/10.1016/j.ccr.2009.12.020
- Lim DA, Cha S, Mayo MC, Chen MH, Keles E, VandenBerg S, Berger MS. Relationship of glioblastoma multiforme to neural stem cell regions predicts invasive and multifocal tumor phenotype. Neuro Oncol 2007; 9:424-9; PMID:17622647; http://dx.doi.org/10.1215/15228517-2007-023
- Gilbertson RJ, Gutmann DH. Tumorigenesis in the brain: Location, location, location. Cancer Res 2007; 67:5579-82; PMID:17575119; http://dx.doi.org/10.1158/0008-5472.CAN-07-0760
- Haskins WE, Zablotsky BL, Foret MR, Ihrie RA, Alvarez-Buylla A, Eisenman RN, Berger MS, Lin CH. Molecular characteristics in MRI-classified group 1 glioblastoma multiforme. Front Oncol 2013; 3:182; PMID:23875172; http://dx.doi.org/10.3389/fonc.2013.00182
- Alvarez-Buylla A, Lim DA. For the long run: Maintaining germinal niches in the adult brain. Neuron 2004; 41:683-6; PMID:15003168; http://dx.doi.org/10.1016/S0896-6273(04)00111-4
- Stangeland B, Mughal AA, Grieg Z, Sandberg CJ, Joel M, Nygard S, Meling T, Murrell W, Vik Mo EO, Langmoen IA. Combined expressional analysis, bioinformatics and targeted proteomics identify new potential therapeutic targets in glioblastoma stem cells. Oncotarget 2015; 6:26192-215; PMID:26295306; http://dx.doi.org/10.18632/oncotarget.4613
- Altaner C. Glioblastoma and stem cells. Neoplasma 2008; 55:369-74; PMID:18665745
- Sandstrom RS, Foret MR, Grow DA, Haugen E, Rhodes CT, Cardona AE, Phelix CF, Wang Y, Berger MS, Lin CH. Epigenetic regulation by chromatin activation mark H3K4me3 in primate progenitor cells within adult neurogenic niche. Sci Rep 2014; 4:5371; PMID:24947819; http://dx.doi.org/10.1038/srep05371
- Rhodes CT, Sandstrom RS, Huang SA, Wang Y, Schotta G, Berger MS, Lin CA. Cross-species analyses unravel the complexity of H3K27me3 and H4K20me3 in the context of neural stem progenitor cells. Neuroepigenetics 2016; 6:10-25; PMID:27429906; http://dx.doi.org/10.1016/j.nepig.2016.04.001
- Taylor MD, Poppleton H, Fuller C, Su X, Liu Y, Jensen P, Magdaleno S, Dalton J, Calabrese C, Board J, et al. Radial glia cells are candidate stem cells of ependymoma. Cancer Cell 2005; 8:323-35; PMID:16226707; http://dx.doi.org/10.1016/j.ccr.2005.09.001
- Sharma MK, Mansur DB, Reifenberger G, Perry A, Leonard JR, Aldape KD, Albin MG, Emnett RJ, Loeser S, Watson MA, et al. Distinct genetic signatures among pilocytic astrocytomas relate to their brain region origin. Cancer Res 2007; 67:890-900; PMID:17283119; http://dx.doi.org/10.1158/0008-5472.CAN-06-0973
- Shen H, Laird PW. Interplay between the cancer genome and epigenome. Cell 2013; 153:38-55; PMID:23540689; http://dx.doi.org/10.1016/j.cell.2013.03.008
- Sassone-Corsi P. Physiology. When metabolism and epigenetics converge. Science 2013; 339:148-50; PMID:23307727; http://dx.doi.org/10.1126/science.1233423
- Figueroa ME, Abdel-Wahab O, Lu C, Ward PS, Patel J, Shih A, Li Y, Bhagwat N, Vasanthakumar A, Fernandez HF, et al. Leukemic IDH1 and IDH2 mutations result in a hypermethylation phenotype, disrupt TET2 function, and impair hematopoietic differentiation. Cancer Cell 2010; 18:553-67; PMID:21130701; http://dx.doi.org/10.1016/j.ccr.2010.11.015
- Mazor T, Pankov A, Johnson BE, Hong C, Hamilton EG, Bell RJ, Smirnov IV, Reis GF, Phillips JJ, Barnes MJ, et al. DNA methylation and somatic mutations converge on the cell cycle and define similar evolutionary histories in brain tumors. Cancer Cell 2015; 28:307-17; PMID:26373278; http://dx.doi.org/10.1016/j.ccell.2015.07.012
- Mazor T, Pankov A, Song JS, Costello JF. Intratumoral heterogeneity of the epigenome. Cancer Cell 2016; 29:440-51; PMID:27070699; http://dx.doi.org/10.1016/j.ccell.2016.03.009
- Ward PS, Patel J, Wise DR, Abdel-Wahab O, Bennett BD, Coller HA, Cross JR, Fantin VR, Hedvat CV, Perl AE, et al. The common feature of leukemia-associated IDH1 and IDH2 mutations is a neomorphic enzyme activity converting alpha-ketoglutarate to 2-hydroxyglutarate. Cancer Cell 2010; 17:225-34; PMID:20171147; http://dx.doi.org/10.1016/j.ccr.2010.01.020
- Dang L, White DW, Gross S, Bennett BD, Bittinger MA, Driggers EM, Fantin VR, Jang HG, Jin S, Keenan MC, et al. Cancer-associated IDH1 mutations produce 2-hydroxyglutarate. Nature 2010; 465:966; PMID:20559394; http://dx.doi.org/10.1038/nature09132
- Verdaasdonk JS, Bloom K. Centromeres: Unique chromatin structures that drive chromosome segregation. Nat Rev Mol Cell Biol 2011; 12:320-32; PMID:21508988; http://dx.doi.org/10.1038/nrm3107
- Singh SK, Hawkins C, Clarke ID, Squire JA, Bayani J, Hide T, Henkelman RM, Cusimano MD, Dirks PB. Identification of human brain tumour initiating cells. Nature 2004; 432:396-401; PMID:15549107; http://dx.doi.org/10.1038/nature03128
- Piccirillo SG, Reynolds BA, Zanetti N, Lamorte G, Binda E, Broggi G, Brem H, Olivi A, Dimeco F, Vescovi AL. Bone morphogenetic proteins inhibit the tumorigenic potential of human brain tumour-initiating cells. Nature 2006; 444:761-5; PMID:17151667; http://dx.doi.org/10.1038/nature05349
- Bao S, Wu Q, McLendon RE, Hao Y, Shi Q, Hjelmeland AB, Dewhirst MW, Bigner DD, Rich JN. Glioma stem cells promote radioresistance by preferential activation of the DNA damage response. Nature 2006; 444:756-60; PMID:17051156; http://dx.doi.org/10.1038/nature05236
- Thomas L, Di Stefano AL, Ducray F. Predictive biomarkers in adult gliomas: The present and the future. Curr Opin Oncol 2013; 25:689-94; PMID:24076583; http://dx.doi.org/10.1097/CCO.0000000000000002
- Hegi ME, Diserens AC, Gorlia T, Hamou MF, de Tribolet N, Weller M, Kros JM, Hainfellner JA, Mason W, Mariani L, et al. MGMT gene silencing and benefit from temozolomide in glioblastoma. N Engl J Med 2005; 352:997-1003; PMID:15758010; http://dx.doi.org/10.1056/NEJMoa043331