ABSTRACT
The transcription factor, NFE2-related factor 2 (Nrf2) and autophagy have been implicated in the oxidative-stress response during tumor evolution. However, few studies focus on crosstalk between Nrf2 and autophagy in cancer progression of non-small cell lung cancer (NSCLC). Herein, we evaluated the effect of Nrf2 on autophagy in NSCLC and their role in development of NSCLC. Effect of Nrf2 on overal survival (OS) of NSCLC patients were evaluated. Cell biological behaviors in response to Nrf2 were evaluated by MTT, colony formation assay and flow cytometry. Effect of 3-MA (a classical inhibitor of autophagy) on 95D-Nrf2 cells was also analyzed using flow cytometry. After up/down-regulating Nrf2 in NSCLC cell lines, expression of autophagy-related proteins were evaluated with western blot analysis. The results revealed that Nrf2 was an independent prognositc factor negtively associated with OS of NSCLC patients. Elevated Nrf2 expression promotes NSCLC progression, enhancing the escape of tumor cells from apoptosis in vivo and in vitro. Double staining with Annexin V-APC and 7-AAD showed that the proportions of apoptotic cells in 95D-Nrf2 cells were gradually increased after the addition of 3-MA. Importently, Nrf2 induced autophagosome formation and enhanced autophagic activity, which subsequently inhibits NSCLC cell apoptosis. In conclusion, our present study demonstrates that Nrf2 promotes progression of non-small cell lung cancer through activating autophagy. It provides novel insights into Nrf2-mediated of cell proliferation in NSCLC and may facilitate therapeutic development against NSCLC.
Introduction
It has been previously reported that lung cancer has a highest incidence and mortality rate of all cancers in China.Citation1 Among lung cancers, non-small cell lung cancer (NSCLC) is the most common type and is characterized by a low sensitivity to chemotherapy compared with small-cell carcinomas.Citation2 Although advancements have been made in the treatment options for lung cancer patients, especially in molecular targeting therapy, the overall survival of patients with NSCLC has not been greatly improved.Citation2 Therefore, it is necessary to identify factors involved in advanced NSCLC carcinoma progression.
Reactive oxygen species (ROS) have been implicated in lung cancer carcinogenesis.Citation3 Excessive ROS induces oxidative damage to proteins, nucleic acids, lipids and other bioactive molecules, altering their normal function.Citation4,5 The transcription factor, NFE2-related factor 2 (Nrf2), plays an irreplaceable role in the cellular adaptive response to stress.Citation6 Owing to its role in protecting cells from ROS-induced cytotoxicity, Nrf2 signaling plays an important role in chemoprevention of diseases, and in the regulation of a variety of cellular functions. However, recent evidence suggests that the activation of the Nrf2 pathway might not be beneficial in all cancer types and stages.Citation7 In addition, mutations in Nrf2 are common in cancer cells, which could help them to survive and might be associated with poor survival.Citation8 Moreover, studies have demonstrated that Nrf2 can function as a proto-oncogene in many solid tumors.Citation9
During oxidative stress, when the amount of ROS exceeds the capacity of the antioxidant machinery, proteins, lipids, and DNA are oxidized, and autophagy is induced.Citation10 Autophagy may maintain homeostasis and support cancer progression by helping cells to survive in stressful environments through the degradative function of lysosomes to selectively remove damaged, surplus, or aging biological macromolecules and organelles as well as through the continual release some free small molecules for cell recycling.Citation11,12 However, the role of Nrf2 in lung cancer development, and its possible link with the autophagy pathway in NSCLCs remains unknown. Such analysis has the potential to form the basis for rational Nrf2-targeted therapies for NSCLC.
Results
Nrf2 predicts porgnosis of NSLC patients
Expresssion of Nrf2 was determined by immunohistochemistry (IHC). 66.22% (52/80) of NSCLC patients tissue samples had positive expression of Nrf2, and 26.32% (21/80) of matched adjacent tissues had positive expression of Nrf2, respectively (). Compared to cancer adjacent tissues, levels of Nrf2 significantly increased, P = 0.00. Based on the result of IHC, we divided patients into 2 groups (negtive Nfr2 group and postive Nrf2 goup); the characteristics of the 2 groups are shown in .
Table 1. Baseline characteristics of patients.
Then Kaplan–Meier was performed to determine the effect of Nrf2 on prognosis of NSCLC patients. We also analyzed the effect of TNM and tumor size on on prognosis of NSCLC patients because in positive Nrf2 group, they were signifcant different from the negtive Nrf2 group (). Univariate Cox regression analysis demonstrated that Nrf2 (RR, 2.62; 95% CI, 1.56∼4.39), TNM (RR, 4.87; 95% CI, 2.79∼8.5), and tumor size (RR, 5.08; 95% CI, 2.94∼8.79) were significantly associated with overall survival (OS). Later multivariate analysis was performed to identify independent factors, and the results indicated that Nrf2, TNM, and tumor size were independent factors to predict OS in BC patients (, ).
Table 2. Multivariate analysis of factors affecting OS of patients.
Figure 1. Effect of Nrf2 staus, TNM, and tumor size on OS of NSCLC patients. Median survival time (MS) of NSCLC patients with Nrf2 (−) and Nrf2 (+) was 56 months (95% CI, 50.1 to 61.9) and 17 (95% CI, 14.76 to 19.25), respectively, P = 0.01. The MS of patients with TNM I, II and TNM III, IV was 56 months (95% CI, 50.73 to 61.27) and 17 (95% CI, 14.64 to 19.36), respectively, P = 0.00. The MS of patients with advanced TNM tumor size < 5cm and ≥ 5 cm was 43 months (95% CI, 31.43 to 54.57), and 17 (95% CI, 8.38 to 13.62), respectively, P = 0.00.
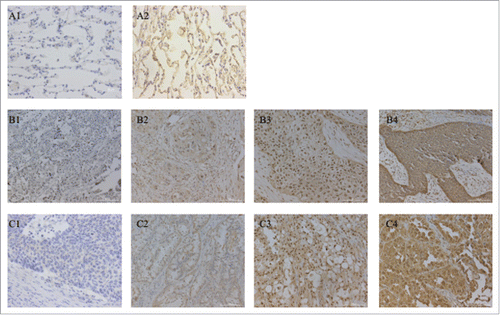
Figure 2. Immunohistochemical staining of Nrf2 protein in NSCLC tissues (magnifcation, x200). Immunohistochemical expression of Nrf2 in paired normal lung tissues (A1-A2), lung adenocarcinoma (C1-C4) and lung squamous cell carcinoma (B1-B4). (B2,C2) weak expression, (B3,C3) moderate expression and (B4,C4) strong expression. Nrf2, NFE2-related factor 2; NSCLC, non-small cell lung cancer.

Expression of Nrf2 in different NSCLC cell lines
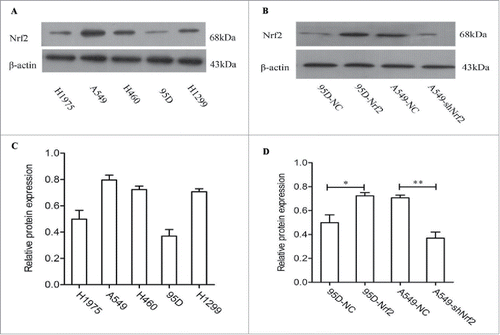
Western blot analysis revealed constitutive Nrf2 expression in all 5 NSCLC cell lines (H1975, A549, H460, 95D and H1299), with lower expression in 95D cells and higher expression in A549 cells (). To investigate the functional role of Nrf2 in NSCLC, we used a lentiviral vector to disrupt Nrf2 expression in A549 cell lines via RNAi and transfected with Nrf2 cDNA to increase its expression in 95D cell lines. Western blot analysis confirmed that the expression of Nrf2 significantly downregulated in A549 cells and overexpressed in 95D cells ( & ).
Figure 3. The expression of Nrf2 in human NSCLC cell lines. (A) The expression of Nrf2 detected by Western blot in different cell lines; (B) Western blot analysis for Nrf2 protein expression in Nrf2 pcDNA-affected 95D and shRNA-transfected A549 NSCLC cells; (C) Quantifcation of the relative expression(Nrf2/β-actin) of Nrf2 in NSCLC cells. (D)Quantifcation of the relative expression(Nrf2/β-actin) of Nrf2 protein in Nrf2 pcDNA-affected 95D and shRNA-transfected A549 NSCLC cells. The data are presented as mean ± SD of 3 independent experiments.The bar graph shows the relative protein expression (Nrf2/β-Actin in each cell line, *, P < 0.05, **, P < 0.01 compared with the control cells).
Nrf2 inhibits cell apoptosis in NSCLC cells
The growth and colony forming ability of A549-shNrf2 cells was decreased compared with that of A549-shNC cells (P < 0.05). In contrast, the cell proliferation and colony forming ability of 95D-Nrf2 cells increased compared with of 95D-NC cells (P < 0.05; & ).
Figure 4. Effects of Nrf2 expression on the proliferation of NSCLC cells in vitro. (A) MTT assay; (B) Colony formation assay. Colonies were counted 14 d later and the number of cells in a colony is more than 50; (C) Cell cycle distribution was analyzed by flow cytometry; (D) Apoptotic and necrotic cells were counted by flow cytometry. Data are presented as mean ± SD of 3 independent experiments. (*, P < 0.05; **, P < 0.01 and ***, P < 0.001 VS.the corressponding control).

In addition, we probed the cell cycle changes through flow cytometry. However, cell cycle distribution had no significant difference in the A549-shNrf2 and 95D-Nrf2 cells compared with the corresponding control cells (). Double staining with Annexin V-APC and 7-AAD showed that the proportion of apoptotic cells in the 95D-NC and 95D-Nrf2 cells was 15.92 ± 0.5% and 11.77 ± 1.2% (P < 0.05); proportion of apoptotic cells in the A549-NC and A549-shNrf2 cells was 3.41 ± 1.4% and 8.54 ± 0.4% (P < 0.01) (), suggesting that Nrf2 promote cell proliferative of NSCLC through inhibiting apoptosis.
Nrf2 promotes growth of NSCLC transplanted tumor
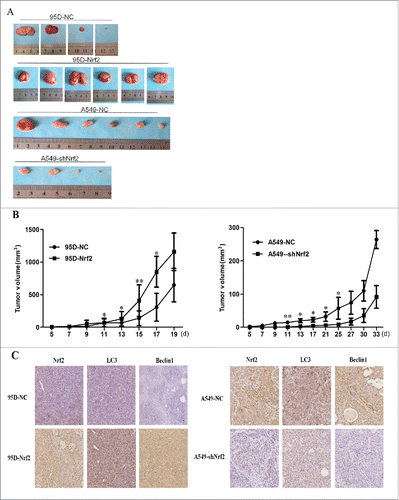
Tumor xenograft models were established to further analyze the activities of Nrf2 in NSCLC. As showed in and , the tumor formation rates were 100% (6/6) in the 95D-Nrf2 and A549-NC groups and 66.7% (4/6) in the 95D-NC and A549-shNrf2 groups, and the tumor volumes in mice with 95D-Nrf2 cells were significantly larger than those in the control group, while tumors in mice with A549-shNrf2 were significantly smaller than those in the control group (P < 0.05).
Figure 5. Activities of Nrf2 in NSCLC cells in tumor xenograft models. (A) Photomicrograph of tumors in the different treatment groups; (B) Tumor growth curve in different groups; (C) Immunohistochemical analysis of Nrf2 and autophagy related genes in tumor xenografts. Nrf2 expression in xenografts resulted in the upregulation of beclin1 and LC3 expression (× 200 magnification). Data are presented as mean ± SD of 3 independent experiments. (*, P < 0.05, **, P < 0.01).
Effects of Nrf2 expression on endogenous ROS levels
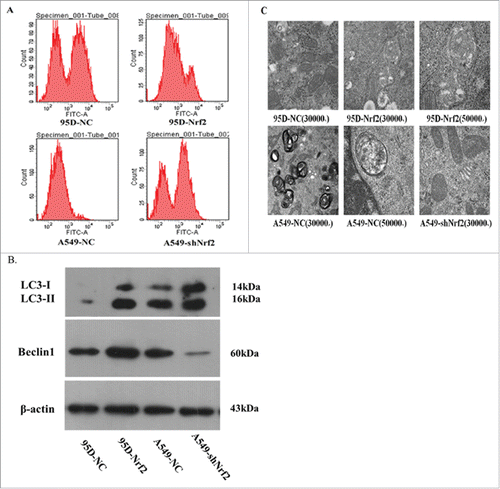
Endogenous ROS levels in NSCLC cells were measured with a DCF-DA probe and flow cytometry. As shown in , the mean intensity of fluorescence in the 95D-NC and 95D-Nrf2 cells was 2625 and 1357, respectively. It was 522 and 1454 in the A549-NC and A549-shNrf2 cells, respectively, suggesting that knockdown of Nrf2 expression increased the generation of ROS. Conversely, upregulation of Nrf2 expression resulted in decreased production of ROS.
Figure 6. Nrf2 promotes autophagy in NSCLC cells. (A) Endogenous ROS levels in NSCLC cell lines with DCF-DA probe. The intensity fluorescence were counted by flow cytumetry, and the mean intensity of fluorescence in the cells with different groups represents endogenous ROS levels in NSCLC cell lines; (B) Western blot analysis of autophagy-related genes; C. Effects of Nrf2 expression on the regulation of the number of autophagosome with TEM. Data are presented as mean ± SD of 3 independent experiments.
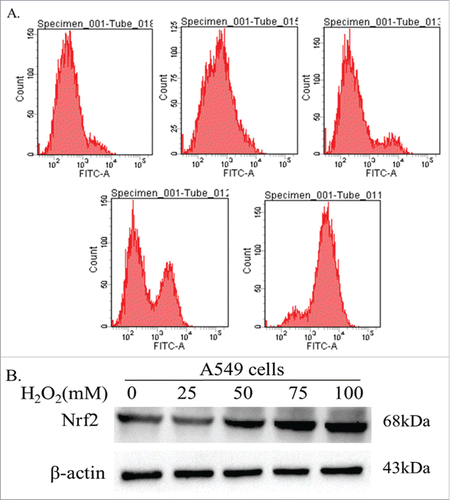
In additional, we also tested the effect of ROS on expression of Nrf-2 by treating A549 cells with serial concetnration of H2O2 (0, 25, 50, 75, 100 μmol/L). A549 cells died after 48 h when treated with 100 μmol/L H2O2. Thus, we choose 24 h as the optimal H2O2 treated time. Flow cytometry was used to detect the intracellular ROS levels in A549 cells (). The results verified that the level of intracellular ROS in cancer cells gradually increased along with high concentration of H2O2. Then the expression of Nrf2 protein was detected by Western blot after treatment A549 cells with H2O2 for 24h. The results showed that the expression of Nrf2 increased after treating with ROS in dose dependent manner ().
Figure 7. Effect of ROS on expression of Nrf2. (A) Flow cytometry verified that the level of intracellular ROS in cancer cells gradually increased along with high concentration of H2O2. (B) After treatment A549 cells with H2O2 for 24h. The results showed that the expression of Nrf2 increased after treating with ROS in dose dependent manner.
Nrf2 regulates autophagy in NSCLC
As shown in , immunohistochemistry analysis showed that tumors derived from 95D-Nrf2 cells had an elevated level of beclin1 and LC3. In contrast, knocking down Nrf2 expression suppressed their expression (). Similarly, in vitro, Nrf2 activated the autophagy. Specifically, knockdown of Nrf2 expression decreased the expression of beclin1 and relative expression of LC3II/LC3I in A549-shNrf2 cells compared with control cells. In contrast, upregulation of Nrf2 expression significantly increased the expression of beclin1 and relative protein expression of LC3II/LC3I in 95D-Nrf2 cells compared with control cells ().
To observe the autophagic behavior more intuitively, we quantified the number of autophagosomes using TEM. The number of autophagosomes in the 95D-Nrf2 cells was greater than that observed in the 95D-NC control cells (). In contrast, the number of autophagosomes in the A549-shNrf2 cells was lower than that in the A549-NC control cells ().
Nrf2 promotes NSCLC cell proliferation by activing autophagy
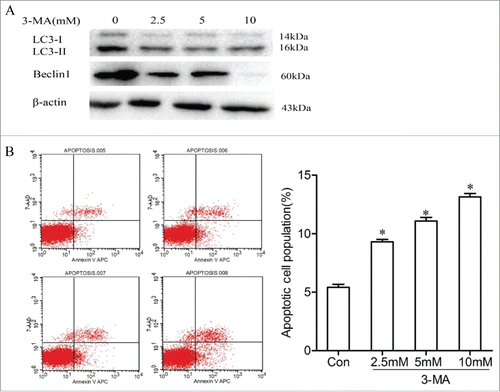
To investigate that if Nrf2 promotes NSCLC cell proliferation by activing autophagy, we selected 3-MA to inhibit autophagy initiation and detected the proportions of apoptotic cells in 95D-Nrf2 cells. We screened the optimal concentration of 3-MA and incubated 95D-Nrf2 cells with different concentrations (0, 2.5, 5, and 10 mM) for 24h, then detected the expressions of autophagy markers such as Beclin-1 and LC3 by Western blot assays. Compared with control cells, 95D-Nrf2 cells incubated with 3-MA had a lower LC3-I, LC3-II and Beclin1 expression (). LC3-II expression was reduced to a greater extent than observed for LC3-I in 95D-Nrf2 cells treated with 10 mM 3-MA. As shown in , double staining with Annexin V-APC and 7-AAD revealed that the proportions of apoptotic cells in 95D-Nrf2 cells were gradually increased after the addition of 3-MA, which suggested that Nrf2 promoted NSCLC cell proliferation by activing autophagy.
Figure 8. Nrf2 promotes NSCLC cell proliferation by activing autophagy. Western blotting for LC3I/II and Beclin1 in 95D-Nrf2 cells treated with 3-MA (0,2.5,5,10 mmol/L); B. Effects of inhibited autophagy on the regulation of the proportions of apoptotic cells in 95D-Nrf2 cells. Apoptosis 005,control (95D-Nrf2 cells untreated with 3-MA); Apoptosis 006,007,008, 95D-Nrf2/3-MA(95D-Nrf2 cells treated with 2.5,5,10 mmol/L 3-MA,respectively). Data are presented as mean ± SD of 3 independent experiments. *, P < 0.05 compared with the control cells.
Discussion
Nrf2 has traditionally been known as a tumor suppressor on account of its role in the cellular defense against exogenous and endogenous insults.Citation13,14 However, several recent studies demonstrate that Nrf2 activation might protect malignant cells against oxidative stress, chemotherapeutic agents, and radiotherapy,Citation8,15-17 thus accounting for evolution of malignant neoplasms. For NSCLC patients, Nrf2 is an independent indicator of a poor survival and acts as an oncogene.Citation18
In this study, we evaluated the effect of Nrf2 on OS of NSCLC patitets and revealed that Nrf2 is an independent prognositc factor. Then we try to find out the poteintial mechnism of Nrf2 related poor prognosis of NSCLC patitets. Oue result showed that upregulated Nrf2 enhanced proliferation and the escape from apoptosis in both vivo and vitro. Whereas, how Nrf2 affects progression of NSCLC remains unknown. In NSCLC, autophagy also contribute to cell survival or cell death.Citation19-21 In some cases, autophagy and apoptosis are highly interconnected, but this relationship has not been well-clarified. Recent studies strongly support the relevance of the interplay between autophagy and apoptosis.Citation22-24 Our result discovered that inhibition of autophagy via 3-MA increased the proportion of apoptotic 95D-Nrf2 cells, meaning that autophagy may potentially involve in Nrf2-associated activities in NSCLC. Then we detected changes of autophagy biomarkers in Nrf2 upregulated or downregulated cell lines, and these autophagy biomarkers dramatically changes in Nrf2 upregulated or downregulated cell lines. The results confirmed Nrf2 regulates progression of NSCLC through activating autophagy. A possible explanation for this result is that Nrf2 itself is able to alter the expression of cell death-related genes, which, in turn, actively participate in NSCLC progression via control of autophagy and apoptosis. Thus, the pivotal molecular mechanism controlling the relationship between apoptosis and autophagy induced by Nrf2 during cancer cell survival should be further explored.
Nrf2 pathway and autophagy are both required to reduce the intracellular ROS accumulation to ensure the survival of NSCLC cells. It has previously been shown that the inhibition of autophagy could ROS accumulation in NSCLC cells.Citation25,26 In contrast to these findings, our results demonstrate that inhibition of autophagy leads to an increase in ROS formation and that downregulation of Nrf2 expression has a significant effect on ROS accumulation in NSCLC cells. Although the level of ROS induced by the suppression of autophagy did not kill the cells per se, this level of ROS was required for the sensitivity of NSCLC cells to apoptosis. Although the involvement of autophagy in the oxidative stress response remains incompletely established, our results suggests that accumulation of ROS is an important mechanism in the sensitization of cells to apoptosis under conditions of suppressed autophagy.
Nevertheless, the specific mechanism of how Nrf2 regulates the malignant behavior of NSCLC cells remains unknown. Therefore, more studies should be performed to reveal the exact mechanisms underlying Nrf2-mediated cancer cell proliferation through the activation of autophagy. These results may provide theoretical support for ongoing clinical investigation of anti-cancer treatments of NSCLC. Thus, suppression of autophagy alters NSCLC cell proliferation, which may be a useful strategy for the treatment of lung carcinomas.
Materials and methods
Patients and samples
A total of 80 patients with NSCLC underwent surgical resection at The First Affiliated Hospital of Xi'an Jiaotong University were recruited in the study between January 2011 and December 2012. They had received no prior radiotherapy or chemotherapy. Cancer and mathed adjacent tissues (5 cm from the tumor margin) specimen were collected from each patient. Histological diagnosis was performed for all the cases by 3 independent, experienced pathologists. This study protocol was approved by the ethics committee of the authors' affiliated institution, the procedures were performed in accordance with the Helsinki Declaration and all specimens were obtained from patients with informed consent.
Cell lines, culture and lentiviral vector transduction
The human NSCLC cell lines, H460, H1975, H1299,95D and A549, were purchased from the American Type Culture Collection (ATCC; Manassas, VA, USA). The cells were cultured in RPMI-1640 or DMEM medium (Hyclone, UT, USA) supplemented with 10% fetal bovine serum (FBS; Transgenomic Co., Shanghai, China) at 37°C in a humidified incubator containing 5% CO2 in air. Cells were replenished daily with fresh medium and were harvested by trypsinization and split at a 1:3 ratio with fresh medium every 2 d.
Cells were seeded in 6-well plates at a density of 6 × 10⁴/mL and cultured in complete medium at 37°C in 5% CO2 overnight. Once the cells reached 10–20% confluence, they were transduced with a lentiviral vector carrying lentiviral vector carrying a synthetic RNA interference (RNAi) targeting Nrf2, pcDNA-Nrf2,si-Nrf2, or vehicle control (Genechem Co., Ltd., Shanghai, China) following the manufacturer's protocol. After 15 d of selection with complete DMEM containing 3 μg/mL puromycin (MP Biomedicals, Solon, OH, USA), discrete clones representing transduced cells were visible. These clones were expanded in the presence of 1 μg/mL puromycin for further analysis.
Western blot analysis
To determine the optimal concentration,95D-Nrf2 cells were incubated with 3-MA of different concentrations (0, 2.5, 5, and 10 mM) for 24h, After treatment, protein lysates of NSCLC cells were prepared for immunoblotting for Nrf2, Beclin1, and LC3 expression. Briefly, the cells were harvested in ice-cold PBS and lysed with RIPA cell lysis buffer containing a protease inhibitor cocktail following the manufacturer's instructions. The protein concentration was determined using the BCA protein assay reagent (Wolsen Co., China). Each protein sample was resolved on sodium dodecyl sulfate polyacrylamide gels (10% or 12%), transferred onto polyvinylidene difluoride membranes (Millipore Corporation, Billerica, MA, USA), and blocked for 2 h at room temperature in 5% non-fat milk to block nonspecific antibody binding. Each membrane was then incubated at 4°C for 12 h with a primary antibody specific for Nrf2 (1:1000; Abcam, Cambridge, UK), Beclin1 (1:1000; Abcam), LC3 (1:800; Sigma, St. Louis, USA), or a mouse monoclonal anti-β-actin antibody (1:10000; Cell Signaling Technology, Danvers, MA, USA). The membranes were then washed with PBST for 30–40 min, and incubated with the secondary antibody (Wolsen Company) at room temperature for 1 h. For the quantification of protein levels, films were scanned and analyzed using Labworks software. Western blots were repeated 3 times for each sample.
Colony formation assay
Once the Stable transfection cells were structured, cells were seeded in 6-well plates at a density of 800 cells/well and cultured in complete medium at 37°C in 5% CO2 for 14 d. Growth medium was refreshed every 3 d. At the end of the experiment, the cells were fixed with methanol for 20 min at room temperature, stained with crystal violet, and manually counted. A group of 50 cells or more was counted as a colony. The colony formation fraction (CFF) was estimated based on the following formula: CFF = number of colonies formed/number of cells seeded. All of the experiments were performed in triplicate.
Cell cycle analysis
The stable transfected NSCLC cell lines were harvested with Trypsin-EDTA and fixed with 70% alcohol overnight. After the cells were washed twice with 5 mL of PBS, they were stained with a propidium iodide (PI) solution (0.05 mg/mL PI and 10 mg/mL RNase A; Sigma). The stained cells were analyzed by flow cytometry using DNA modeling software (FACSCalibur; Becton-Dickinson Biosciences, San Jose, CA, USA).
Cell apoptosis analysis
The stable transfected NSCLC cell lines were harvested with Trypsin-EDTA, washed twice with 5 mL of PBS, and stained with Annexin V-APC /7-AAD (Genechem Co., Ltd., Shanghai, China). The number of apoptotic and necrotic cells after treatment with DMSO or the autophagy inhibitor, 3-MA, was assessed by flow cytometry (FACSCalibur; Becton-Dickinson Biosciences).
Xenograft tumor growth
Male NCr athymic nude mice (5–7 weeks of age) were obtained from Silaike Laboratory Animal Co., Ltd (Shanghai, China). All experimental procedures using these mice were performed in accordance with protocols approved by the Institutional Laboratory Animal Care and the Animal Experiment Administration Committee of Medicine of Xi'an Jiaotong University in Shannxi, China. Each mouse was inoculated subcutaneously in the dorsal flank with 1 × 10⁶ NSCLC cells of 4 different groups (95D-NC,95D-Nrf2, A549-NC and A549-shNrf2) suspended in 0.2 mL of serum-free medium containing 50% Matrigel (BD Biosciences, Bedford, MA, USA). Tumor volumes were measured with vernier calipers and calculated by the following formula: length × width × width × 0.5. When tumors reached 150–200 mm3, they were excised and prepared for immunohistochemical staining of LC3, Beclin1 and Nrf2.
Immunohistochemistry
Immunohistochemistry was performed according to our previous study.Citation27 Antibodies included a rabbit polyclonal anti-Nrf2 antibody at a dilution of 1:50, anti-Beclin1 antibody at a dilution of 1:50, anti-LC3 antibody at a dilution of 1:100, (all from Beijing Biosynthesis Biotechnology, China), which were specific for immunohistochemistry. The negative control sections were incubated with PBS to replace the primary antibody. Three pathologists reviewed the immunostained sections under a light microscope and scored them in 10 randomly selected × 20 power fields. The staining intensity was graded as follows: 0, no staining; 1, weak; 2, moderate; and 3, strong. The percentage of positive cells was scored as follows: 1, <25%; 2, 26–50%; 3, 51–75%; and 4, >76%. These 2 scores were added together, and each tissue sample was categorized into 4 groups: 0, ≤ 5% cells were stained; 1–3, weak expression; 4–5, moderate expression; and 6–7, strong expression. Finally, the number of cells with low-to-weak expression and the number of cells with moderate-to-strong expression were compared statistically.
DCFH-DA probe detecting ROS levels in cells
Cells were seeded in 6-well plates at a density of 1 × 10⁵/well. After 24 h, the cells were trypsinized, washed 2 times with PBS and harvested by centrifugation into 1.5 mL EP tubes. DCFH-DA (Beyotime Institute of Biotechnology, Jiangsu, China) was diluted with serum-free media to a concentration of 10μM and added in the EP tubes. After 30 min at 37°C in 5% CO2, the cells were washed with serum-free media 3 times to remove the excess DCFH-DA. The cells were resuspended in PBS of 1 mL and analyzed using a flow cytometer (FACSCalibur; Becton-Dickinson Biosciences) at an excitation wavelength of 488nm and emission wavelength of 525 nm.
Transmission electron microscopy
A549 and 95D cells were harvested with Trypsin-EDTA, fixed with 2.5% glutaraldehyde solution (Sigma-Aldrich) overnight, postfixed with 1% OsO4, dehydrated in standard graded ethanol, and embedded in 812 resin. Thin sections were sliced and stained with 2% uranyl acetate, then detected with a Hitachi 7650 transmission electron microscope (Hitachi High-Techinternational Trading Co., Shanghai, China). The number of autophagosomes was manually counted.
Cell viability assay
Cell viability was measured based on the formation of blue formazan metabolized from colorless tetrazolium dye 3-(4,5-dimethylthiazol-2-yl)-2,5-diphenyltetrazolium bromide (MTT) by mitochondrial dehydrogenases, which are active only in live cells. Firstly, lung cancer cells were seeded at 3000∼5,000/well in 96–well plates. After 24 h, the cells were incubated with medium containing MTT (0.5 mg/ml in medium) for 4 h at 37˚C. Then MTT was removed, and formazan crystals were reabsorbed in 200 μl of DMSO (Sigma). The absorbance of each well was measured at 490 nm using a microplate spectrophotometer (Dynatech MR5000; BioTek, Guernsey Channel Islands, UK). Three independent series of experiments were performed for the calculation of cell proliferation.
Statistical analysis
Data are expressed as the means ± standard deviation (SD) of at least 3 experiments. Statistically significant differences between groups were determined by the Student's t-test using SPSS 18.0 software. In each case, p < 0.05 was considered to indicate a statistically significant result. All figures shown represent results from at least 2 independent experiments with a similar pattern.
Conclusion
Our findings demonstrated that crosstalk between Nrf2 and autophagy play a pivotal role in cancer progression. Specifically, the Nrf2 inhibits cell apoptosis by enhancing autophagy. Inhibition of autophagy increased cell apoptosis and may represent a potential target against cancer development.
Abbreviations
| Nrf2 | = | nuclear factor erythroid 2-related factor 2 |
| NSCLC | = | non small cell lung carcinoma |
| ROS | = | reactive oxygen species |
Disclosure of potential conflicts of interest
The authors report no conflict of interest.
Funding
This work was supported by the National Natural Science Foundation of China (No. 81101777).
References
- Chen W, Zheng R, Baade PD, Zhang S, Zeng H, Bray F, Jemal A, Yu XQ, He J. Cancer statistics in China, 2015. CA Cancer J Clin 2016; 66:115-32; https://doi.org/10.3322/caac.21338
- Ettinger DS, Wood DE, Akerley W, Bazhenova LA, Borghaei H, Camidge DR, Cheney RT, Chirieac LR, D'Amico TA, Dilling TJ, et al. NCCN Guidelines Insights: Non-Small Cell Lung Cancer, Version 4.2016. J Natl Compr Canc Netw 2016; 14:255-64
- Hackett NR, Heguy A, Harvey BG, O'Connor TP, Luettich K, Flieder DB, Kaplan R, Crystal RG. Variability of antioxidant-related gene expression in the airway epithelium of cigarette smokers. Am J Respir Cell Mol Biol 2003; 29:331-43; PMID:12702543; https://doi.org/10.1165/rcmb.2002-0321OC
- Satoh H, Moriguchi T, Taguchi K, Takai J, Maher JM, Suzuki T, Winnard PT Jr, Raman V, Ebina M, Nukiwa T, et al. Nrf2-deficiency creates a responsive microenvironment for metastasis to the lung. Carcinogenesis 2010; 31:1833-43; PMID:20513672; https://doi.org/10.1093/carcin/bgq105
- Cho HY, Reddy SP, Kleeberger SR. Nrf2 defends the lung from oxidative stress. Antioxid Redox Signal 2006; 8:76-87; https://doi.org/10.1089/ars.2006.8.76
- Ganan-Gomez I, Wei Y, Yang H, Boyano-Adanez MC, Garcia-Manero G. Oncogenic functions of the transcription factor Nrf2. Free Radic Biol Med 2013; 65:750-64; PMID:23820265; https://doi.org/10.1016/j.freeradbiomed.2013.06.041
- Geismann C, Arlt A, Sebens S, Schafer H. Cytoprotection “gone astray:” Nrf2 and its role in cancer. Onco Targets Ther 2014; 7:1497-518; PMID:25210464
- Lister A, Nedjadi T, Kitteringham NR, Campbell F, Costello E, Lloyd B, Copple IM, Williams S, Owen A, Neoptolemos JP, et al. Nrf2 is overexpressed in pancreatic cancer: implications for cell proliferation and therapy. Mol Cancer 2011; 10:37; PMID:21489257; https://doi.org/10.1186/1476-4598-10-37
- Shelton P, Jaiswal AK. The transcription factor NF-E2-related factor 2 (Nrf2): a protooncogene? FASEB J 2013; 27:414-23; PMID:23109674; https://doi.org/10.1096/fj.12-217257
- Li L, Ishdorj G, Gibson SB. Reactive oxygen species regulation of autophagy in cancer: implications for cancer treatment. Free Radic Biol Med 2012; 53:1399-410; https://doi.org/10.1016/j.freeradbiomed.2012.07.011
- Kimmelman AC. The dynamic nature of autophagy in cancer. Genes Dev 2011; 25:1999-2010; https://doi.org/10.1101/gad.17558811
- Yue Z, Jin S, Yang C, Levine AJ, Heintz N. Beclin 1, an autophagy gene essential for early embryonic development, is a haploinsufficient tumor suppressor. Proc Natl Acad Sci U S A 2003; 100:15077-82; PMID:14657337; https://doi.org/10.1073/pnas.2436255100
- Ramos-Gomez M, Kwak MK, Dolan PM, Itoh K, Yamamoto M, Talalay P, Kensler TW. Sensitivity to carcinogenesis is increased and chemoprotective efficacy of enzyme inducers is lost in nrf2 transcription factor-deficient mice. Proc Natl Acad Sci U S A 2001; 98:3410-5; PMID:11248092; https://doi.org/10.1073/pnas.051618798
- Iida K, Itoh K, Kumagai Y, Oyasu R, Hattori K, Kawai K, Shimazui T, Akaza H, Yamamoto M. Nrf2 is essential for the chemopreventive efficacy of oltipraz against urinary bladder carcinogenesis. Cancer Res 2004; 64:6424-31; PMID:15374950; https://doi.org/10.1158/0008-5472.CAN-04-1906
- Konstantinopoulos PA, Spentzos D, Fountzilas E, Francoeur N, Sanisetty S, Grammatikos AP, Hecht JL, Cannistra SA. Keap1 mutations and Nrf2 pathway activation in epithelial ovarian cancer. Cancer Res 2011; 71:5081-9; PMID:21676886; https://doi.org/10.1158/0008-5472.CAN-10-4668
- Manandhar S, Choi BH, Jung KA, Ryoo IG, Song M, Kang SJ, Choi HG, Kim JA, Park PH, Kwak MK. NRF2 inhibition represses ErbB2 signaling in ovarian carcinoma cells: implications for tumor growth retardation and docetaxel sensitivity. Free Radic Biol Med 2012; 52:1773-85; PMID:22387177; https://doi.org/10.1016/j.freeradbiomed.2012.02.031
- Janku F, McConkey DJ, Hong DS, Kurzrock R. Autophagy as a target for anticancer therapy. Nat Rev Clin Oncol 2011; 8:528-39; PMID:21587219; https://doi.org/10.1038/nrclinonc.2011.71
- Shibata T, Saito S, Kokubu A, Suzuki T, Yamamoto M, Hirohashi S. Global downstream pathway analysis reveals a dependence of oncogenic NF-E2-related factor 2 mutation on the mTOR growth signaling pathway. Cancer Res 2010; 70:9095-105; PMID:21062981; https://doi.org/10.1158/0008-5472.CAN-10-0384
- Kuma A, Hatano M, Matsui M, Yamamoto A, Nakaya H, Yoshimori T, Ohsumi Y, Tokuhisa T, Mizushima N. The role of autophagy during the early neonatal starvation period. Nature 2004; 432:1032-6; PMID:15525940; https://doi.org/10.1038/nature03029
- Pua HH, Dzhagalov I, Chuck M, Mizushima N, He YW. A critical role for the autophagy gene Atg5 in T cell survival and proliferation. J Exp Med 2007; 204:25-31; PMID:17190837; https://doi.org/10.1084/jem.20061303
- Paglin S, Hollister T, Delohery T, Hackett N, McMahill M, Sphicas E, Domingo D, Yahalom J. A novel response of cancer cells to radiation involves autophagy and formation of acidic vesicles. Cancer Res 2001; 61:439-44; PMID:11212227
- Li M, Lindblad JL, Perez E, Bergmann A, Fan Y. Autophagy-independent function of Atg1 for apoptosis-induced compensatory proliferation. BMC Biol 2016; 14:70; PMID:27542914; https://doi.org/10.1186/s12915-016-0293-y
- Zhang XF, Gurunathan S. Combination of salinomycin and silver nanoparticles enhances apoptosis and autophagy in human ovarian cancer cells: an effective anticancer therapy. Int J Nanomedicine 2016; 11:3655-75; PMID:27536105; https://doi.org/10.2147/IJN.S111279
- Dan X, Liu W, Wong JH, Ng TB. A ribonuclease isolated from wild ganoderma lucidum suppressed autophagy and triggered apoptosis in colorectal cancer cells. Front Pharmacol 2016; 7:217; PMID:27504094; https://doi.org/10.3389/fphar.2016.00217
- Kaminskyy VO, Piskunova T, Zborovskaya IB, Tchevkina EM, Zhivotovsky B. Suppression of basal autophagy reduces lung cancer cell proliferation and enhances caspase-dependent and -independent apoptosis by stimulating ROS formation. Autophagy 2012; 8:1032-44; PMID:22562073; https://doi.org/10.4161/auto.20123
- Xu Y, Kim SO, Li Y, Han J. Autophagy contributes to caspase-independent macrophage cell death. J Biol Chem 2006; 281:19179-87; PMID:16702227; https://doi.org/10.1074/jbc.M513377200
- Hu T, Guo H, Wang W, Yu S, Han L, Jiang L, Ma J, Yang C, Guo Q, Nan K. Loss of p57 expression and RhoA overexpression are associated with poor survival of patients with hepatocellular carcinoma. Oncol Rep 2013; 30:1707-14; PMID:23842948
