
ABSTRACT
Tissue culture and mouse model studies show that the presence of the arginine (R) or proline (P) coding single nucleotide polymorphism (SNP) of the tumor suppressor gene p53 at codon 72 (p53 R72P) differentially affects the responses to genotoxic insult. Compared to the P variant, the R variant shows increased apoptosis in most cell cultures and mouse model tissues in response to genotoxins, and epidemiological studies suggest that the R variant may enhance cancer survival and reduce the risks of adverse reactions to genotoxic cancer treatment. As ionizing radiation (IR) treatment is often used in cancer therapy, we sought to test the physiological effects of IR in mouse models of the p53 R72P polymorphism. By performing blood counts, immunohistochemical (IHC) staining and survival studies in mouse populations rigorously controlled for strain background, sex and age, we discovered that p53 R72P polymorphism did not differentially affect the physiological response to IR. Our findings suggest that genotyping for this polymorphism to personalize IR therapy may have little clinical utility.
Introduction
The p53 (TRP53) tumor suppressor gene contains an SNP at codon 72, coding for either arginine or proline (p53 R72P).Citation1 Cell culture studies have shown that the p53 R72 allele is associated with increased apoptotic response to genotoxic insult, including commonly used anticancer therapies.Citation2,Citation3 Several mechanisms are proposed for these allelic differences. The R72 variant may be associated with increased apoptotic capacity compared with the P72 variant due to 1) increased interaction with nuclear export factors such as MDM2 and increased localization to the mitochondriaCitation2 and/or 2) enhanced ability to transcriptionally activate pro-apoptotic genes such as Puma (Bbc3), Perp, and AIP1 (Pdcd6ip).Citation3 Alternately, the P72 variant may exhibit less apoptotic capacity compared with the R72 due to 1) increased transcription of the DNA repair genes p53R2 (Rrm2b), Gadd45 and p48 (Ddb2)Citation4 and/or 2) increased interaction with apoptosis-inhibiting-ankyrin-repeats-SH3-domain-proline-rich-region-protein (iASPP) leading to decreased activity at the pro-apoptotic Bax promoter.Citation5 Whether these observed differences between p53 R72P variants in regulating various apoptotic pathways in vitro translate to differential in vivo responses to genotoxic exposures among individuals with different p53 genotypes remains unknown.
Although many epidemiological studies have examined the effect of the p53 R72P polymorphism on cancer incidence, polymorphism-associated differences are often inconsistent across studies.Citation6 Compared to incidence studies, there are few epidemiological reports addressing the association of p53 R72P genotypes with differences in cancer survival and response to therapy. In the studies that have been published, patients with heterozygous or homozygous R72 alleles appear to fare significantly better in response to standard therapies, including IR therapy.Citation3,Citation7-Citation12 One study found that p53P72/P72 breast cancer patients show significantly lower survival even when the tumor is null for p53.Citation7 This suggests that the survival effect of the polymorphism may be mediated by tumor micro- and macro-environmental differences in the host. Additionally, some studies have shown polymorphism-associated differences in adverse effects of chemotherapy regimens, such as increased febrile neutropenia in p53P72/ P72 breast cancer patients and increased neutropenia in p53P72/ P72 small cell lung cancer patients when compared with p53R72/R72 and p53P72/R72 patients.Citation13, Citation14
IR is used in over 50% of cancer treatments at our parent institution, MD Anderson (mdanderson.org). IR is highly genotoxic, directly causing DNA double strand breaks (DSBs) and other DNA damage and indirectly creating additional damage through the generation of reactive oxygen species. In radiosensitive normal tissues and in tumors with wild-type p53, DSBs lead to p53-dependent induction of pro-apoptotic genes and subsequent apoptosis.Citation15 As a therapy, high dose total body irradiation (TBI) is used primarily as a myeloablative conditioning treatment before haematopoietic stem cell transplant for hematologic malignancies.Citation16 However, IR's ability to destroy bone marrow can also occur incidentally as an acute side effect even in more localized treatments. For example, acute side effects of IR exposure of the thoracic vertebrae, which incidentally targets large sections of bone marrow, can include hematological toxicity, including neutropenia, leukopenia and thrombocytopenia.Citation17 Other acute side effects of high dose radiation include gastrointestinal disorders.Citation16,Citation18
Radiogenomics, a branch of personalized medicine that seeks to understand how tumor response and side effects of IR therapy may be affected by genetic polymorphisms among patients, uses SNP case/control studies and genome wide association studies (GWAS) to identify polymorphisms that may affect the IR response (reviewed inCitation19-Citation21). However, there has been a recent call for expanding and diversifying radiogenomic methodology.Citation22 With this is mind, recently developed humanized mouse models of gene polymorphisms could be used for preclinical testing of the impact of SNPs on IR toxicity.
Currently, radiogenomic studies of the R72P polymorphism's influence on IR side effects are very limited. Our laboratory has developed and characterized humanized mouse models for the 2 p53 (Trp53) codon 72 variants, allowing us to study the polymorphism in vivo. These knock-in models replace mouse exon 4 with human exon 4 sequences encoding either a proline (CCC) or arginine (CGC) at codon 72. Using these models, we previously noted tissue-specific differences between p53P72/P72 and p53R72/R72 mice in apoptosis induction upon DNA damage, with intestinal tissue showing increased apoptosis in p53R72/R72 variant mice in response to IR. In that study, expression of the pro-apoptotic p53 target genes Puma, Perp, and Noxa was higher in p53R72/R72 mouse embryonic fibroblasts both untreated and treated with ultraviolet (UV) light (another genotoxic agent), as compared with p53P72/P72 mouse embryonic fibroblasts.Citation23 Another group with similar mouse models of the R72P polymorphism also observed differences in apoptosis induction in the intestine and noted an increased apoptotic response to IR in the thymus of p53P72/P72 mice when compared with p53R72/R72 mice. Additionally, increased p21 expression in the thymocytes from IR exposed p53P72/P72 mice was noted.Citation24, Citation25
Taken together, the cell culture, epidemiological and mouse model studies discussed above suggest that the adverse effects of IR therapy may be modulated by the p53 R72P polymorphism. Therefore, we sought to more clearly define the physiological impact of each p53 polymorphic variant on the response to IR in vivo by using our humanized models for the p53 R72P polymorphism. Prior studies of this polymorphismCitation23 were done in young mice, between 6–8 weeks of age, a critical time in development and a factor that may affect responses to IR.Citation26 Also, mice carrying the p53 R72P polymorphism used in the prior studies from our laboratory were tested for background strain, and despite several generations of backcrossing to FVB background, the 2 polymorphic variant lines had diverse genetic backgrounds. Genetic background is known to be a factor in both IR sensitivity and p53 target gene expression.Citation26, Citation27 To better control for these differences in the current study, knock-in mice were backcrossed for several generations, using the “speed congenic” methodology, to achieve greater than 99% FVB/NHsd (FVB) strain background, as determined by genetic marker analysis.Citation28 Mature, age and sex-matched mice were used for each experiment. Under these tightly controlled conditions, we found that the p53 R72P polymorphism had no significant effect on tissue pathology or survival following a single exposure to high-dose IR.
Results
The p53 R72P polymorphism does not affect IR induced apoptosis or DNA double strand break (DSB) resolution in sensitive tissues
To determine whether IR would induce different levels of apoptosis in adult FVB p53P72/P72 (P/P) and p53R72/R72 (R/R) mice, mice were treated with 6 Gy IR and killed at 4 or 24 h following IR exposure. Tissues were collected and formalin fixed for subsequent histology and immunohistochemistry (IHC). IHC analysis revealed that, at 4 and 24 h post IR, there was an increase in the relative number of cleaved lamin-A positive nuclei, a marker of apoptosis,Citation29 in each genotype in thymus, spleen, bone marrow and intestine. Consistent with ongoing apoptosis, there was a marked decrease in cellularity and an increase in cellular debris in most tissues at 24 h following IR (). Employing digitized slides and morphometric image analysis software, we determined the percent of cleaved lamin-A positive nuclei. At 4 hours following IR treatment, the difference between exposed and unexposed mice was significant for all tissues across treatment groups (p<0.001 to p<0.05). At 24 h following IR treatment, the difference between exposed and unexposed mice was only significant for p53P72/P72 in mouse spleen and intestine (p<0.01). However, at 24 h post IR there was markedly reduced cellularity in most tissues (), indicating that apoptosis had already occurred and been resolved. Nonetheless, in contrast to previous studies,Citation23-Citation25 significant differences between genotypes were not detected at either time point ().
Figure 1. Representative images of cleaved lamin-A IHC in adult p53 R72P mice a) untreated or treated with 6 Gy IR at 4 hours and b) untreated or treated with 6.135 Gy IR at 24 hours.
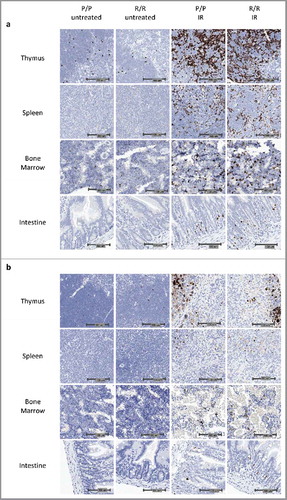
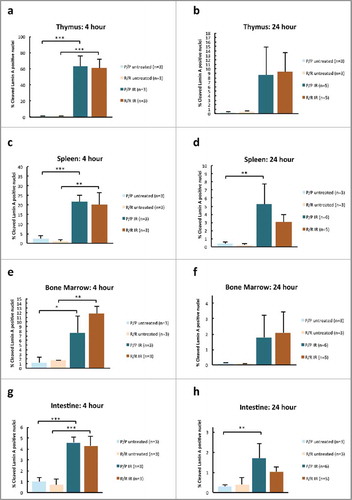
Figure 2. Percent cleaved lamin-A positive nuclei in adult p53 R72P female mice untreated or treated with 6 Gy IR at 4 h in (A) thymus (P/P untreated mean = 1.29 ± 0.55,P/P treated mean = 62.56 ± 13.69, p = 0.0001; R/R untreated mean = 1.05 ± 0.28, R/R treated mean = 60.68 ± 11.04, p = 0.0002) (C) spleen (P/P untreated mean = 2.40 ± 1.48, P/P treated mean = 21.77 ± 3.39, p = 0.0009; R/R untreated mean = 1.05 ± 0.920.94, R/R treated mean = 19.98 ± 6.32, p = 0.001) (E) bone marrow (P/P untreated mean = 1.23 ± 01.25, P/P treated mean = 7.67 ± 3.57 p = 0.02; R/R untreated mean = 1.65 ± 0.02, R/R treated mean = 11.83 ± 1.61, p = 0.001) and (G) intestine (P/P untreated mean = 1.00 ± 0.40, P/P treated mean = 4.59 ± 0.48, p = 0.0003; R/R untreated mean = 0.70 ± 0.52, R/R treated mean = 4.29 ± 0.85, p = 0.0003) and male mice untreated or treated with 6.135 Gy at 24 h in (B) thymus (P/P untreated mean = 0.28 ± 0.08, P/P treated mean = 8.56 ± 6.39, ns; R/R untreated mean = 0.49 ± 0.16, R/R treated mean = 9.31 ± 4.40, ns) (D) spleen (P/P untreated mean = 0.34 ± 0.20, P/P treated mean = 5.21 ± 2.53, p = 0.005; R/R untreated mean = 0.23 ± 0.15, R/R treated mean = 3.08 ± 0.88, ns) (F) bone marrow (P/P untreated mean = 0.11 ± 0.04, P/P treated mean = 1.78 ± 1.44, ns; R/R untreated mean = 0.08 ± 0.01, R/R treated mean = 2.09 ± 1.35, ns) and (H) intestine (P/P untreated mean = 0.30 ± 0.11, P/P treated mean = 1.71 ± 0.70, p = 0.005; R/R untreated mean = 0.40 ± 0.36, R/R treated mean = 1.03 ± 0.24. ns: One-way ANOVA followed by Tukey's multiple comparisons test, ± refers to standard deviation, ns = not significant, * p < 0.05,** p <0.01, *** p <0.001.
A prior study suggested that p53 codon 72 proline variant cells have greater capacity for DNA repair following DNA damage.Citation4 To determine whether the p53 R72P polymorphism would affect DNA DSB resolution, fixed thymus and spleen from IR treated and untreated p53 R72P mice were examined by immunohistochemistry for phosphorylated histone H2AX (γH2AX), a marker of DNA DSBs.Citation30 There were no apparent differences in γH2AX staining between genotypes in untreated mice or in mice at 4 or 24 h following IR. A relative decrease in γH2AX staining was noted at 24 h and corresponded with decreased cellularity at 24 h. This suggests that a combination of DNA repair and apoptosis of cells with irreparable DNA damage contributed to γH2AX clearance (). We then determined the percent of γH2AX nuclei morphmetrically. The difference between IR treated and untreated mice was significant for both genotypes at 4 and 24 h following IR (p<0.001 to p<0.01), but there were no significant differences between genotypes ().
Figure 3. Representative images of γH2AX IHC in adult p53 R72P mice: (A) females untreated or treated with 6 Gy IR at 4 h; (B) males untreated or treated with 6.135 Gy IR at 24 h.
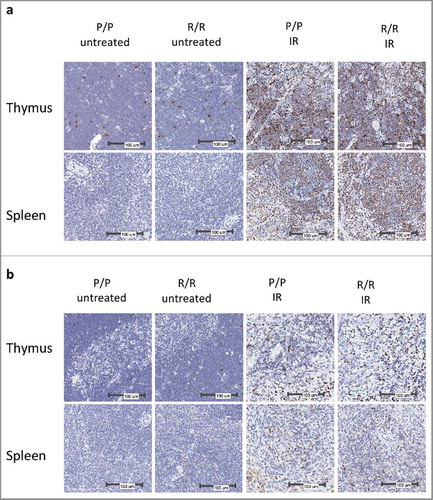
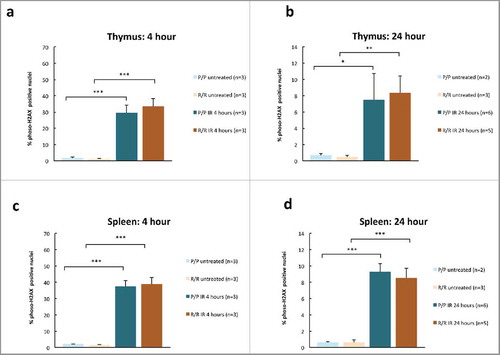
Figure 4. Percent γH2AX positive nuclei in adult p53 R72P female mice untreated or treated with 6 Gy IR at 4 hours in (A) thymus (P/P untreated mean = 1.62 ± 0.58, P/P treated mean = 29.39 ± 4.91, p = 4.33× 10−05; R/R untreated mean = 1.13 ± 0.42, R/R treated mean = 33.48 ± 4.77, p = 1.38× 10−05 (C) spleen (P/P untreated mean = 2.01 ± 0.28, P/P treated mean = 37.48 ± 3.63, p = 1.21× 10−06; R/R untreated mean = 1.58 ± 0.31, R/R treated mean = 38.95 ± 4.08, p = 7.96× 10−07); and p53 R72P male mice untreated or treated with 6.135 Gy at 24 h in (B) thymus P/P untreated mean = 0.67 ± 0.22, P/P treated mean = 7.50 ± 3.24, p = 0.02; R/R untreated mean = 0.47 ± 0.18, R/R treated mean = 8.35 ± 2.10, p = 0.004 (D) spleen (P/P untreated mean = 0.64 ± 0.07, P/P treated mean = 9.26 ± 1.03, p = 7.41× 10−07; R/R untreated mean = 0.62 ± 0.30, R/R treated mean = 8.48 ± 1.21, p = 5.98× 10−07). One-way ANOVA followed by Tukey's multiple comparisons test ± refers to standard deviation * p < 0.05, ** p <0.01, *** p <0.001.
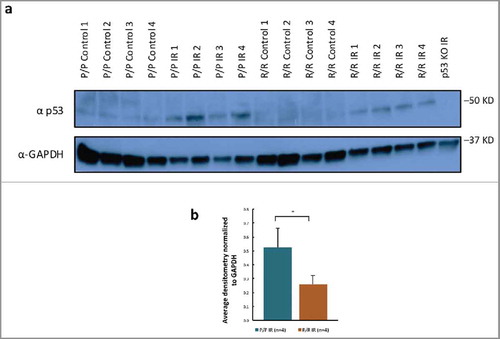
Previous studies in our laboratory showed no difference in p53 protein levels between R72P polymorphic variant mice.Citation23 In the current study, western blot analysis revealed significantly increased levels of p53 protein expression in p53P72/P72 mouse splenoctyes as compared with p53R72/R72 mouse splenoctyes following IR treatment (). This result is consistent with differences between genotypes in p53 protein IHC staining in the same tissues used for the cleaved lamin-A 4 h study, although these IHC differences were not statistically significant (Fig. S1). Nevertheless, we cannot rule out that these apparent differences in p53 protein levels were actually caused by differences in the affinity of the antibodies used in these studies to the 2 variants of p53. Indeed, we found that another commercially available p53 antibody only recognized the P variant and not the R variant of p53 (Fig. S2).
Figure 5. p53 protein levels in splenocytes of adult male p53 R72P mice untreated or exposed to 6.135 Gy IR and killed at 4 h after treatment (A) western blot of 4 biologic replicates of each genotype/treatment group (p53 knockout mouse spleenocytes used as negative control for antibody) (B) densitometry of p53 protein expression normalized to GAPDH loading control, P/P IR mean = 0.53 ± 0.13; R/R IR mean = 0.26 ± 0.06, p = 0.02, 2-sided independent t-test ± refers to standard deviation * p<0.05.
The p53 R72P polymorphism has minimal effects on the transcriptional regulation of p53 target genes following IR
Prior studies in cell culture and mouse models of the p53 R72P polymorphism have found differences in p53 target gene expression between p53P72/P72 ad p53R72/R72 variants following genotoxic insult.Citation3, Citation5, Citation23-Citation25 To test for these differences in the current study, we extracted RNA from thymocytes of adult male p53P72/P72 and p53R72/R72 mice untreated or treated with 6.135 Gy IR and killed at 4 h following treatment. We performed quantitative PCR (q-PCR) to test gene expression of several well-known p53 transcriptional targets. We also tested p53 gene expression because of the above noted differences in p53 protein levels between p53 R72P genotypes ( and Fig. S1), and because it has been suggested that p53 protein is involved in auto-regulating its own gene expression and may be involved in increasing p53 gene expression in response to genotoxic agents.Citation31, Citation32
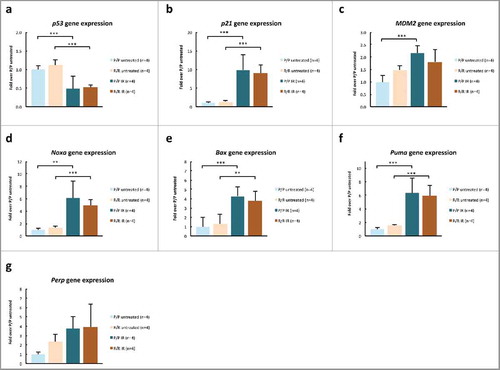
For the genes p21, Bax, Noxa and Puma the expected significant increase in gene expression for IR treated thymocytes, when compared with untreated thymocytes, was noted in both genotypes. Whereas, for Mdm2 this was only true for thymocytes from p53P72/P72 mice. Unlike prior studies in mouse tissues,Citation23,Citation25 in the current study, no difference was noted in p21, Bax, Noxa, Perp and Puma expression between p53 R72P variants in either IR treated or untreated thymocytes. IR treatment seemed to decrease p53 gene expression in thymocytes, but there were no differences between p53 R72P variants ().
Figure 6. p53 target gene expression in thymocytes of adult, male p53 R72P mice untreated or treated with 6.135 Gy IR and killed at 4 h following treatment, expressed as fold change over untreated P/P mice (value set at 1.00) (A) p53 P/P untreated mean = 1.00 ± 0.10, P/P IR mean = 0.48 ± 0.35, p = 6.37× 10−05; R/R untreated mean = 1.12 ± 0.15, R/R IR mean = 0.52 ± 0.07, p = 1.73× 10−05 (B) p21 P/P untreated mean = 1.00 ± 0.27, P/P IR mean = 9.86 ± 4.14, p = 3.59× 10−06; R/R untreated mean = 1.37 ± 0.33, R/R IR mean = 9.11 ± 2.09, p = 1.47× 10−05 (C) MDM2 P/P untreated mean = 1.00 ± 0.28, P/P IR mean = 2.17 ± 0.30 p = 9.61× 10−04; R/R untreated mean = 1.48 ± 0.16, R/R IR mean = 1.81 ± 0.49, ns (D) Noxa P/P untreated mean = 1.00 ± 0.23, P/P IR mean = 6.08 ± 2.73, p = 1.24× 10−04; R/R untreated mean = 1.39 ± 0.23, R/R IR mean = 4.94 ± 0.92, p = 0.002 (E) Bax P/P untreated mean = 1.00 ± 0.30, P/P IR mean = 4.28 ± 1.53, p = 8.89× 10−05; R/R untreated mean = 1.31 ± 0.16, R/R IR mean = 3.79 ± 0.80, p = 0.001 (F) Puma P/P untreated mean = 1.00 0.28, P/P IR mean = 6.34 ± 2.17, p = 6.53× 10−06; R/R untreated mean = 1.59 ± 0.15, R/R IR mean = 5.91 ± 1.51, p = 5.66× 10−05 (G) Perp P/P untreated = 1.00 ± 0.25, P/P IR mean = 3.73 ± 1.31, ns; R/R untreated mean = 2.30 ± 0.84, R/R IR mean = 3.94 ± 2.43, ns: One-way ANOVA followed by Tukey's multiple comparisons test ± refers to standard deviation ns = not significant * p < 0.05, ** p <0.01, *** p <0.001.
The p53 R72P polymorphism does not affect blood counts or tissue homeostasis following IR
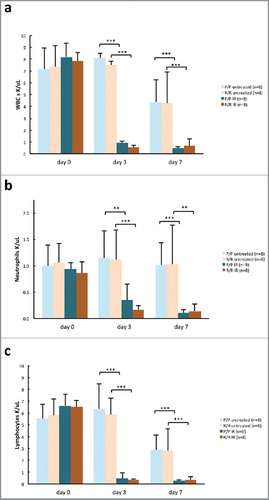
Blood counts and blood clinical chemistry were used to determine whether the p53 R72P polymorphism affects physiological responses to high doses of IR. At 3 and 7 d post IR, total white blood cell, neutrophil and lymphocyte counts for both genotypes and sexes were significantly reduced compared with untreated controls. No statistically significant differences were noted between genotypes (). IR did not appear to reduce platelet counts until day 7, but again, there were no differences between genotypes (Fig. S3). In adult male mice, very few significant differences in clinical chemistry across genotypes or treatment groups were noted, but not all parameters could be analyzed statistically due to sample error (Table S1).
Figure 7. Hematology in adult p53 R72P mice untreated or treated with 6.135 Gy IR at 0, 3 and 7 d: (A) white blood cell counts, (day 0 P/P untreated mean = 7.18 ± 1.75, P/P treated mean = 8.18 ± 1.13, ns; R/R untreated mean = 7.35 ± 1.83, R/R treated mean = 7.82 ± 0.71, ns) (day 3 P/P untreated mean = 8.11 ± 2.87, P/P treated mean = 0.92 ± 0.88, p = 2.06× 10−08; R/R untreated mean = 7.51 ± 1.97, R/R treated mean = 0.55 ± 0.18, p = 6.99× 10−08) (day 7 P/P untreated mean = 4.37 ± 1.86, P/P treated mean = 0.45 ± 0.17 p = 0.0001; R/R untreated mean = 4.28 ± 2.62, R/R treated mean = 0.69 ± 0.54, p = 0.0006) (B) neutrophil counts (day 0 P/P untreated mean = 1.00 ± 0.39, P/P treated mean = 0.93 ± 0.12, ns; R/R untreated mean = 1.06 ± 0.36, R/R treated mean = 0.86 ± 0.21, ns) (day 3 P/P untreated mean = 1.15 ± 0.52, P/P treated mean = 0.35 ± 0.31, p = 0.002, R/R untreated mean = 1.12 ± 0.56, R/R treated mean = 0.17 ± 0.08, p = 0.0004) day 7 P/P untreated mean = 1.02 ±, 0.42 P/P treated mean = 0.11 ± 0.04, p = 0.0007; R/R untreated mean = 1.03 ± 0.74, R/R treated mean = 0.14 ± 0.13, p = 0.001) (C) lymphocyte counts (day 0 P/P untreated mean = 5.51 ± 1.25, P/P treated mean = 6.63 ± 0.96, ns; R/R untreated mean = 5.80 ± 1.41, R/R treated mean = 6.53 ± 0.54, ns) (day 3 P/P untreated mean = 6.36 ± 2.11, P/P treated mean = 0.47 ± 0.47, p = 1.38× 10−09, R/R untreated mean = 5.85 ± 1.45, R/R treated mean = 0.32 ± 0.12, p = 1.00× 10−08) (day 7 P/P untreated mean = 2.90 ± 1.23, P/P treated mean = 0.27 ± 0.11, p = 0.0002, R/R untreated mean = 2.82 ± 1.83, R/R treated mean = 0.37 ± 0.22, p = 0.0005). One way ANOVA followed by Tukey's multiple comparisons test ± refers to standard deviation ns = not significant ** p <0.01, *** p <0.001.
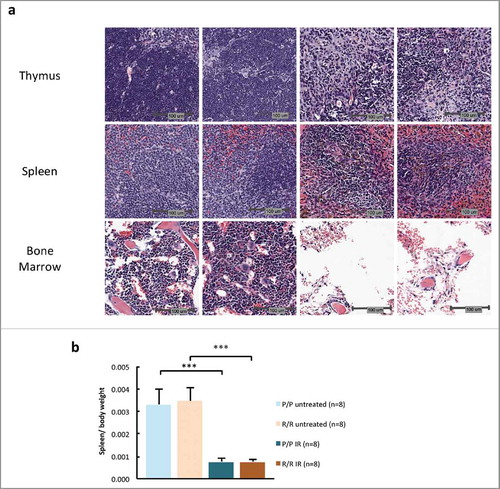
To examine differences in acute pathology and early recovery from IR-induced tissue damage, histopathological analysis was performed on IR sensitive tissues from mice killed 7 d after IR treatment. Compared to control tissues, IR-treated spleen, thymus and bone marrow still showed substantially reduced cellularity (), whereas intestinal tissue showed a slight increase in cellularity in the intestinal crypts. However, no difference between p53P72/P72 and p53R72/R72 mouse tissues was evident (Table S2). To quantify changes in cellularity in IR sensitive tissues, the weight of fixed spleen was calculated as a percent of body weight at day 7 in both IR treated and control mice. IR treated mice of both genotypes exhibited significantly decreased spleen weight compared with control mice, but there were no differences between spleen weights of p53P72/P72 and p53R72/R72 mice in either treatment group ().
Figure 8. (A) H & E staining showing representative histopathology in adult male p53 R72P mice untreated or treated with 6.135 Gy IR at 7 d (B) Fixed spleen weight as a proportion of total body weight in adult male and female p53 R72P mice untreated or treated with 6.135 Gy IR at 7 d. (P/P untreated mean = 0.0033 ± 0.0007, P/P treated mean = 0.0008 ± 0.0001 p<0.001; R/R untreated mean = 0.0035 ± 0.0006, R/R treated mean = 0.0008 ± 0.0001 p<0.001) One-way ANOVA followed by Tukey's multiple comparisons test ± refers to standard deviation *** p <0.001.
The p53 R72P polymorphism does not affect mouse survival following IR
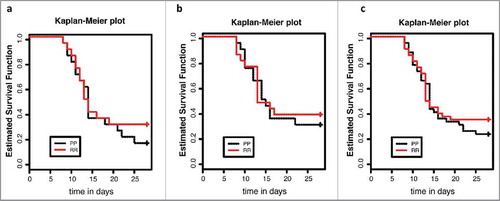
FVB-p53P72/P72 and p53R72/R72 male and female mice within 5 d of 15 weeks of age were subjected to 6.135 Gy of IR and placed in sterile housing with antibiotic drinking water. Mice were weighed at day 0 and day 7 following treatment, health was monitored until 28 d following treatment and mice deemed moribund by criteria, including greater than 20 percent weight loss, hunched posture, lethargy, rapid or labored breathing and anorexia, were killed. At this radiation dose, approximately 70% of mice became moribund before 25 d, with the majority showing morbidity 10–20 d following treatment. The p53 R72P polymorphism did not significantly affect survival when analyzed by log-rank tests in males, females or both sexes as a combined group (). Body weights decreased in both male and female mice from day 0 to day 7 following IR treatment, but there was no difference in weight between genotypes at either time-point in male or female mice ( Fig. S4).
Figure 9. Kaplan-Meier survival curves for adult p53 R72P mice treated with 6.135 Gy IR and followed for 28 d: (A) males (P/P males n = 20, R/R males n = 20, log rank test: ns) (B) females (P/P females n = 20, R/R females n = 21, log rank test: ns) and (C) both sexes combined (P/P n = 40, R/R n = 41, log-rank test: ns) ns = not significant.
Discussion
How individual genetics play into the adverse effects and efficacy of cancer therapies is the subject of intense investigation. However, considering that over 80 million human SNPs are known,Citation33 it is challenging to understand the subtle effects of a single nucleotide change in a patient population, especially in the context of different genetic backgrounds, environmental conditions and treatment regimens. One approach to this challenge is to model human SNPs in the mouse by replacing an orthologous mouse DNA sequence with functionally important human variant sequences. The benefit of using highly inbred mouse models is that we can control for genetic background and environmental differences while testing a particular SNP's function in modulating the response to cancer therapies. In theory, these humanized mouse models may be good proxies for indicating which human SNPs warrant further clinical investigation in the field of personalized medicine.
We used our humanized p53 R72P knock-in mice to model the effect of the R72P polymorphism on tissue homeostasis and survival following IR exposure. We saw minimal differences in target gene expression between p53 R72P variant mice in thymocytes from IR treated and untreated mice. Although we saw some indication of differences in p53 protein levels in several tissues, these did not appear to translate into physiological phenotypes. Indeed, blood counts and IHC data suggest that the p53 R72P polymorphism does not significantly affect apoptosis in bone marrow, thymus, spleen, or intestinal epithelia following IR exposure. Furthermore, the R72P polymorphism did not seem to affect γH2AX clearance in spleen and thymus in IR treated mice, suggesting that DSB resolution was not affected by the polymorphism. At 7 d following IR treatment, tissues sensitive to IR showed changes in cellularity, but no differences between p53P72/P72 and p53R72/R72 mice were seen. This indicates that acute damage and short-term recovery were not affected by the polymorphism. Furthermore, at 28 d following exposure, no difference was seen in survival between genotypes, indicating that the longer-term effects of IR treatment and recovery from bone marrow suppression and intestinal epithelial damage were also not significantly affected by the polymorphism.
Prior studies in our laboratory and other laboratories noted differences in apoptosis between p53 R72P humanized mouse model variants exposed to IR. These differences included increased IHC staining for apoptotic markers in p53P72/P72 thymus compared with p53R72/R72 thymusCitation25 and increased IHC staining for markers of apoptosis in p53R72/R72 intestine compared with p53P72/P72 intestine.Citation23,Citation24 In the current study, we did not observe differences in IHC staining for markers of apoptosis between p53 R72P variants in either of these tissues. Differences between this study and prior studies from our group and others underscore the importance of controlling for background genetics and using age-appropriate mice when modeling how genetic variation influences the adverse effects of radiation therapy. It is also possible that minor differences in IR dose or timing of analysis post IR contribute to differences between studies.
Little is known about how the p53 R72P polymorphism affects adverse responses to IR in patient populations. Case/control studies of this polymorphism's effect are limited to 2 reports of skin damage following local IR treatment of breast cancer. One study found an increase in late skin complications of patients harboring the proline allele,Citation34 but an earlier study found the polymorphism did not significantly affect acute skin damage following similar treatment.Citation35 Although our study did not investigate skin damage, we found that the p53 R72P polymorphism plays no role in modulating IR damage to several other tissues. Whether the polymorphism modulates side effects of other genotoxic therapies is not known. As the polymorphism has been shown to modify the inflammatory response to multiple stimuli in mouse models,Citation25,Citation36 it may be important to use polymorphic mouse models to examine differences in adverse effects of immunotherapy-based cancer treatments.
Based on our mouse models, the p53 R72P polymorphism may not have a significant effect on the pathology of high dose total body IR exposure. However, our study does not address localized IR treatment effects, nor does it address the effects of multiple treatments. Furthermore, this study focuses on the effect of p53 R72P polymorphism as a single genetic variable and cannot address genetic interactions between this polymorphism and polymorphisms in other genes. Therefore, continued study of the p53 R72P polymorphism in the context of radiogenomics may be warranted.
Materials and methods
Mice used
All experiments with mice were performed in accordance with relevant federal and institutional guidelines and regulations. All animal procedures were reviewed and approved by the University of Texas MD Anderson Cancer Center Institutional Animal Care and Use Committee.
Generation of p53P72/P72 and p53R72/R72 knock-in mice is described elsewhere.Citation23 To avoid potential influence of mouse strain on phenotypes, we backcrossed to FVB/NHsd (Envigo, Indianapolis, IN) mice until they were determined to be >99% FVB, using marker (microsatellite) assisted backcrossing (speed congenics) at MD Anderson Cancer Center-Smithville.Citation28 To avoid the possibility that age differences in development could account for phenotypes, we only used adult mice approximately 15 w old. To control for differences between sexes, mice were either sex-matched for each experiment or an equal number of mice from each sex was used.
IR survival studies
Mice were subjected to X-ray IR using an RS 2000 Biological Research Irradiator (RadSource, Suwanee, GA, USA). Approximately 15-week-old p53P72/P72 and p53R72/R72 mice were treated with 6.135 Gy IR. Mice were weighed, transferred to sterile housing and treated with prophylactic antibiotics (Clavamox: 50mg/ml amoxicillin and 12.5mg/ml clavulanic acid) in their drinking water. We monitored mice daily, weighed mice weekly, and killed mice exhibiting morbidity.
Western blots
Cells from spleen were forced through a cell filter into cold PBS and pelleted. The pellets were lysed with RIPA Lysis Buffer System (#SC-24948, Santa Cruz Biotechnology, CA, USA). Western blot was performed on lysates with primary anti-p53 antibody A-1 (#SC-393031, Santa Cruz Biotechnology, CA, USA, 1:500 dilution, 4°C overnight) and secondary antibody m-IgGκ BP-HRP (#SC-516102, Santa Cruz Biotechnology, CA, USA, 1:5000 dilution, room temperature (RT) 1 h). Membranes were washed and re-probed with anti-GAPDH antibody (MAB374, Millipore Sigma, Darmstadt, Germany 1:5000 dilution, 4°C overnight) and rabbit anti-mouse secondary antibody (#SC-358914 Santa Cruz Biotechnology, CA, USA, 1:10,000 dilution, RT, 1 h).
For mouse adult fibroblast (MAF) lysates, primary antibodies anti-p53 CM5 (#VP-P956, Vector Laboratories, Burlingame, CA, USA, 1:1000 dilution, 4°C overnight) or anti-phospho-p53 (Serine 15) (CST-#9284, Cell Signaling Technology, Danvers, MA, USA, 1:1000 dilution, 4°C overnight) and donkey anti-rabbit secondary antibody (#NA934, GE Healthcare UK Limited, Buckinghamshire, UK, 1:10,000, RT, 1 h) were used. Membranes were stripped and re-probed with anti-β-actin clone AC-15 (#A1978, Sigma-Aldrich, Darmstadt, Germany, 1:10,000, room temperature, 30–60 min) and rabbit anti-mouse secondary (#SC-2004, Santa Cruz Biotechnology, CA, USA, 1:10,000 dilution, RT, 30–60 min).
Density of protein bands on film was determined using ImageJ software (https://imagej.nih.gov/ij/).
Reverse transcription (RT) and quantitative PCR (Q-PCR)
Cells from thymus were forced through a cell filter into cold PBS and pelleted. RNeasy Plus Mini Kit (Hilden, Germany) was used, as per manufacturer's instructions to remove genomic DNA and extract RNA. cDNA was generated using the SuperScript® II Reverse Transcriptase kit (Invitrogen, Carlsbad, CA, USA) as per manufacturers instructions. Quantitative PCR was performed using the primers
p21: For. 5′AATACCGTGGGTGTCAAAGC3′ Rev. 5′ GTGTGAGGACTCGGGACAAT3′
MDM2: For. 5′AGGAAGCGAAGGATAGCTTTG3′ Rev. 5′CACCGCCTCCTATTCAAATG3′,
Noxa: For. 5′TCAGCATGTGTATCCGTTTCA3′ Rev. 5′CCTTAATGCTGAGGCCCACT3′,
Puma: For. 5′ TGTGACCACTGGCATTCATT3′ Rev. 5′CCCAGACTCCTCCCTCTTCT3′
PrimePCR™ SYBR® Green Assays qMmuCID0007961 was used for Perp, qMmuCID0006274 for Bax, for qMmuCID0006264for p53 (Biorad, Hercules, CA, USA). All gene expression values were normalized to the average value of P/P untreated mice.
Post-IR blood counts and blood clinical chemistry
For monitoring blood count, approximately 100 μL of blood was collected from the saphenous vein of live 14- to 17-week-old p53P72/P72 and p53R72/R72 mice before IR exposure. Mice were subjected to 6.135 Gy IR or left untreated and blood sampling was repeated 3 d after exposure. For day 7 blood counts and clinical chemistry, we killed mice by CO2 inhalation and immediately removed approximately 500 uL of blood by cardiac puncture. For blood counts, blood was collected in sodium EDTA micro-tubes and counted in the Hemavet 950 hematology system (Drew Scientific, Miami Lakes, FL, USA). For clinical chemistry analysis, blood was collected in lithium heparin micro-tubes and analyzed using Abaxis Vetscan VS2 clinical chemistry analyzer using Comprehensive Diagnostic Profile rotors #500–0038 (Union City, CA, USA).
Post IR spleen weight study
Mice were weighed before treatment and at sacrifice, and the spleen was weighed after formalin fixation.
Post-IR IHC analysis
Fourteen- to 17-week-old p53P72/P72 and p53R72/R72 mice were subjected to 6 Gy IR (4-h study) or 6.135 Gy IR (24-h and 7-d study) or left untreated and killed at the indicated time-points. Tissues were fixed in 10% buffered formalin, embedded in paraffin and sectioned routinely. IHC staining was used to detect cleaved lamin-A (Cell Signaling #2035, Danvers, MA, USA, 1:50 dilution overnight @ 4° C), γH2AX (Cell Signaling #2577, Danvers, MA, 1:200 dilution, 2 h @ room temperature) and p53 (#SC-6243, Santa Cruz Biotechnology, CA, USA, 1:50 dilution 1 h at room temperature). H & E staining was performed with a Shandon Varistain Gemini automatic stainer (ThermoFischer Scientific, Waltham, MA, USA). Slides were digitized using an Aperio Scan Scope CS (Leica Biosystems, IL, USA) and analyzed with the manufacturer's GENIE morphometry software (Spectrum version 10.2.2.2315). The standard DAB nuclear analysis program was modified to improve its ability to recognize immunopositive nuclei and the modified analysis algorithm was applied to selected tissues.
Statistical testing
Statistical significance for most studies was determined with either a one-way ANOVA followed by Tukey's multiple comparison test or a 2-sided independent t-test (as indicated on figure legends). For survival curves, a Kaplan–Meier estimate was generated and analyzed for statistical significance with the log-rank test using Survival Package R (https://cran.r-project.org/). In all cases, tests with a p value of 0.05 or less were considered statistically significant.
Disclosure of potential conflicts of interest
No potential conflicts of interest were disclosed.
Notes on contributors
E.D., D.J. and D.K. contributed to the conception and design of experiments as well as data interpretation and analysis. E.D. executed most experiments, while J.O. performed the bulk of the IR survival study and assisted in collecting samples for western blot and q-PCR studies. D.K. performed pathological analysis of the IHC slides. C.P. designed algorithms for histomorphology image analysis software. F.B. performed marker assisted background characterization. K.L. performed most statistical analysis. D.J. directed the research and E.D. and D.J. wrote the manuscript with contributions from all authors.
Supplemental_materials.zip
Download Zip (6.9 MB)Acknowledgments
I would like to acknowledge the Gigli family for their generous scholarship that contributed to my ability to complete this work. I would also like to thank the entire staff of the Research Animal Support Facility for their continuous efforts to ensure the best treatment for our laboratory animals and Pamela Huskey and Sara McManus for providing technical assistance. I also thank Dr. JJ Shen and his staff in the Science Park Molecular Biology Core, Becky Brooks for assistance in manuscript preparation and Joi Holcombe assisted with images and figures.
Funding
Emily Dominguez was the recipient of the H-E-B Fellowship in cancer. This research was partially funded by NIH grant ES015587 (D. G. Johnson) and made use of the Laboratory Animal Genetic Services and Mutant Mouse Pathology Services supported by P30 CA016672 DHHS/NCI Cancer Center Support Grant to MD Anderson Cancer Center.
Related Research Data
References
- Harris N, Brill E, Shohat O, Prokocimer M, Wolf D, Arai N, Rotter V. Molecular basis for heterogeneity of the human p53 protein. Mol Cell Biol 1986; 6:4650-6; PMID:3025664
- Dumont P, Leu JI, Della Pietra AC, 3rd, George DL, Murphy M. The codon 72 polymorphic variants of p53 have markedly different apoptotic potential. Nat Genet 2003; 33:357-65; PMID:12567188; https://doi.org/10.1038/ng1093
- Sullivan A, Syed N, Gasco M, Bergamaschi D, Trigiante G, Attard M, Hiller L, Farrell PJ, Smith P, Lu X, et al. Polymorphism in wild-type p53 modulates response to chemotherapy in vitro and in vivo. Oncogene 2004; 23:3328-37; PMID:15077186; https://doi.org/10.1038/sj.onc.1207428
- Siddique M, Sabapathy K. Trp53-dependent DNA-repair is affected by the codon 72 polymorphism. Oncogene 2006; 25:3489-500; PMID:16462765; https://doi.org/10.1038/sj.onc.1209405
- Bergamaschi D, Samuels Y, Sullivan A, Zvelebil M, Breyssens H, Bisso A, Del Sal G, Syed N, Smith P, Gasco M, et al. iASPP preferentially binds p53 proline-rich region and modulates apoptotic function of codon 72-polymorphic p53. Nat Genet 2006; 38:1133-41; PMID:16964264; https://doi.org/10.1038/ng1879
- Whibley C, Pharoah PD, Hollstein M. p53 polymorphisms: cancer implications. Nat Rev Cancer 2009; 9:95-107; PMID:19165225; https://doi.org/10.1038/nrc2584
- Tommiska J, Eerola H, Heinonen M, Salonen L, Kaare M, Tallila J, Ristimäki A, von Smitten K, Aittomäki K, Heikkilä P, et al. Breast cancer patients with p53 Pro72 homozygous genotype have a poorer survival. Clin Cancer Res 2005; 11:5098-103; PMID:16033823; https://doi.org/10.1158/1078-0432.CCR-05-0173
- Xu Y, Yao L, Ouyang T, Li J, Wang T, Fan Z, Lin B, Lu Y, Xie Y. p53 Codon 72 polymorphism predicts the pathologic response to neoadjuvant chemotherapy in patients with breast cancer. Clin Cancer Res 2005; 11:7328-33; PMID:16243804; https://doi.org/10.1158/1078-0432.CCR-05-0507
- Cattelani S, Ferrari-Amorotti G, Galavotti S, Defferrari R, Tanno B, Cialfi S, Vergalli J, Fragliasso V, Guerzoni C, Manzotti G, et al. The p53 codon 72 Pro/Pro genotype identifies poor-prognosis neuroblastoma patients: correlation with reduced apoptosis and enhanced senescence by the p53-72P isoform. Neoplasia 2012; 14:634-43; PMID:22904680; https://doi.org/10.1593/neo.12594
- Abdel Hamid TM, El Gammal MM, Eibead GT, Saber MM, Abol Elazm OM. Clinical impact of SNP of P53 genes pathway on the adult AML patients. Hematology 2015; 20:328-35; PMID:25232917; https://doi.org/10.1179/1607845414Y.0000000200
- Xie X, Jin H, Hu J, Zeng Y, Zhou J, Ouyang S, Yang W, Hu B, Wang H. Association between single nucleotide polymorphisms in the p53 pathway and response to radiotherapy in patients with nasopharyngeal carcinoma. Oncol Rep 2014; 31:223-31; PMID:24173110
- Cescon DW, Bradbury PA, Asomaning K, Hopkins J, Zhai R, Zhou W, Wang Z, Kulke M, Su L, Ma C, et al. p53 Arg72Pro and MDM2 T309G polymorphisms, histology, and esophageal cancer prognosis. Clin Cancer Res 2009; 15:3103-9; PMID:19383811; https://doi.org/10.1158/1078-0432.CCR-08-3120
- Wang X, Wang YZ, Ma KW, Chen X, Li W. MDM2 rs2279744 and TP53 rs1042522 polymorphisms associated with etoposide- and cisplatin-induced grade III/IV neutropenia in Chinese extensive-stage small-cell lung cancer patients. Oncol Res Treat 2014; 37:176-80; PMID:24732641
- Okishiro M, Kim SJ, Tsunashima R, Nakayama T, Shimazu K, Shimomura A, Maruyama N, Tamaki Y, Noguchi S. MDM2 SNP309 and TP53 R72P associated with severe and febrile neutropenia in breast cancer patients treated with 5-FU/epirubicin/cyclophosphamide. Breast Cancer Res Treat 2012; 132:947-53; PMID:21706156; https://doi.org/10.1007/s10549-011-1637-5
- Maier P, Hartmann L, Wenz F, Herskind C. Cellular pathways in response to ionizing radiation and their targetability for tumor radiosensitization. Int J Mol Sci 2015; 17:pii: E102
- Hill-Kayser CE, Plastaras JP, Tochner Z, Glatstein E. TBI during BM and SCT: review of the past, discussion of the present and consideration of future directions. Bone Marrow Transplant 2011; 46:475-84; PMID:21113184; https://doi.org/10.1038/bmt.2010.280
- Deek MP, Benenati B, Kim S, Chen T, Ahmed I, Zou W, Aisner J, Jabbour SK. Thoracic vertebral body irradiation contributes to acute hematologic toxicity during chemoradiation therapy for non-small cell lung cancer. Int J Radiat Oncol Biol Phys 2016; 94:147-54; PMID:26700708; https://doi.org/10.1016/j.ijrobp.2015.09.022
- Kavanagh BD, Pan CC, Dawson LA, Das SK, Li XA, Ten Haken RK, Miften M. Radiation dose-volume effects in the stomach and small bowel. Int J Radiat Oncol Biol Phys 2010; 76:S101-7; PMID:20171503; https://doi.org/10.1016/j.ijrobp.2009.05.071
- Alsner J, Andreassen CN, Overgaard J. Genetic markers for prediction of normal tissue toxicity after radiotherapy. Semin Radiat Oncol 2008; 18:126-35; PMID:18314067; https://doi.org/10.1016/j.semradonc.2007.10.004
- Parliament MB, Murray D. Single nucleotide polymorphisms of DNA repair genes as predictors of radioresponse. Semin Radiat Oncol 2010; 20:232-40; PMID:20832015; https://doi.org/10.1016/j.semradonc.2010.05.003
- Guo Z, Shu Y, Zhou H, Zhang W, Wang H. Radiogenomics helps to achieve personalized therapy by evaluating patient responses to radiation treatment. Carcinogenesis 2015; 36:307-17; PMID:25604391; https://doi.org/10.1093/carcin/bgv007
- Dolgin E. Using DNA, radiation therapy gets personal. Science 2016; 353:1348-9; https://doi.org/10.1126/science.353.6306.1348
- Zhu F, Dolle ME, Berton TR, Kuiper RV, Capps C, Espejo A, McArthur MJ, Bedford MT, van Steeg H, de Vries A, et al. Mouse models for the p53 R72P polymorphism mimic human phenotypes. Cancer Res 2010; 70:5851-9; PMID:20587514
- Azzam GA, Frank AK, Hollstein M, Murphy ME. Tissue-specific apoptotic effects of the p53 codon 72 polymorphism in a mouse model. Cell Cycle 2011; 10:1352-5; PMID:21566457; https://doi.org/10.4161/cc.10.9.15344
- Frank AK, Leu JI, Zhou Y, Devarajan K, Nedelko T, Klein-Szanto A, Hollstein M, Murphy ME. The codon 72 polymorphism of p53 regulates interaction with NF-{kappa}B and transactivation of genes involved in immunity and inflammation. Mol Cell Biol 2011; 31:1201-13; PMID:21245379; https://doi.org/10.1128/MCB.01136-10
- Roscoe B. Jackson Memorial Laboratory. Green EL. Biology of the laboratory mouse. New York,: Blakiston Division, 1966
- Lindsay KJ, Coates PJ, Lorimore SA, Wright EG. The genetic basis of tissue responses to ionizing radiation. Br J Radiol 2007; 80 Spec No 1:S2-6; PMID:17704322; https://doi.org/10.1259/bjr/60507340
- Wakeland E, Morel L, Achey K, Yui M, Longmate J. Speed congenics: a classic technique in the fast lane (relatively speaking). Immunol Today 1997; 18:472-7; PMID:9357138; https://doi.org/10.1016/S0167-5699(97)01126-2
- Rao L, Perez D, White E. Lamin proteolysis facilitates nuclear events during apoptosis. J Cell Biol 1996; 135:1441-55; PMID:8978814; https://doi.org/10.1083/jcb.135.6.1441
- Sharma A, Singh K, Almasan A. Histone H2AX phosphorylation: a marker for DNA damage. Methods Mol Biol 2012; 920:613-26; PMID:22941631
- Deffie A, Wu H, Reinke V, Lozano G. The tumor suppressor p53 regulates its own transcription. Mol Cell Biol 1993; 13:3415-23; PMID:7684498; https://doi.org/10.1128/MCB.13.6.3415
- Wang S, El-Deiry WS. p73 or p53 directly regulates human p53 transcription to maintain cell cycle checkpoints. Cancer Res 2006; 66:6982-9; PMID:16849542
- Altshuler DM, Durbin RM, Abecasis GR, Bentley DR, Chakravarti A, Clark AG, et al. (1000 Genomes Project Consortium with 843 Collaborators). A global reference for human genetic variation. Nature 2015; 526:68-74; PMID:26432245; https://doi.org/10.1038/nature15393
- Chang-Claude J, Ambrosone CB, Lilla C, Kropp S, Helmbold I, von Fournier D, Haase W, Sautter-Bihl ML, Wenz F, Schmezer P, et al. Genetic polymorphisms in DNA repair and damage response genes and late normal tissue complications of radiotherapy for breast cancer. Br J Cancer 2009; 100:1680-6; PMID:19367277; https://doi.org/10.1038/sj.bjc.6605036
- Tan XL, Popanda O, Ambrosone CB, Kropp S, Helmbold I, von Fournier D, Haase W, Sautter-Bihl ML, Wenz F, Schmezer P, et al. Association between TP53 and p21 genetic polymorphisms and acute side effects of radiotherapy in breast cancer patients. Breast Cancer Res Treat 2006; 97:255-62; PMID:16331344; https://doi.org/10.1007/s10549-005-9119-2
- Sarkar J, Dominguez E, Li G, Kusewitt DF, Johnson DG. Modeling gene-environment interactions in oral cavity and esophageal cancers demonstrates a role for the p53 R72P polymorphism in modulating susceptibility. Mol Carcinog 2014; 53:648-58; PMID:23475592