
ABSTRACT
We report for the first time the mechanism of action of the natural product thalicthuberine (TH) in prostate and cervical cancer cells. TH induced a strong accumulation of LNCaP cells in mitosis, severe mitotic spindle defects, and asymmetric cell divisions, ultimately leading to mitotic catastrophe accompanied by cell death through apoptosis. However, unlike microtubule-binding drugs (vinblastine and paclitaxel), TH did not directly inhibit tubulin polymerization when tested in a cell-free system, whereas it reduced cellular microtubule polymer mass in LNCaP cells. This suggests that TH indirectly targets microtubule dynamics through inhibition of a critical regulator or tubulin-associated protein. Furthermore, TH is not a major substrate for P-glycoprotein (Pgp), which is responsible for multidrug resistance in numerous cancers, providing a rationale to further study TH in cancers with Pgp-mediated treatment resistance. The identification of TH's molecular target in future studies will be of great value to the development of TH as potential treatment of multidrug-resistant tumors.
Introduction
Prostate cancer (PCa) is a global health problem in men; it is the second most diagnosed cancer in developed countries and the fifth most common cause for cancer-related death.Citation1 Metastatic castrate-resistant PCa (mCRPC) remains an incurable disease and a significant public health burden.Citation2 This emphasizes the need for additional PCa therapies, including drugs that block proven targets but remain unchallenged by known resistance mechanisms.Citation2 Mitosis plays a key role in cancer progression, as cancer cells have an uncontrolled mitosis and high proliferation rate.Citation3 Cell division is a highly regulated process and has emerged over the past decades as one of the most efficient targets of cancer chemotherapy.Citation4 Some inhibitors of key regulators of cell division are currently being assessed in clinical trial. For example, the Polo-like kinase 1 inhibitor Volasertib has shown promising clinical efficacy in a variety of malignancies including acute myeloid leukemia.Citation5 The Aurora kinase A inhibitor MNL8237 is currently in phase II clinical trial in patients with mCRPC.Citation6 Yet, inhibiting mitosis using microtubule-targeting drugs is currently the most effective and widely used chemotherapeutic strategy.Citation7 Microtubule (MT) drugs inhibit MT dynamics at low nanomolar concentrations, which causes defective mitotic spindle organization, leading to a cell cycle arrest in mitosis and cell death. According to their effect at micromolar doses on MT polymerization, MT inhibitors are divided into 2 classes: MT-stabilizing agents (e.g., taxanes, epothilones, laulimalide, and peloruside A) and MT-destabilizing agents (e.g., vinca alkaloids, nocodazole, colchicine, and maytansine).Citation7 Docetaxel and cabazitaxel (semi-synthetic analogs of the natural product paclitaxel) are the gold standard to treat mCRPC,Citation2 while vinorelbine (semi-synthetic analog of the natural product vinblastine) is the treatment used for a variety of cancers, including breast cancer and small cell lung cancer.Citation8,9 However, severe toxicities (such as toxicity on the peripheral nervous systemCitation10) and development of resistance in patients to current treatments, highlight the need for new therapeutic agents and new mitotic targets.
Here, we present the mechanism of action study of thalicthuberine (TH), a natural product isolated from the Australian endemic tree Hernandia albiflora (Hernandiaceae). TH is a phenanthrene alkaloid with a 1-(2-aminoethyl) side chain, and was previously isolated from a wide range of plants, including Thalictrum thunbergii,Citation11 Thalictrum simplex,Citation12 Thalictrum rugosum,Citation13 Thalictrum delavayi,Citation14 Platycapnos spicata,Citation15 and Platycapnos sp.Citation16 TH was shown to have antimicrobial activity, especially toward Mycobacterium smegmatis and Candida albicans.Citation13 Here, we provide evidence that this compound arrests malignant human cell lines in mitosis and induces cell death with a mechanism of action that is distinct from classic MT inhibitors. This is the first time that such an activity has been described for TH.
Results
TH is cytotoxic in various malignant and non-malignant human cell lines
The cytotoxicity of TH () was evaluated against a panel of human prostate cell lines (), including the prostate cancer cell lines LNCaP, C4–2B, DuCaP, and PC-3, and the non-malignant prostate cell lines BPH-1 and WPMY-1 as well as HeLa cervical cancer cells by using a cell viability assay based on metabolic activity. TH inhibited cell viability in different malignant cell lines with similar IC50 values ranging from 0.7 µM in PC-3 cells to 2.5 µM in HeLa cells (). TH exhibited a similar cytotoxic potency in 2 non-malignant but highly proliferative prostate cell lines, BPH-1 (IC50 = 2.0 µM) and WPMY-1 (IC50 = 2.7 µM), suggesting that TH inhibits a process that is critical in proliferating cells. We used the known MT-targeting agent vinblastineCitation17-19 as positive control, which was equally cytotoxic in proliferating malignant and non-malignant cell linesCitation20 (). The inhibitory effect of TH on cell growth was confirmed by real-time monitoring of cell confluence by time-lapse phase contrast microscopy (IncuCyte), which showed that TH induced a concentration- and time-dependent inhibition of cell proliferation in LNCaP cells (). Assessment of the image sequence for morphological changes revealed that TH caused a loss of cell-cell contacts, rounded cell bodies, membrane blebbing, which ultimately led to cell disintegration and are typical signs of cell death through apoptosis ().Citation21,22 TH-induced apoptosis was confirmed by live cell analysis of caspase-3/7 enzyme activity by quantitative fluorescence microscopy in LNCaP cells (). Like vinblastine,Citation23 TH significantly increased the number of caspase-3/7 activity-positive LNCaP cells in a concentration-dependent manner after 48 h of treatment (). Furthermore, like vinblastine and the positive control cytochalasin D (actin inhibitor), TH significantly inhibited the migration of PC-3 cells, as shown by scratch wound assay after 16 h of treatment (). Taken together, TH reduces cell viability, proliferation and migration, ultimately leading to cell death through apoptosis.
Figure 1. TH inhibits proliferation, migration, and induces apoptosis in PCa cells. (A) Chemical structure of thalicthuberine (TH). (B) Analysis of real-time proliferation, as a function of cell confluence (IncuCyte) of TH treated LNCaP cells. DMSO (vehicle) and vinblastine (Vinb) were used as controls (n = 3, mean ± SD, a representative experiment of 3 independent repeats is shown). Phase contrast images for DMSO, TH (2.5 µM), and Vinb (25 nM) treatments are shown for the indicated time points (top right panel), showing visibly less cells and signs of apoptotic cell death (membrane blebbing, rounded cell bodies) in TH and vinblastine treated cells. Scale bar = 100 µm. (C) Live assessment by microscopy and quantitative image analysis of Caspase-3/7 activity in TH- and vinblastine-treated LNCaP cells after 48 h of treatment. Both TH and vinblastine induced apoptosis in a concentration-dependent manner (left panels, n = 3, mean ± SD). Representative images of LNCaP cells. Right panel, merged image: DNA (blue), Caspase 3/7: CellEvent Caspase-3/7 substrate (pink), scale bar = 20 µm. (D) Evaluation of cell migration of TH-treated PC-3 cells. Wound closure was measured by live-cell imaging (IncuCyte) after 16 h of treatment with vehicle control (DMSO), TH, vinblastine (Vinb) or the positive control cytochalasin D (Cytoch) (left panel, n = 2, mean ± SD). Representative wounds after treatment with DMSO, TH and cytochalasin D are shown (right panel).
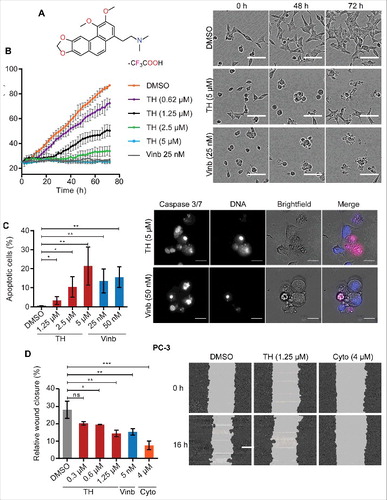
Table 1. Measurement of cytotoxic activity of TH against a panel of human malignant and non-malignant cell lines of the prostate and cervix.
Gene expression profiling of TH-treated LNCaP cells highlights mitotic pathways
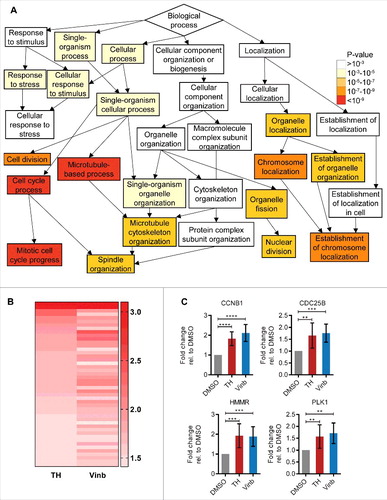
To guide the identification of the molecular target of TH, we performed DNA microarray analysis of LNCaP cells treated for 24 h with a 1 × IC50 dose of TH (batch A) or vehicle (DMSO) and vinblastine (1 × IC50 dose) as controls. Ingenuity Pathway Analysis (IPA) revealed that equipotent concentrations of both TH and vinblastine caused transcriptional changes relative to vehicle control that relate to the cell functions “microtubule dynamics,” “M (mitosis) phase,” and “alignment of chromosomes.” GOrilla (Gene Ontology enRIchment anaLysis and visuaLizAtion tool) analysis revealed that the genes differentially affected by TH and vinblastine are linked to processes like “mitotic cell cycle progress,” “establishment of chromosome localization” or “microtubule-based process” ( and Fig. S1). Moreover, a direct comparison between TH and vinblastine revealed that most of differentially expressed genes show the same directionality of up- and downregulation, as summarized by the heatmap of the fold changes (). The TH-mediated differential expression of critical cell cycle genes (e.g., CDC20, AURKA, CCNB1, and HMMR) was identified by microarray (Table S1). We also observed a downregulation of the expression of α-tubulin (TUBA3C, TUBA3D, and TUBA3E), suggesting that TH affects tubulin expression and might alter MT function.Citation24 The upregulation of CCNB1 and HMMR mRNA expression was confirmed by qRT-PCR, so was that of the mitotic regulators CDC25B and PLK1, ().
Figure 2. Treatment of LNCaP cells with TH leads to deregulation of mitotic processes. (A) GeneOntology analysis of DNA microarray data (GOrilla) revealed “microtubule-based process,” “cell cycle process,” and “mitotic cell cycle process” as top enriched molecular pathways within the set of differentially expressed genes after 24 h of TH treatment (1 × IC50) in LNCaP cells. (B) Heatmap depicting the fold changes of genes differentially expressed (P value ≤ 0.1, fold-change of ≥ 1.4) in LNCaP cells after 24 h treatment with TH (1 × IC50) or vinblastine (Vinb, 1 × IC50). Red indicates upregulation. The darker the shade of color, the higher the fold-change of expression. (C) Validation of differential expression of critical cell cycle genes by qRT-PCR (n = 3, mean ± SD) in LNCaP cells treated for 24 h with TH (1 × IC50) or vinblastine (Vinb, 1 × IC50), confirming their upregulation.
TH causes a reversible arrest in mitosis leading to asymmetric divisions and cell death
Planar compounds with similar structure as TH have been shown to interact with DNA via intercalation, leading to DNA damage.Citation25 To determine whether TH interacts directly with DNA, we measured the DNA melting temperature and displacement of a fluorescent DNA intercalator in a titration experiment with TH (Fig. S2A). Yet, TH did not change the DNA melting temperature, suggesting that TH does not intercalate or interact with DNA. Furthermore, quantitative analysis of the DNA double-strand break (DSB) marker γH2AXCitation26 in LNCaP cells revealed that TH did not increase the number of DSBs after 24 h (and 48 h, data not shown) of treatment when compared with control (Fig. S2B). Together, these results indicate that TH does not interact with DNA or causes DNA damage via DSBs.
The observed similarities between TH and the mitotic inhibitor vinblastine prompted us to investigate cell cycle progression. Cell cycle analysis by flow cytometry of LNCaP cells revealed that TH led to a significant concentration-dependent increase in the population of cells in the G2-M phase, as well as cell death (sub G0-G1 phase, ) after treatment of 24 h.
Figure 3. TH causes accumulation of cells in mitosis. (A) Cell cycle was analyzed by flow cytometry. TH arrests LNCaP cells in the G2-M phase in a concentration-dependent manner after 24 h (upper left panel). DMSO and vinblastine were used as controls (left panel, n = 4, mean ± SD, statistical data in Table S2). Representative histograms for DMSO and TH are shown (lower panel). TH treatment of LNCaP cells (24 h) leads to cell death (upper right panel, sub G0-G1 cell population, n = 3, mean ± SD). (B) Quantitative immunofluorescence microscopy of PHH3 expression (mitosis marker) revealed that TH and vinblastine caused a concentration-dependent increase of PHH3-positive LNCaP cells after 24 h (n = 3, mean ± SD). (C) Immunofluorescence microscopy coupled with automated image analysis (CellProfiler) was used to quantify PHH3-positive (mitotic) LNCaP cells (∼3,000 cells/treatment) after the indicated treatment conditions (n = 2, mean ± SD). TH (1.25–10 µM) and vinblastine (10 and 20 nM) induced a significant increase in PHH3-positive cells when treated for after 8 h (blue bars). Longer treatment (24 h, orange bars) further increased the proportion of PHH3-positive cells. Removal of TH (1.25 and 2.5 µM) and vinblastine (10 and 20 nM) after 8 h of treatment followed by 16 h of recovery decreased the number of PHH3-positive cells to levels seen in vehicle control (DMSO). Two-ways ANOVA with Sidak's multiple comparisons test was used (ns = non-significant, *** P < 0.001, **** P < 0.0001; blue label = statistical comparison to DMSO 8 h). (D) LNCaP cells were subjected to the same treatment modalities as described in C, and cell viability was measured after 72 h (alamarBlue, n = 2, mean ± SD). Intermittent treatment with TH (24 h) did not significantly reduced cell viability compared with continuous treatment (72 h). Two-ways ANOVA with Sidak's multiple comparisons test was used (ns = non-significant, ** P < 0.01, *** P < 0.001).
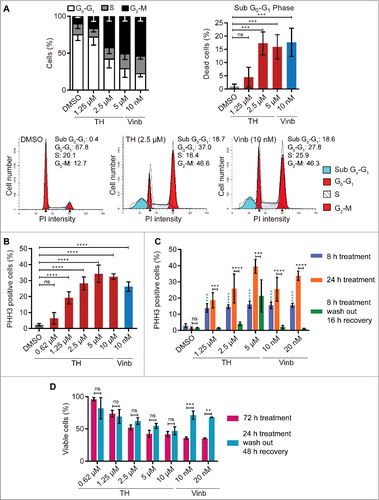
To distinguish whether TH caused a cell cycle arrest in G2 or mitosis, we measured the number of LNCaP cells expressing the mitosis marker phospho-Ser10 histone 3 protein (PHH3)Citation27 by quantitative fluorescence microscopy. In a similar fashion as the mitotic inhibitor vinblastine, TH induced a concentration-dependent increase in the number of PHH3-positive LNCaP cells after 24 h of treatment (), which was detectable as early as 8 h (). Inspection of the images revealed that TH-treated LNCaP cells displayed morphological hallmarks typical of mitotic cells (cell rounding and condensation of chromatin, and Fig. S3). Notably, like vinblastine,Citation28 the TH -mediated mitotic block was reversible when cells were temporarily treated for 8 h, washed with fresh media, and left to recover for 16 h (wash-out experiments, ). However, unlike vinblastine, cells treated for a longer period with TH (24 h) before inhibitor removal (recovery for 48 h in fresh media), cell viability was as negatively impacted as when cells were treated continuously for 72 h (), suggesting that TH's effect on LNCaP cell after 24 h of exposure became irreversible.
To better characterize TH-mediated mitotic arrest, we studied the time cells required for completion of mitosis and fate of mitosis-arrested cells using time-lapse microscopy of HeLa cells expressing H2B-GFP (). DMSO-treated HeLa cells normally progressed through mitosis with a mean time of 67.4 ± 32.4 min, followed by cytokinesis (87.1% bipolar division leading to 2 daughter cells, ). HeLa cells treated with TH exhibited a significantly prolonged time in mitosis from 475.4 ± 253.8 min (1.25 µM) to 657.1 ± 203.1 min (5 µM) in a concentration-dependent manner and similar to vinblastine (10 nM: 398.8 ± 270.3 min, 20 nM: 559.8 ± 210.7 min). As shown in Videos S2, S3 and , TH-treated cells failed to properly congress and align their chromosomes at the metaphase plate (monopolar and multipolar phenotypes), resulting in a concentration-dependent increase in asymmetric divisions (mostly 3 or 4 daughter cells) or apoptosis.Citation29 HeLa cells that underwent anaphases with completed karyokinesis and cytokinesis (into 3 or more daughter cells) frequently fused into single multinuclear cells (, Videos S1–S3).Citation30 A similar phenomenon was observed when HeLa cells were treated with vinblastine (Video S1, ).
Figure 4. TH induced mitotic arrest is leading to asymmetric cell division and cell death. (A) Quantitative analysis of images acquired by time-lapse microscopy (Olympus IX81, 10 × , 1 image/5 min for 24 h) showed that TH and vinblastine significantly increased the time HeLa-H2B-GFP cells spent in mitosis (left panel). The cell fate (bipolar division, asymmetric division or apoptosis) was quantitatively assessed after 24 h of treatment (right panel, n = 2, mean ± SD). Representative images of cells treated with TH (2.5 µM) and DMSO. Black arrows indicate cells displaying signs of asymmetric division and fusion. Red arrows point at cells dying. Scale bar = 20 µm. (B) Tracking of cell fate of cells that underwent asymmetric division. Representative image of HeLa-H2B-GFP cells treated with TH (2.5 µM) and tracked for 106 h using real-time live-cell imaging (IncuCyte 10 × , 1 image/2 h for 144 h). White arrows indicate cells going through asymmetric division, fusion and dying in mitosis. Red arrows mark cells that die in an interphase-like state after 2 consecutive rounds of asymmetric division separated by a cell fusion event. Yellow arrows indicate cells going through asymmetric division, fusion and dying in an interphase-like state. Scale bar = 50 µm. For more details, see Videos 1–3.
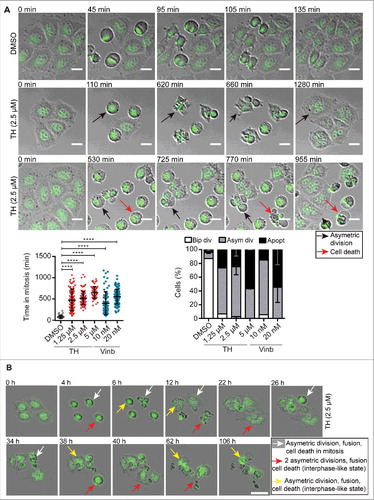
Furthermore, the cell fate of asymmetrically divided HeLa-H2B-GFP after TH treatment was analyzed by time-lapse microscopy. As depicted in , some first generation daughter cells derived from asymmetric divisions died in an interphase-like state without entering another round of division, whereas other daughter cells died during the next cell cycle round, or went through another round of asymmetric division, after which second generation offspring failed to divide further and died in an interphase-like state.
The mitotic spindle organization is perturbed by TH
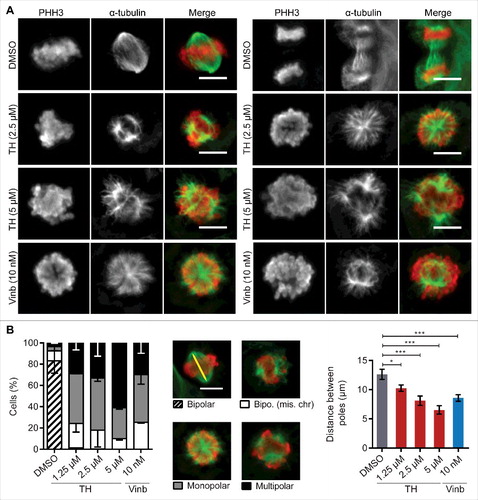
The above observations that TH causes transcriptional changes to pathways involved in chromosome segregation, mitotic delay and asymmetric cell division prompted us to investigate if TH affects mitotic spindle organization, which is known to cause similar effects when disturbed.Citation31 We used immunofluorescence microscopy of PHH3 and α-tubulin expression in LNCaP cells treated for 24 h with 1.25–5 µM of TH to score phenotypic differences and measure the distance between spindle poles in bipolar cells. TH induced a complete loss of cells with normal bipolar spindle organization and metaphase plate alignment of chromosomes [the dominant phenotype of vehicle-treated control cells (DMSO)] and increased levels of MT spindle abnormalities like bipolar spindles with misaligned chromosomes, monopolar and multipolar spindles ( and ). Notably, TH-treated LNCaP cells featuring the multipolar spindle phenotype increased in a dose-dependent manner with a concomittant reduction in bipolar spindles with misaligned chromosomes and monopolar spindles (). Vinblastine generated similar types and frequencies of MT spindle abnormalities as TH ( and ). In addition, TH induced a dose-dependent reduction of the distance between spindle poles in cells with bipolar spindles (). Together, these results demonstrate that TH disrupts the normal organization of mitotic spindles.
Figure 5. TH disrupts the mitotic spindle organization. (A) TH and vinblastine-treated LNCaP cells (24h) were subjected to immunofluorescence microscopy of α-tubulin (green) and PHH3 (red) with an INCell 2200 automated microscope (20 ×). Representative images (top panel) of abnormal metaphase aligments of chromosomes (PHH3 staining, red) and spindle pole organization (α-tubulin staining, green) are shown (scale bar = 10 µm). (B) Quantification by scoring phenotypic differences (bottom left panel, ∼400 cells/treatment) and measuring the distance between spindle poles (bottom right panel, ∼120 cells/treatment, yellow line) in bipolar cells are based on α-tubulin and PHH3 staining (n = 3, mean ± SD).
TH reduces cellular tubulin polymer mass
Mitotic arrest and abnormal mitotic spindle organization are typical phenotypes induced by MT-targeting agents like vinblastine and paclitaxel.Citation31 To determine if TH directly interacts with tubulin and affects tubulin polymersization, we performed a MT assembly assay with purified components in a cell-free system.Citation32 As expected, vinblastine inhibited tubulin polymerization whereas the MT-stabilizing molecule paclitaxel increased polymerization. At all doses tested (25 µM–200 µM), TH did not have an effect on tubulin polymerization (). To test the possibility that TH might indirectly interfere with MT polymerization, we measured cellular tubulin polymer mass by quantitative immunofluorescent microscopy of cellular α-tubulin staining.Citation23,33 When used at high doses (7–30 × IC50), paclitaxel stimulates MT polymerization and vinblastine induces depolymerization of MT.Citation7 Similarly to vinblastine, TH visibly disrupted the cellular MT network in LNCaP cells, leading to reduced cellular tubulin polymer mass in a dose-dependent manner ().
Figure 6. TH treatment leads to reduced cellular tubulin polymer mass and shortened MT tracks. (A) TH did not affect tubulin polymerization in a cell-free system, while vinblastine (Vinb) inhibited and paclitaxel (Paclit) stimulated polymerization. A representative experiment (n = 3) is shown. (B) High-dose treatment of LNCaP cells (24 h) with TH or vinblastine reduced cellular tubulin polymer mass, while paclitaxel increased tubulin polymer mass (top right panel), as shown by quantitative immunofluorescence microscopy of the mean intensity fold-change of α-tubulin relative to DMSO control (n = 3, mean ± SD). Representative images are shown (lower panel), illustrating disrupted cytoplasmic MT networks. Scale bar = 10 µm. (C) HeLa-EB1-GFP cells treated with TH or vinblastine (2 h) were imaged by spinning disk microscopy. EB1 comets were tracked and analyzed, and mean fold-change of displacement length of EB1 tracks was calculated relative to DMSO control. Like vinblastine, TH inhibited the growth of MTs in HeLa cells, as shown by reduced EB1 tracks in maximum intensity projections of EB1 comets (scale bar = 10 µm). For more details, see Videos 4−6.
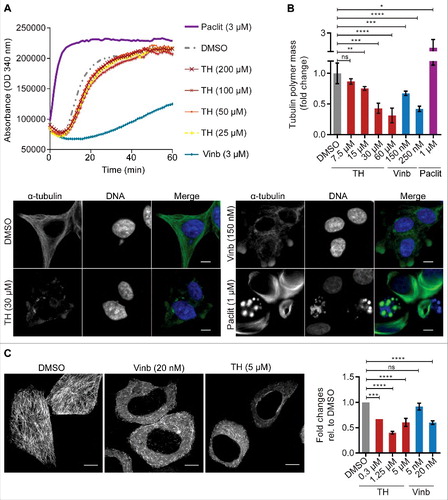
MT are highly dynamic protein structures that grow and shrink very rapidly. The rate of polymerization (growth) and of depolymerization (shortening) of polymers is used to describe MT dynamics. Because they interact with MT and cause their depolymerization, MT destabilizing agents like vinblastine are known inhibitors of MT dynamics.Citation17 To test if TH as an effect on MT dynamics, we treated HeLa cells expressing the end-binding protein (EB1-GFP) with TH and tracked EB1 comets using real-time spinning disk microscopy. EB1 is a protein that binds to the plus end of the growing MT but dissociates during the depolymerization phase.Citation34 Hence, EB1 is a useful tool to track polymerizing MTs and measure changes to MT dynamics.Citation35 TH visibly disrupted directional MT growth, as exemplified by maximum intensity projections of the EB1 comet time-lapse sequences ( and Video S4). Quantitative analysis of the time-lapse videos showed that TH significantly reduced the displacement length of the EB1 tracks in a concentration-dependent manner when compared with vehicle control ().
Taken together, the above results suggest that, in our experimental conditions, TH disrupted MT dynamics and induced destabilization of the cellular MT network in cells via a mechanism that does not involve direct interaction of TH with tubulin and might involve tubulin associated factors.
Mitotic arrest mediated by TH is phenotypically different to inhibitors of Aurora A kinase and Polo-like kinase-1
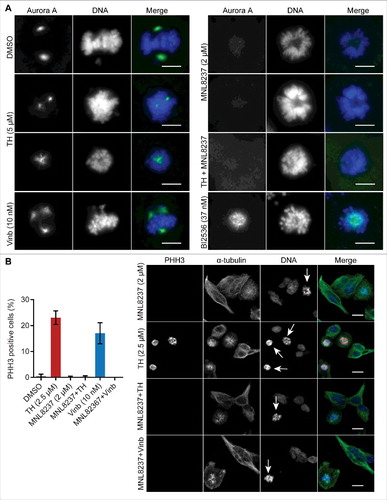
Aurora kinase A (Aurora A) and Polo-like kinase 1 (Plk1) are critical regulators of mitosis, and their inhibition has been shown to cause defective spindle organization.Citation36,37 Immunofluorescence microscopy revealed that the Aurora A inhibitor MNL8237 alone or in combination with TH strongly suppressed the distinct Aurora A staining at the spindle poles which was visible in LNCaP cells treated with vehicle, vinblastine or TH (). Furthermore, quantitative analysis of PHH3 staining revealed that LNCaP cells treated with MNL8237 or the combination of TH and MNL8237 yielded less PHH3-positive cells and round cells with condensed DNA than single agent treatment with TH (). Serine 10 of Histone H3 is a specific target site of Aurora B for phosphorylation,Citation38 and MNL8237 has been shown to inhibit Aurora B activity,Citation39,40 providing a likely explanation for the loss of PHH3 staining in cells treated with MNL8237.
Figure 7. The mitotic inhibitors MNL8237 (Aurora kinase A inhibitor) and TH generate different phenotypes. (A) LNCaP cells treated with TH and the Aurora kinase A inhibitor MNL8237 for 24 h were subjected to immunofluorescence microscopy of Aurora A (green) and DNA (blue) with a DeltaVision Elite microscope (60 ×). As controls, cells were treated with the Plk1 inhibitor BI2536, vinblastine (Vinb, 10 nM), or vehicle control (DMSO). MNL8237 inhibited localization of Aurora A at the spindle poles, which was not affected by TH or BI2536. Representative images are shown. Scale bar = 10 µm. (B) Immunofluorescence microscopy coupled with automated image analysis was used to quantify PHH3-positive LNCaP cells after the indicated treatment conditions (left panel, n = 2, mean ± SD). Combination of TH and MNL8237 or vinblastine (Vinb) and MNL8237 generated the same phenotypes as MNL8237 treatment alone, including a loss of PHH3 expression. Representative images are shown (left panel), DNA (blue), α-tubulin (green), and PHH3 (pink). Mitotic cells are indicated by an arrow (strong nuclear condensed chromatin and a round cell morphology). Scale bar = 20 µm.
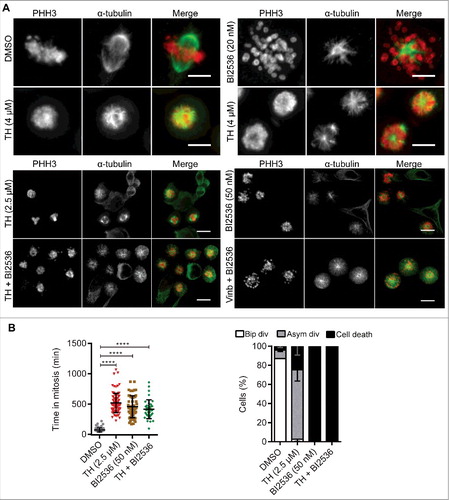
Treatment of LNCaP cells with the Plk1 inhibitor BI2536 induced the formation of monopolar spindlesCitation36 often with dispersed chromosomes at the cell periphery (). As described in , TH treatment resulted in cells with monopolar and multipolar spindles and well congressed chromosomes. The combination of TH or vinblastine with BI2536 produced largely cells with monopolar spindles and dispersed chromosomes (). Time-lapse microscopy of HeLa cells expressing H2B-GFP showed that cells treated with both compounds significantly delayed mitosis (TH: 523.2 ± 218.1 min and BI2536: 456.3 ± 181.3 min, ). Finally, quantitative assessment of the HeLa H2B-GFP cell fate after single or combination treatment indicated that BI2536 alone or together with TH caused 100% cell death of HeLa H2B-GFP cells, whereas TH predominantly resulted in asymmetric cell division and only 24.8% cell death ().
Figure 8. The Plk1 inhibitor BI2536 and TH generate different phenotypes. (A) LNCaP cells treated with 2 mitotic inhibitors, TH or BI2536 (Plk1 inhibitor), for 24 h were subjected to immunofluorescence microscopy of α-tubulin (green) and PHH3 (red) with a DeltaVision Elite microscope (60 ×, upper panel, scale bar = 10 µm) or an INCell 2200 (20 ×, lower panel, scale bar = 20 µm). As controls, cells were treated with vinblastine (Vinb, 10 nM) or vehicle control (DMSO). BI2536 inhibited spindle pole organization and predominantly generated cells with monopolar spindles and peripheral chromosome configurations, while TH generated heterogeneous spindle pole abnormalities (monopolar, bipolar and multipolar) with visibly congressed chromosomes. Cells treated with a combination of TH and BI2536 exhibited the BI2536-like phenotype. Representative images are shown, scale bar = 20 µm. (B) Quantification of time-lapse microscopy showed that TH and BI2536 increased the time HeLa-H2B-GFP cells spend in mitosis (left panel). The cell fate after 24 h (bipolar division, asymmetric division or cell death) was quantitatively assessed and showed that BI2536 alone or in combination with TH exclusively induced cell death, while TH as single treatment caused asymmetric divisions and cell death (right panel, ∼100 cells/treatment, n = 2, mean ± SD). One-way ANOVA with Turkey's multiple comparisons test was used (ns = non-significant, ** P < 0.01, **** P < 0.0001). See Video 3 for more details.
Taken together, the different morphological phenotypes induced by MNL8237 and BI2536 strongly suggests that TH does not target Aurora A or Plk1 and that the activity of TH's target is critical in mitosis after that of both kinases.
Tubulin mutations, MT alterations and overexpression of P-gp do not confer resistance to TH
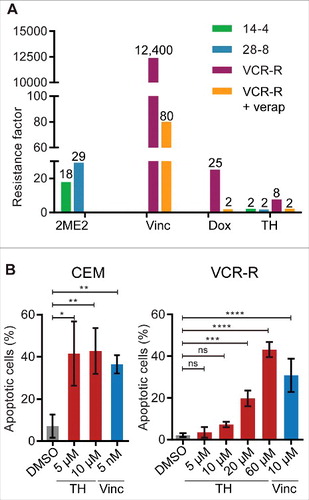
Despite the success of MT inhibitors in the clinic, patients develop resistance to treatments.Citation31 Next, we tested if TH is affected by known resistance mechanisms that reduce cytotoxicity of vinca alkaloids and 2-methoxyestradiol (2ME2). The human T-cell acute lymphoblastic leukemia cell lines CEM/2ME2–14.4R and CEM/2ME2–28.8R cells have acquired βI-tubulin mutations in the colchicine binding pocket,Citation41 making them resistant to 2ME2, as shown by the resistance factors (RF) of 17.9 and 29.2, respectively, when compared with the parental CEM line ( and ). The vincristine-resistant CEM/VCR-R cells (RF = 12,400, and ) have acquired multiple MT alterations (e.g., mutations in βI-tubulin, altered expression of β-tubulin isotypes)Citation42 and overexpression of P-glycoprotein (P-gp), thereby rendering cells multidrug-resistant to non-MT-targeting inhibitors such as doxorubicin,Citation43 daunorubicin, actinomycin D,Citation44 and tetracycline.Citation45 As shown in and , the cytotoxic potency of TH remained largely unaffected in all 3 resistant cell lines when compared with parental cells (RF: CEM/2ME2–14.4R = 2.2, CEM/2ME2–28.8R = 1.7, CEM/VCR-R = 7.7). Consistent with a 7.7-fold decrease in cytotoxicity, a 6 to 12-fold higher dose of TH (5–10 µM versus 60 µM) was required to induce similar levels (∼40%) of caspase 3/7 activity (apoptosis) in VCR-R cells (). For comparison, a 2000-fold higher dose of vincristine was required in VCR-R cells when compared with parental cells (). To study the implication of the P-gp in the observed resistance of CEM/VCR-R cells to TH, the multidrug efflux pump was inhibited with verapamil.Citation46 VCR-R cells were almost completely re-sensitized to doxorubicin (RF = 2.0) and TH (RF = 2.3) when co-treated with verapamil, indicating that the observed modest resistance to TH (RF = 7.7) was P-gp mediated and that TH was potentially a weak substrate of P-gp ( and ).
Table 2. Cytotoxicities of TH remains largely unaffected in cell lines with resistance to microtubule inhibitors and express multidrug resistance.
Figure 9. TH is insensitive to resistance mechanisms induced by MT inhibitors (vinca alkaloids and 2ME2). (A) Parental cells CEM (CEM), 2-methoxyestradiol (2ME2) resistant cell lines CEM/2ME2–14.4R (14–4) and CEM/2ME2–28.8R (28–8), and the vincristine (Vinc) resistant cell line CEM/VCR-R (VCR-R) were treated with 2ME2, Vinc, or TH for 72 h and cell viability was measured using a metabolic assay (alamarBlue, n = 3). Results were expressed as resistance factor (RF), which was calculated from the quotient of IC50 (drug-resistant cell line) and IC50 (parental CEM cells). TH activity remained largely unaffected in all 3 resistant cell lines when compared with CEM parental cells. The involvement of the P-glycoprotein (P-gp) in resistance observed in the CEM/VCR-R (VCR-R) cell line, was assessed by co-treatment with the P-gp inhibitor verapamil (verap). As control, cells were treated with the P-gp substrate doxorubicin (Dox). Co-treatment with verapamil almost completely re-sensitized CEM/VCR-R cells to TH and doxorubicin, suggesting that TH activity is not affected by mutation in the vinca alkaloid pocket on tubulin. (B) Live assessment by microscopy and quantitative image analysis of caspase-3/7 activity in TH- and vincristine-treated CEM and CEM/VCR-R (VCR-R) cells after 24 h of treatment (n = 3, mean ± SD). Similar doses of TH were necessary to induce apoptosis in both cell lines, while 2,000-fold higher dose of vincristine was required in VCR-R cells when compared with CEM cells.
Taken together, resistance mechanisms induced by chronic treatment with vinca alkaloidsCitation42,44,45 or 2ME2Citation41 did not confer cross resistance to TH, highlighting the potential of TH as second line treatment.
Discussion
In this work we investigated the mechanism of action of TH, a natural product isolated from the Australian endemic plant Hernandia albiflora. We provided evidence that this small molecule inhibitor is a novel anti-mitotic agent in prostate and cervical cancer cells and that TH evades clinically relevant resistance mechanisms, which render MT inhibitors and other chemotherapeutic drugs inefficient. This is the first report of a detailed mechanism of action study for TH.
In a similar fashion as MT-targeting agents (stabilizers and destabilizers), TH anti-proliferative action at low concentration was mainly due to a mitotic block at the metaphase-anaphase transition.Citation31 Cells exhibited aberrant mitotic spindles, inhibition of chromosome congression induced by suppression of MT dynamics, and ultimately cell death. We also observed that a large proportion of cells underwent asymmetric divisions into 3 or 4 daughter cells, which was TH dose-dependent. Ganem et al. tracked different types of cancer cells (including HeLa cells) using long-term live cell imaging and reported that approximately 3% of HeLa cells went through multipolar divisions and that the resulting mono- and poly-nucleated progenies had several different fates.Citation47 Most cells would die during mitosis or in an interphase-like state. In rare cases, some cells completed a second round of division, generating mostly unviable daughter cells. Aneja et al. also described an “apoptosis-reluctant population” that underwent aberrant cytokinesis.Citation48 Some cells died in mitosis while others died after abnormal exit from mitosis. MT-targeting drugs are well-known to induce mitotic slippage, arrest in G1 phase and apoptosis.Citation49 We hypothesize that TH's cytotoxicity is mediated through 2 mechanisms: a short-term effect, by killing cells directly in mitosis and a long-term effect by inducing genetic instability (aneuploidy), ultimately leading to cell death.
Depending on their effect on MTs at high, micromolar concentrations, MT-targeting agents are categorized into MT-stabilizing compounds (e.g., taxanes) and MT-destabilizing compounds (e.g., vinca alkaloids). We observed that TH inhibited MT dynamics in LNCaP and HeLa cells and, like vinblastine, reduced tubulin polymer mass and destabilized the cellular MT network in LNCaP cells. However, in a cell-free assay, TH did not affect tubulin polymerization, raising the possibility that TH does not directly interact with tubulin. The MT7 compound has a planar structure (like TH) and was shown to induce similar phenotypes: aberrant mitotic spindle organization, disruption of cellular MT networks without directly affecting tubulin polymerization in a cell-free assay.Citation50 Zhang and coworkers proposed that weak activity (low micromolar IC50 in a panel of cancer cells) or low binding affinity for tubulin prevented a full elucidation of the mechanism of action of this compound.Citation50 They designed a series of analogs and reported a compound with a 10-fold increase in activity that was shown to bind to the colchicine binding site and inhibit MT polymerization in a cell-free assay.Citation51 Ohira et al. described 2 analogs based on a different scaffold (NP-10 and NP-14) that arrested cells in mitosis with abnormal mitotic spindles, yet, only the most potent compound, NP-14, inhibited tubulin polymerization in a cell-free assay.Citation52 The authors observed some differences in the number of centrosomes in cells treated with the 2 analogs, however, the molecular target(s) of NP-10 remains unknown.Citation52
We addressed the possibility that Aurora A or Plk1 are molecular targets of TH. Plk1 plays a major role in mitosis progression, with a broad range of functions.Citation53 However, the effect of TH (multipolar spindles with congressed chromosomes, asymmetric divisions) was phenotypically different to that of Plk1 inhibitor BI2536 and Aurora A/B inhibitor MNL8237. Combination of the Plk1 inhibitor BI2536 and TH prevented the establishment of the TH phenotype, suggesting that the activity targeted by TH is critical at a later stage of mitosis than Plk1. In a similar manner, combination of TH and the Aurora A/B inhibitor MNL8237 prevented the manifestation of the TH phenotype and suggests that TH's mitotic target is downstream of Aurora A and B. It is important to note that BI2536 and MNL2536 also prevented the establishment of the vinblastine phenotype in combination treatments.
These results in combination with the disruption of the cellular mitotic network advocate that MT function is the major target of TH action. Cell-free assays as shown for tubulin polymerization are simplified systems with purified components that lack the complexity found in cells, like the absence of MT associated proteins (MAPs) integrating MT function with MT-dependent cellular processes. Indeed, multiple factors can affect polymerization of MTs in cells, like MAPs,Citation54 stathmin family proteins,Citation55 and tubulin modifications, like the deacetylation of α-tubulin by HDAC6,Citation56 or phosphorylation of β-tubulin by Cdk1.Citation57 Furthermore, Wignall et al. reported a screening of 1561 compounds (purine derivatives) on Xenopus Egg Extract and showed that 15 molecules destabilized MTs without direct binding to tubulin (using quantitative pelleting assay).Citation58 It is therefore possible that TH indirectly inhibits cellular MT polymerization and dynamics through binding to MAPs or transient tubulin modifications and that such complexity is unlikely present in a cell-free assay system with purified components.
In summary, TH is a novel mitotic inhibitor that destabilizes cellular tubulin polymers and suppresses MT spindle dynamics, resulting in mitotic cell cycle arrest and induction of apoptotic cell death. Understanding clinical relevant resistance mechanisms is a key element in the development of novel, more potent MT-targeted compounds. Importantly, our discovery that TH remains largely unaffected by tubulin alterations or overexpression of P-gp that generate resistance to vinca alkaloids, 2-ME2 and multidrug resistance to non-MT chemotherapeutic drugs (e.g., doxorubicin,Citation43 daunorubicin, actinomycin D,Citation44 and tetracycline),Citation45 provides a strong rationale to further develop TH as potential therapeutic against tumors that display these resistance mechanisms. The relative simple chemical structure and relative ease of total chemical synthesis of TH are another favorable characteristic of this small molecule inhibitor.Citation59,60 Therefore, further studies with more potent semi-synthetic analogs are warranted to provide more insights into TH's target(s), offering a promising starting point for the development of new anti-mitotic therapeutics.
Material and methods
Isolation of TH
Thalicthuberine (TH) was isolated from the Australian endemic plant Hernandia albiflora (twigs) using reversed phase HPLC. Hernandia albiflora was part of our pre-fractionated library which was screened for cytotoxic activity toward the LNCaP cell line using a metabolic assay.Citation61 TH was isolated in 2 batches, and the first batch (batch A, IC50 = 17 µM in LNCaP cells) was less active than the second batch (batch B, IC50 = 2 µM in LNCaP cells). Both batches were shown to be >95% pure by NMR and LCMS and produced similar phenotypes in LNCaP cells (Fig. S3). If not stated otherwise, Batch B was used for the experiments.
Reagents
Vinblastine, verapamil, 2-methoxyestradiol (all Sigma Aldrich), vincristine (Selleckchem), doxorubicin (Selleckchem), paclitaxel (Cytoskeleton), were resuspended in DMSO (Sigma Aldrich) and stock solutions were stored at −20°C.
Cell lines
LNCaP (lymph node metastasis), C4–2B (LNCaP-derivative) and PC-3 (metastatic prostate cancer) cells were obtained from the American Type Culture Collection (ATCC). BPH-1 (human benign prostatic hyperplasia) and WPMY-1 (human prostatic stromal myofibroblast) cells were kind gifts from J. Clements (Queensland University of Technology, Australia). All cells were cultured in phenol-red free RPMI-1640 medium supplemented with 5% FBS (Thermo Fisher Scientific). DuCaP (metastatic prostate cancer) cells were a generous gift from M. Ness (VTT Technical Research Center of Finland), and cultured in in phenol-red free RPMI-1640 medium supplemented with 10% FBS (Thermo Fisher Scientific). Cells were genotyped at the DNA Diagnostic Center (Cincinnati, USA). HeLa-H2B-GFP (cervical cancer, pBOS-H2BGFP, BD Biosciences) and HeLa-EB1-GFP (EB1-GFP (JB131), Addgene) were made by Professor Gabrielli (University of Queensland, Australia), and were cultured in DMEM medium supplemented with 10% FBS (Thermo Fisher Scientific). Human T-cell acute lymphoblastic leukemia (T-ALL) cell lines CCRF-CEM (CEM) and its drug-resistant sublines CEM/VCR-R,Citation42,44 CEM/2ME2–14.4R and CEM/2ME2–28.8RCitation41 were supplied by Professor Kavallaris (Children's Cancer Institute, University of New South Wales). Cells were cultures in RPMI-1640 medium supplemented with 5% FBS. All cell lines were kept at 37°C in an atmosphere containing 5% CO2, maintained in log phase growth and were routinely screened for mycoplasma.
Assessment of cell viability and proliferation
LNCaP (4,000 cells/well), C4–2B (3,000 cells/well), PC-3 (3,000 cells/well), HeLa (2,000 cells/well), DuCaP (15,000 cells/well), BPH-1 (3,000 cells/well), and WPMY-1 (2,000 cells/well) cells were seeded in 96-well plates for 24 h. Cell viability as a function of metabolic activity was measured by alamarBlue end point assay (Thermo Fisher Scientific https://www.thermofisher.com/order/catalog/product/DAL1025) after 72 h of treatment following supplier's instructions. The non-adherent T-ALL cell lines were seeded in 96-well plates (20,000 cells/well) and treated at the same time with the indicated compounds for 72 h. Cell proliferation as a function of cell confluence was evaluated using live-cell imaging (IncuCyte, Essen BioScience) as described before.Citation61
Cell cycle analysis by flow cytometry
LNCaP cells were plated in 6-well plates (150,000 cells/well) for 24 h and treated with the indicated compounds for 24 h. Cell cycle experiments were conducted as described previously,Citation62 using 10 µg/ml propidium iodide (Sigma Aldrich http://www.sigmaaldrich.com/catalog/product/sial/p4864?lang=enandregion=AU) to stain DNA. Briefly, samples were analyzed on a FACSCanto (BD Biosciences), where 20,000 events were counted after exclusion of cell doublets and polyploid cell populations. DNA histograms were analyzed using ModFit LT software (Verity Software House).
Microarray gene expression profiling
LNCaP were seeded for 24 h in a 6-well plate (150,000 cells/well) and treated with batch A of TH (1 × IC50) or vinblastine (1 × IC50) for 24 h before RNA extraction and processing as described previously (https://www.qiagen.com/fi/shop/rnai/RNeasy-Mini-Kit#orderinginformation).Citation63,64 For gene expression profiling, 3–4 repeats of each treatment were analyzed on a custom 180k Agilent oligo microarray (ID032034, GPL16604). Raw data were processed using the Agilent Feature Extraction Software (v10.7) and the LIMMA packageCitation65 in R as described before.Citation64 Differential expression between treatment and vehicle control (DMSO) was classified based on an FDR-adjusted P value of ≤ 0.1 and an average fold-change of ≥ 1.4. Expression data have been submitted to Gene Expression Omnibus (GEO) with the accession number GSE83459. Lists of differentially expressed genes were examined using Ingenuity Pathway Analysis (IPA, Ingenuity Systems Inc.) and GOrilla (Gene Ontology enRIchment anaLysis and visuaLizAtion tool)Citation66 for functional annotation and network analysis.
Quantitative real time polymerase chain reaction (qRT-PCR)
RNA samples were generated as described above and processed as reported previously.Citation62 qRT-PCR was performed with SYBR Green PCR Master Mix (Thermo Fisher Scientific https://www.thermofisher.com/order/catalog/product/4309155) using a 7900HT Fast Real-Time PCR System (Applied Biosystems). Changes in mRNA expression levels were calculated based on the ΔΔCt method, normalized relative to RPL32 expression and expressed as fold-change relative to control (DMSO). Primer sequences (Fwd: forward sequence, Rev: reverse sequence): RPL32 (Fwd: 5′-GCACCAGTCAGACCGATATG-3′, Rev: 5′-ACTGGGCAGCATGTGCTTTG-3′), CCNB1 (Fwd: 5′-AGAGCCATCCTAATTGACTG-3′, Rev: 5′-CAACCAGCTGCAGCATCTTC-3′), CDC25B (Fwd: 5′-AGCGAAACCCCAAAGAGTCAGGT-3′, Rev: 5′-AGCAGCCTCACCGGCATAGACT-3′), PLK1 (Fwd: 5′-TGCCCTACCTACGGACCTGG-3′, Rev: 5′-AAGTTGATCTGCACGCTGCC-3′), HMMR (Fwd: 5′-CTACCTTGCCTGCTTCAGCT-3′, Rev: 5′-AGCTGAAGCAGGCAAGGTAG-3′).
Immunofluorescence microscopy
LNCaP cells were seeded (5,000 cells/well) for 24 h in poly-L-ornithine (Sigma-Aldrich http://www.sigmaaldrich.com/catalog/product/sigma/p4957?lang=enandregion=AU) coated optical 96-well plates (ibidi).Citation67 After the indicated times and concentrations of treatment, cells were fixed with ice-cold methanol for 3 min, incubated in blocking buffer [2% bovine serum albumin (Sigma Aldrich http://www.sigmaaldrich.com/catalog/product/sigma/a9418?lang=enandregion=AU) in TBS with 0.1% Triton X-100] for 30 min at room temperature before immunostaining for 1 h at room temperature with primary antibodies. Primary antibodies against phosphor-Ser10 histone H3 (ab5176, Abcam, 1:1,000 http://www.abcam.com/histone-h3-phospho-s10-antibody-chip-grade-ab5176.html) and α-tubulin (DM1A, ab7291, Abcam, 1:500 http://www.abcam.com/α-tubulin-antibody-dm1a-loading-control-ab7291.html), and gamma H2AX (phospho S139, kind gift of Associate Professor Derek Richard, Queensland University of Technology, Australia) were used. DNA was counterstained with 1 µg/mL DAPI (4′,6-diamidino-2-phenylindole, Sigma Aldrich http://www.sigmaaldrich.com/catalog/product/roche/10236276001?lang=enandregion=AU). Cells were imaged using a Cytell or INCell 2200 automated imaging systems (GE Healthcare) and analyzed using the CellProfiler software (Broad Institute, Cambridge, USA)Citation68 as described before (∼4,500 cells/treatment).Citation23 Analysis of spindle organization (∼400 cells/treatment) and the distance between spindle poles (∼120 cells/treatment) were performed using the Fiji software.Citation69
Washout experiments
LNCaP cells were seeded as described above in poly-L-ornithine coated plates. Cells were treated with the indicated concentration of compounds for 8 h, 24 h or 72 h. For washout experiments, media was carefully removed after 8 h or 24 h of treatment as indicated and cells were left to recover in fresh media until completion of the experiment.
Assessment of apoptosis
The CellEvent Caspase-3/7 reagent (Thermo Fisher Scientific https://www.thermofisher.com/order/catalog/product/R37111) was used to quantitatively evaluate apoptosis in LNCaP, CEM and CEM/VCR-R cells. LNCaP (5,000 cells/well), CEM and CEM/VCR-R were seeded (10,000 cells/well) for 24 h in optical 96-well plate (ibidi) pre-coated with 100 µL of poly-L-ornithine. Apoptosis was assessed after indicated time of treatment using CellEvent Caspase-3/7 reagent following the manufacturer's instructions. Images were acquired on an INCell 2200 imaging system (GE Healthcare) at 20 × and 40 × magnifications. Image analysis of 3,000 cells/treatment was performed using CellProfiler software. To quantify apoptotic cells, all nuclei (based on DAPI staining) were scored for caspase 3/7-positive and -negative staining.
Time-lapse microscopy
HeLa-H2B-GFP cells were seeded (2,000 cells/well) for 48 h in optical 96-well plates (ibidi) and treated with the indicated compounds. Images were acquired every 5 min for 24 h on an Olympus IX81 live-cell microscope using a 10 × objective at 37°C, 5% CO2, and quantified (time in mitosis and cell fate of ∼120 cells/treatment) using Fiji software.
In vitro tubulin polymerization assay
MT assembly was studied using the CytoDYNAMIX Screen kit (BK006P; Cytoskeleton Inc. http://www.cytoskeleton.com/bk006p) according to the manufacturer's instructions. Briefly, purified porcine tubulin proteins (> 99% purity) were dissolved in G-PEM buffer containing 80 mM PIPES, 2 mM MgCl2, 0.5mM EGTA, 1 mM GTP (pH 6.9) and 19% glycerol at 4°C. The mixture and indicated compounds were transferred into a pre-warmed 96-well plate, and polymerization was monitored using a FLUOstar Omega plate reader at 340 nm every 1 min for 30 min at 37°C.
Spinning disk microscopy
HeLa-EB1-GFP cells were seeded (20,000 cells/well) for 48 h in a 35 mm 4-chambers glass bottom dish (Cellvis). After treatment with the specified compounds for 2 h, images were acquired on a Nikon Ti-E Motorized Inverted microscope. Images (60 ×) were taken every second up to 2 min, and EB1 comets were tracked and analyzed using Imaris software (8.2 version).
DNA interaction studies (melting curve analysis)
DNA binding/intercalation assay was performed as described by Liberio et al.Citation64 Briefly, increasing concentration of TH (0.5–1000 µM) were incubated in triplicated with SYBR Green PCR Master Mix (Life Technologies) containing a 151 bp PCR product of the RPL32 gene. DMSO (final concentration of 0.02–1.8%) and DAPI (0.12–1 μM) were used as negative and positive controls, respectively. Melting curves were generated with an Abi 7900HT qRT-PCR machine (Applied Biosystems) and thermal profiles were analyzed with SDS 2.4 software (Applied Biosystems).
Statistical analysis
All experiments were performed in technical duplicates or triplicates and repeated at least twice by independent experiments and reported as the mean ± standard deviation of the biologic replicates. For all experiments, one-way ANOVA with Dunnett's multiple comparisons test was used (ns = non-significant, * P <0.05, ** P <0.01, *** P <0.001, **** P <0.0001) unless stated otherwise. Half-maximal inhibitory concentration (IC50) and statistical significance were analyzed using the GraphPad Prism 6 software (GraphPad Software, Inc.).
Abbreviations
| LCMS | = | liquid chromatography/mass spectrometry |
| MT | = | microtubule |
| NMR | = | nuclear magnetic resonance |
| TH | = | thalicthuberine |
Disclosure of potential conflicts of interest
No potential conflicts of interest were disclosed.
Author contributions
Conception and design: Claire Levrier, Martin C. Sadowski, Maria Kavallaris, Rohan A. Davis, Colleen C. Nelson
Development of methodology: Claire Levrier, Martin C. Sadowski
Acquisition of data: Claire Levrier, Martin C. Sadowski, Anja Rockstroh
Analysis and interpretation of data: Claire Levrier, Martin C. Sadowski, Anja Rockstroh, Brian Gabrielli, Melanie Lehman
Writing, review, and/or revision of the manuscript: Claire Levrier, Martin C. Sadowski, Brian Gabrielli, Maria Kavallaris, Rohan A. Davis, Colleen C. Nelson
Administrative, technical, or material support: Martin C. Sadowski
Study supervision: Martin C. Sadowski, Rohan A. Davis, Colleen C. Nelson
Other [Supply of compound (TH)]: Claire Levrier, Rohan A. Davis
Supplemental Files
Download Zip (45.5 MB)Acknowledgments
The authors would like to thank Associate Professor Derek Richard for kindly allowing us to use his DeltaVision microscope. We gratefully acknowledge access to the NatureBank (Hernandia albiflora plant sample) housed at the Griffith Institute for Drug Discovery.
Additional information
Funding
Related Research Data
References
- Ferlay J, Soerjomataram I, Ervik M, Dikshit R, Eser S, Mathers C, Rebelo M, Parkin DM, Forman D, Bray F. GLOBOCAN 2012 v1.0, cancer incidence and mortality worldwide: IARC CancerBase No. 11. Lyon (France): International Agency for Research on Cancer; 2013.
- Hwang C. Overcoming docetaxel resistance in prostate cancer: A perspective review. Ther Adv Med Oncol. 2012; 4:329–40. https://doi.org/10.1177/1758834012449685. PMID:23118808
- Sherr CJ. Cancer cell cycles. Science. 1996; 274:1672–7. https://doi.org/10.1126/science.274.5293.1672. PMID:8939849
- Chan KS, Koh CG, Li HY. Mitosis-targeted anti-cancer therapies: Where they stand. Cell Death Dis. 2012; 3:e411. https://doi.org/10.1038/cddis.2012.148. PMID:23076219
- Gjertsen BT, Schoffski P. Discovery and development of the Polo-like kinase inhibitor volasertib in cancer therapy. Leukemia. 2015; 29:11–9. https://doi.org/10.1038/leu.2014.222. PMID:25027517
- ClinicalTrials.gov. A Phase II Trial of MLN8237 in patients with metastatic castrate resistant and neuroendocrine prostate cancer. 2016. Trial ID: NCT01799278. https://clinicaltrials.gov/ct2/show/NCT01799278
- Dumontet C, Jordan MA. Microtubule-binding agents: A dynamic field of cancer therapeutics. Nat Rev Drug Discov. 2010; 9:790–803. https://doi.org/10.1038/nrd3253. PMID:20885410
- Guénard D, Guéritte F, Potier P. Produits naturels anticancéreux: La Navelbine® et le Taxotère®. Actual Chim. 2003; 263:89–92.
- Langlois N, Gueritte F, Langlois Y, Potier P. Application of a modification of the Polonovski reaction to the synthesis of vinblastine-type alkaloids. J Am Chem Soc. 1976; 98:7017–24. https://doi.org/10.1021/ja00438a046. PMID:965661
- Park SB, Goldstein D, Krishnan AV, Lin CSY, Friedlander ML, Cassidy J, Koltzenburg M, Kiernan MC. Chemotherapy-induced peripheral neurotoxicity: A critical analysis. CA Cancer J Clin. 2013; 63:419–37. https://doi.org/10.3322/caac.21204. PMID:24590861
- Fujita E, Tomimatsu T. Studies on the alkaloids of Thalictrum thunbergii DC. II. A quaternary base in the stem and leaves. Chem Pharm Bull (Tokyo). 1958; 6:107–8. https://doi.org/10.1248/cpb.6.107. PMID:13537164
- Velcheva M, Petrova R, Yansanghiin Z. Northalictuberine: A new phenanthrene alkaloid fron Thalictrum simplex. Planta Med. 1994; 60:485–6. https://doi.org/10.1055/s-2006-959545. PMID:17236070
- Wu W-N, Beal JL, Doskotch RW. Alkaloids of Thalictrum XXX. Eleven Minor Alkaloids From Thalictrum rugosum. J Nat Prod. 1980; 43:143–50. https://doi.org/10.1021/np50007a014
- Gao C-Y, Ali YE, Sharaf M, Wong LK, Fu EW, Lin F-T, Duah FK, Schiff PL. Alkaloids of Thalictrum delavayi. Phytochemistry. 1990; 29:1895–7. https://doi.org/10.1016/0031-9422(90)85036-F
- Blanco OM, Castedo L, Villaverde MC. Alkaloids from Platycapnos spicata. Phytochemistry. 1993; 32:1055–7. https://doi.org/10.1016/0031-9422(93)85255-P
- Suau R, Cuevas A, Garcia AI, Rico R, Cabezudo B. Isoquinoline alkaloids from Platycapnos. Phytochemistry. 1991; 30:3315–7. https://doi.org/10.1016/0031-9422(91)83200-5
- Jordan MA, Thrower D, Wilson L. Mechanism of inhibition of cell proliferation by vinca alkaloids. Cancer Res. 1991; 51:2212–22. https://doi.org/10.1021/bi00056a013. PMID:2009540
- Jordan MA, Thrower D, Wilson L. Effects of vinblastine, podophyllotoxin and nocodazole on mitotic spindles. Implications for the role of microtubule dynamics in mitosis. J Cell Sci. 1992; 102:401–16. PMID:1506423
- Toso RJ, Jordan MA, Farrell KW, Matsumoto B, Wilson L. Kinetic stabilization of microtubule dynamic instability in vitro by vinblastine. Biochemistry. 1993; 32:1285–93. PMID:8448138
- Serafin AM, Akudugu JM, Bohm L. Drug resistance in prostate cancer cell lines is influenced by androgen dependence and p53 status. Urol Res. 2002; 30:289–94. https://doi.org/10.1007/s00240-002-0277-y. PMID:12389116
- Coleman ML, Sahai EA, Yeo M, Bosch M, Dewar A, Olson MF. Membrane blebbing during apoptosis results from caspase-mediated activation of ROCK I. Nat Cell Biol. 2001; 3:339–45. https://doi.org/10.1038/35070009. PMID:11283606
- Mills JC, Stone NL, Erhardt J, Pittman RN. Apoptotic membrane blebbing is regulated by myosin light chain phosphorylation. J Cell Biol. 1998; 140:627–36. https://doi.org/10.1083/jcb.140.3.627. PMID:9456322
- Levrier C, Sadowski MC, Rockstroh A, Gabrielli B, Kavallaris M, Lehman M, Davis RA, Nelson CC. 6α-Acetoxyanopterine: A novel structure class of mitotic inhibitor disrupting microtubule dynamics in prostate cancer cells. Mol Cancer Ther. 2017; 16:3–15. https://doi.org/10.1158/1535-7163.MCT-16-0325. PMID:27760837
- Li Y, Li X, Hussain M, Sarkar FH. Regulation of microtubule, apoptosis, and cell cycle-related genes by taxotere in prostate cancer cells analyzed by microarray. Neoplasia. 2004; 6:158–67. https://doi.org/10.1593/neo.03391. PMID:15140405
- Chen ZF, Shi YF, Liu YC, Hong X, Geng B, Peng Y, Liang H. TCM active ingredient oxoglaucine metal complexes: Crystal structure, cytotoxicity, and interaction with DNA. Inorg Chem. 2012; 51:1998–2009. https://doi.org/10.1021/ic200443p. PMID:22309171
- Rogakou EP, Pilch DR, Orr AH, Ivanova VS, Bonner WM. DNA Double-stranded Breaks Induce Histone H2AX Phosphorylation on Serine 139. J Biol Chem. 1998; 273:5858–68. https://doi.org/10.1074/jbc.273.10.5858. PMID:9488723
- Vanden Bosch A, Raemaekers T, Denayer S, Torrekens S, Smets N, Moermans K, Dewerchin M, Carmeliet P, Carmeliet G. NuSAP is essential for chromatin-induced spindle formation during early embryogenesis. J Cell Sci. 2010; 123:3244–55. https://doi.org/10.1242/jcs.063875. PMID:20807801
- Towle MJ, Salvato KA, Wels BF, Aalfs KK, Zheng W, Seletsky BM, Zhu X, Lewis BM, Kishi Y, Yu MJ, et al. Eribulin induces irreversible mitotic blockade: Implications of cell-based pharmacodynamics for in vivo efficacy under intermittent dosing conditions. Cancer Res. 2011; 71:496–505. https://doi.org/10.1158/0008-5472.CAN-10-1874. PMID:21127197
- Castedo M, Perfettini JL, Roumier T, Andreau K, Medema R, Kroemer G. Cell death by mitotic catastrophe: A molecular definition. Oncogene. 2004; 23:2825–37. https://doi.org/10.1038/sj.onc.1207528. PMID:15077146
- Stevens FE, Beamish H, Warrener R, Gabrielli B. Histone deacetylase inhibitors induce mitotic slippage. Oncogene. 2008; 27:1345–54. https://doi.org/10.1038/sj.onc.1210779. PMID:17828304
- Jordan MA, Wilson L. Microtubules as a target for anticancer drugs. Nat Rev Cancer. 2004; 4:253–65. https://doi.org/10.1038/nrc1317. PMID:15057285
- Zhang LH, Wu L, Raymon HK, Chen RS, Corral L, Shirley MA, Narla RK, Gamez J, Muller GW, Stirling DI, et al. The synthetic compound CC-5079 is a potent inhibitor of tubulin polymerization and tumor necrosis factor-alpha production with antitumor activity. Cancer Res. 2006; 66:951–9. https://doi.org/10.1158/0008-5472.CAN-05-2083. PMID:16424030
- Ovechkina Y, Wagenbach M, Wordeman L. K-loop insertion restores microtubule depolymerizing activity of a “neckless” MCAK mutant. J Cell Biol. 2002; 159:557–62. https://doi.org/10.1083/jcb.200205089. PMID:12446739
- Tirnauer JS, Canman JC, Salmon ED, Mitchison TJ. EB1 targets to kinetochores with attached, polymerizing microtubules. Mol Biol Cell. 2002; 13:4308–16. https://doi.org/10.1091/mbc.E02-04-0236. PMID:12475954
- Matov A, Applegate K, Kumar P, Thoma C, Krek W, Danuser G, Wittmann T. Analysis of microtubule dynamic instability using a plus-end growth marker. Nat Meth. 2010; 7:761–8. https://doi.org/10.1038/nmeth.1493. PMID:20729842
- Lénárt P, Petronczki M, Steegmaier M, Di Fiore B, Lipp JJ, Hoffmann M, Rettig WJ, Kraut N, Peters JM. The small-molecule inhibitor BI 2536 reveals novel insights into mitotic roles of polo-like kinase 1. Curr Biol. 2007; 17:304–15. https://doi.org/10.1016/j.cub.2006.12.046. PMID:17291761
- Kesisova IA, Nakos KC, Tsolou A, Angelis D, Lewis J, Chatzaki A, Agianian B, Giannis A, Koffa MD. Tripolin A, a novel small-molecule inhibitor of Aurora A kinase, reveals new regulation of HURP's distribution on microtubules. PloS One. 2013; 8:e58485. https://doi.org/10.1371/journal.pone.0058485. PMID:23516487
- Goto H, Yasui Y, Nigg EA, Inagaki M. Aurora-B phosphorylates Histone H3 at serine28 with regard to the mitotic chromosome condensation. Genes Cells. 2002; 7:11–7. https://doi.org/10.1046/j.1356-9597.2001.00498.x. PMID:11856369
- Qi W, Spier C, Liu X, Agarwal A, Cooke LS, Persky DO, Chen D, Miller TP, Mahadevan D. Alisertib (MLN8237) an investigational agent suppresses Aurora A and B activity, inhibits proliferation, promotes endo-reduplication and induces apoptosis in T-NHL cell lines supporting its importance in PTCL treatment. Leuk Res. 2013; 37:434–9. https://doi.org/10.1016/j.leukres.2012.10.017. PMID:23153524
- Qi W, Cooke LS, Liu X, Rimsza L, Roe DJ, Persky AMDO, Miller TP, Mahadevan D. Aurora inhibitor MLN8237 in combination with docetaxel enhances apoptosis and anti-tumor activity in mantle cell lymphoma. Biochem Pharmacol. 2011; 81:881–90. https://doi.org/10.1016/j.bcp.2011.01.017. PMID:21291867
- Liaw TY, Salam NK, McKay MJ, Cunningham AM, Hibbs DE, Kavallaris M. Class I β-tubulin mutations in 2-methoxyestradiol-resistant acute lymphoblastic leukemia cells: Implications for drug-target interactions. Mol Cancer Ther. 2008; 7:3150–9. https://doi.org/10.1158/1535-7163.MCT-08-0442. PMID:18852118
- Kavallaris M, Tait AS, Walsh BJ, He L, Horwitz SB, Norris MD, Haber M. Multiple microtubule alterations are associated with vinca alkaloid resistance in human leukemia cells. Cancer Res. 2001; 61:5803–9. PMID:11479219
- Mould E, Berry P, Jamieson D, Hill C, Cano C, Tan N, Elliott S, Durkacz B, Newell D, Willmore E. Identification of dual DNA-PK MDR1 inhibitors for the potentiation of cytotoxic drug activity. Biochem Pharmacol. 2014; 88:58–65. https://doi.org/10.1016/j.bcp.2014.01.001. PMID:24418411
- Haber M, Norris MD, Kavallaris M, Bell DR, Davey RA, White L, Stewart BW. Atypical multidrug resistance in a therapy-induced drug-resistant human leukemia cell line (LALW-2): Resistance to vinca alkaloids independent of P-glycoprotein. Cancer Res. 1989; 49:5281–7. PMID:2569932
- Kavallaris M, Madafiglio J, Norris MD, Haber M. Resistance to tetracycline, a hydrophilic antibiotic, is mediated by P-glycoprotein in human multidrug-resistant cells. Biochem Biophys Res Commun. 1993; 190:79–85. https://doi.org/10.1006/bbrc.1993.1013. PMID:8093660
- Yusa K, Tsuruo T. Reversal mechanism of multidrug resistance by verapamil: Direct binding of verapamil to P-glycoprotein on specific sites and transport of verapamil outward across the plasma membrane of K562/ADM cells. Cancer Res. 1989; 49:5002–6. PMID:2569930
- Ganem NJ, Godinho SA, Pellman D. A mechanism linking extra centrosomes to chromosomal instability. Nature. 2009; 460:278–82. https://doi.org/10.1038/nature08136. PMID:19506557
- Aneja R, Miyagi T, Karna P, Ezell T, Shukla D, Vij Gupta M, Yates C, Chinni SR, Zhau H, Chung LW, et al. A novel microtubule-modulating agent induces mitochondrially driven caspase-dependent apoptosis via mitotic checkpoint activation in human prostate cancer cells. Eur J Cancer. 2010; 46:1668–78. https://doi.org/10.1016/j.ejca.2010.02.017. PMID:20303260
- Chen JG, Yang CP, Cammer M, Horwitz SB. Gene expression and mitotic exit induced by microtubule-stabilizing drugs. Cancer Res. 2003; 63:7891–9. PMID:14633718
- Zhang Z, Meng T, He J, Li M, Tong LJ, Xiong B, Lin L, Shen J, Miao ZH, Ding J. MT7, a novel compound from a combinatorial library, arrests mitosis via inhibiting the polymerization of microtubules. Invest New Drugs. 2010; 28:715–28. https://doi.org/10.1007/s10637-009-9303-z. PMID:19705064
- Zhang Z, Meng T, Yang N, Wang W, Xiong B, Chen Y, Ma L, Shen J, Miao Z-H, Ding J. MT119, a new planar-structured compound, targets the colchicine site of tubulin arresting mitosis and inhibiting tumor cell proliferation. Int J Cancer. 2011; 129:214–24. https://doi.org/10.1002/ijc.25661. PMID:20830720
- Ohira M, Iwasaki Y, Tanaka C, Kuroki M, Matsuo N, Kitamura T, Yukuhiro M, Morimoto H, Pang N, Liu B, et al. A novel anti-microtubule agent with carbazole and benzohydrazide structures suppresses tumor cell growth in vivo. Biochim Biophys Acta. 2015; 1850:1676–84. https://doi.org/10.1016/j.bbagen.2015.04.013. PMID:25960391
- Barr FA, Sillje HHW, Nigg EA. Polo-like kinases and the orchestration of cell division. Nat Rev Mol Cell Biol. 2004; 5:429–41. https://doi.org/10.1038/nrm1401. PMID:15173822
- Bhat KMR, Setaluri V. Microtubule-associated proteins as targets in cancer chemotherapy. Clin Cancer Res. 2007; 13:2849–54. https://doi.org/10.1158/1078-0432.CCR-06-3040. PMID:17504982
- Charbaut E, Curmi PA, Ozon S, Lachkar S, Redeker V, Sobel A. Stathmin family proteins display specific molecular and tubulin binding properties. J Biol Chem. 2001; 276:16146–54. https://doi.org/10.1074/jbc.M010637200. PMID:11278715
- Matsuyama A, Shimazu T, Sumida Y, Saito A, Yoshimatsu Y, Seigneurin-Berny D, Osada H, Komatsu Y, Nishino N, Khochbin S, et al. In vivo destabilization of dynamic microtubules by HDAC6-mediated deacetylation. EMBO J. 2002; 21:6820–31. https://doi.org/10.1093/emboj/cdf682. PMID:12486003
- Fourest-Lieuvin A, Peris L, Gache V, Garcia-Saez I, Juillan-Binard C, Lantez V, Job D. Microtubule regulation in mitosis: Tubulin phosphorylation by the cyclin-dependent kinase Cdk1. Mol Biol Cell. 2006; 17:1041–50. https://doi.org/10.1091/mbc.E05-07-0621. PMID:16371510
- Wignall SM, Gray NS, Chang YT, Juarez L, Jacob R, Burlingame A, Schultz PG, Heald R. Identification of a novel protein regulating microtubule stability through a chemical approach. Chem Biol. 2004; 11:135–46. https://doi.org/10.1016/j.chembiol.2003.12.019. PMID:15113003
- Kini SV, Ramana MMV. A new convenient synthesis of phenanthrene alkaloids from 1-arylmethyl-1,2,3,4-tetrahydroisoquinolines. Tetrahedron Lett. 2004; 45:4171–3. https://doi.org/10.1016/j.tetlet.2004.03.127
- Nimgirawath S, Chaturonrugsamee S. Synthesis of Thalicthuberine. J Chin Chem Soc. 2006; 53:443–7. https://doi.org/10.1002/jccs.200600057
- Levrier C, Sadowski MC, Nelson CC, Davis RA. Cytotoxic C20 diterpenoid alkaloids from the Australian endemic rainforest plant Anopterus macleayanus. J Nat Prod. 2015; 78:2908–16. https://doi.org/10.1021/acs.jnatprod.5b00509. PMID:26600001
- Sadowski MC, Pouwer RH, Gunter JH, Lubik AA, Quinn RJ, Nelson CC. The fatty acid synthase inhibitor Triclosan: Repurposing an anti-microbial agent for targeting prostate cancer. Oncotarget. 2014; 5:9362–81. https://doi.org/10.18632/oncotarget.2433. PMID:25313139
- Sieh S, Taubenberger AV, Rizzi SC, Sadowski M, Lehman ML, Rockstroh A, An J, Clements JA, Nelson CC, Hutmacher DW. Phenotypic characterization of prostate cancer LNCaP cells cultured within a bioengineered microenvironment. PloS One. 2012; 7:e40217. https://doi.org/10.1371/journal.pone.0040217. PMID:22957009
- Liberio MS, Sadowski MC, Davis RA, Rockstroh A, Vasireddy R, Lehman ML, Nelson CC. The ascidian natural product eusynstyelamide B is a novel topoisomerase II poison that induces DNA damage and growth arrest in prostate and breast cancer cells. Oncotarget. 2015; 6:43944–63. https://doi.org/10.1093/nar/gkv007. PMID:26733491
- Ritchie ME, Phipson B, Wu D, Hu Y, Law CW, Shi W, Smyth GK. Limma powers differential expression analyses for RNA-sequencing and microarray studies. Nucleic Acids Res. 2015; 43:e47. PMID:25605792
- Eden E, Navon R, Steinfeld I, Lipson D, Yakhini Z. GOrilla: A tool for discovery and visualization of enriched GO terms in ranked gene lists. BMC Bioinformatics. 2009; 10:1–7. https://doi.org/10.1186/1471-2105-10-48. PMID:19118496
- Liberio MS, Sadowski MC, Soekmadji C, Davis RA, Nelson CC. Differential effects of tissue culture coating substrates on prostate cancer cell adherence, morphology and behavior. PloS One. 2014; 9:e112122. https://doi.org/10.1371/journal.pone.0112122. PMID:25375165
- Carpenter AE, Jones TR, Lamprecht MR, Clarke C, Kang IH, Friman O, Guertin DA, Chang JH, Lindquist RA, Moffat J, et al. CellProfiler: Image analysis software for identifying and quantifying cell phenotypes. Genome Biol. 2006; 7:1–11. https://doi.org/10.1186/gb-2006-7-10-r100. PMID:17076895
- Schindelin J, Arganda-Carreras I, Frise E, Kaynig V, Longair M, Pietzsch T, Preibisch S, Rueden C, Saalfeld S, Schmid B, et al. Fiji: An open-source platform for biological-image analysis. Nat Meth. 2012; 9:676–82. https://doi.org/10.1038/nmeth.2019. PMID:22743772