
ABSTRACT
Replication stress is a major source of DNA damage and an important driver of cancer development. Replication intermediates that occur upon mild forms of replication stress frequently escape cell cycle checkpoints and can be transmitted through mitosis into the next cell cycle. The consequences of such inherited DNA lesions for cell fate and survival are poorly understood. By using time-lapse microscopy and quantitative image-based cytometry to simultaneously monitor inherited DNA lesions marked by the genome caretaker protein 53BP1 and cell cycle progression, we show that inheritance of 53BP1-marked lesions from the previous S-phase is associated with a prolonged G1 duration in the next cell cycle. These results suggest that cell-to-cell variation in S-phase commitment is determined, at least partially, by the amount of replication-born inherited DNA damage in individual cells. We further show that loss of the tumor suppressor protein p53 overrides replication stress-induced G1 prolongation and allows S-phase entry with excessive amounts of inherited DNA lesions. Thus, replication stress and p53 loss may synergize during cancer development by promoting cell cycle re-entry with unrepaired mutagenic DNA lesions originating from the previous cell cycle.
Introduction
Replication stress promotes genome instability and is considered as a hallmark of many cancers.Citation14,Citation16,Citation27 Replication stress comprises a multitude of cellular conditions in which the DNA replication program is perturbed, and ranges from transient and fully reversible stalling of individual replication forks to fork collapse and fork-associated formation of DSBs.Citation43 In addition to posing a direct threat to replication fork stability, mild forms of replication stress and natural impediments to replication fork progression challenge the timely completion of DNA replication. This can lead to a situation in which replication intermediates and unreplicated genomic regions escape cell cycle checkpoints and are transmitted to the next phases of the cell cycle.Citation28 Recent evidence suggests that finishing S-phase with unreplicated DNA and transmitting these unreplicated genomic regions to mitosis is an inherent feature of gigabase-sized genomes with comparably large replicons.Citation30 This can explain the relatively high frequency of such events in mammalian cells and why dedicated mechanisms have evolved to take care of replication remnants in sub-sequent cell cycle phases. One of these mechanisms involves recently identified replication stress-induced mitotic DNA synthesis (MiDAS).Citation29 At later stages, in the following G1 phase of the cell cycle, unresolved replication intermediates are found in nuclear sub-compartments characterized by the presence of the genome caretaker protein 53BP1. While under physiological conditions only a subset of G1 cells shows 53BP1 nuclear bodies, mild exogenous replication stress increases the proportion of cells with 53BP1-marked lesions and leads to elevated numbers of 53BP1 nuclear bodies per daughter cell.Citation20,Citation26 Previous work has illuminated causes of 53BP1 nuclear body formation in G1 cells, elucidated the upstream signals required for 53BP1 accumulation, and characterized mechanisms of its confinement to damaged chromatin.Citation4,Citation34,Citation39 The consequences of 53BP1-marked inherited DNA lesions for cell fate and survival, however, have remained poorly defined.
Live cell microscopy of individual cells expressing fluorescent cell cycle reporters revealed previously that a bifurcation exists in the decision of cells to enter S-phase: by elaborate single-cell-tracking experiments in asynchronous cell populations it was shown that two sub-populations emerge as cells exit from mitosis, one with elevated levels of CDK2 activity that rapidly commits to cell cycle progression, and a smaller sub-population with low levels of CDK2 activity that enters a transient state of quiescence.Citation40 Subsequent work suggested that basal levels of the cell cycle regulator p21 generate this phenotypic heterogeneity,Citation33 but the underlying reasons for why the majority of cells exits mitosis with low p21 levels and increasing CDK2 activity, while a distinct subset of cells enters G1 with elevated p21 levels and low CDK2 activity had remained obscure.
In light of the close ties between the DNA damage response, checkpoint control and cell cycle commitment, we set out to test the hypothesis that G1 duration and S-phase commitment might be determined by the amount of transmitted replication remnants from the previous cell cycle.
Results
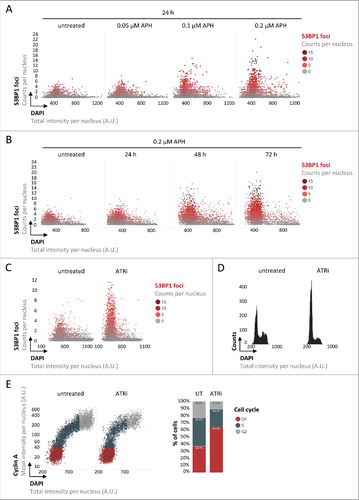
To monitor 53BP1 accumulation at sites of inherited lesions and simultaneously follow cell cycle progression of asynchronous populations, we employed automated microscopy and image-based cell cycle staging (quantitative image-based cytometry, QIBC) as performed previously.Citation5,Citation32,Citation36,Citation42 Specifically, we quantified 53BP1 foci in large cohorts of asynchronously growing human U-2 OS cells as a function of the cell cycle based on nuclear DNA content measured by DAPI intensity. As expected, we observed 53BP1 foci in a subset of unchallenged cells, primarily in G1 cells characterized by low DAPI intensity (). Incubating cells for 24 hours with low doses of aphidicolin (APH) to slow down DNA replication resulted in a marked increase in 53BP1 foci and elevated levels of accumulated focal 53BP1 intensities per nucleus ( and Supplementary Figure S1A). Extending the low-dose APH treatment to 72 hours augmented this phenotype and resulted in 27 % of cells with 5 or more 53BP1 foci compared to 0.7 % in control cells ( and Supplementary Figure S1B). Given that the great majority of cells with 53BP1 foci had a low DNA content, this suggested that cells with increased amounts of inherited DNA lesions accumulate in G1. In addition to enhancing 53BP1 foci formation in G1 cells, low dose APH treatment also results in an accumulation of cells in S/G2 by slowing down DNA replication. Therefore, as an alternative means to induce replication stress-associated 53BP1 foci in G1 cells, we targeted the ATR checkpoint kinase, inhibition of which extenuates the G2/M checkpoint and thus facilitates experimental interrogation of consequences of perturbed replication in the next G1 phase. Consistent with previous results using siRNA to deplete ATR from cells,Citation26 targeting ATR by the small molecule inhibitor AZ-20 (ATRi) for 24 hours resulted in greatly elevated levels of 53BP1 foci in G1 cells (). DNA content-based cell cycle profiling confirmed that the increase in inherited 53BP1-marked lesions was associated with an accumulation of cells in G1 (), and two-dimensional cell cycle profiling based on DNA content and nuclear levels of Cyclin A corroborated this result (). Since dynamic alterations in cell cycle phase durations can be deduced from cell cycle information obtained from fixed cells,Citation18,Citation22 our findings indicate that inheriting DNA lesions from the previous cell cycle leads to an extended G1 duration. We obtained very similar results, ATRi-induced 53BP1-marked inherited lesions in G1 cells and a concomitant accumulation of cells in G1, in RPE-1 cells (Supplementary Figures S2A and S2B). Also HeLa cells showed comparable results, although the G1 accumulation was, most likely due to an impaired p53 response and at least partial abrogation of the G1/S checkpoint in this cancer cell line,Citation8,Citation21,Citation24,Citation25 less pronounced (Supplementary Figures S2C and S2D).
Figure 1. Replication stress-induced inherited DNA lesions result in an accumulation of cells in G1. (A) Asynchronously growing U-2 OS cells were treated with increasing doses of APH as indicated and stained for DNA content (DAPI) and 53BP1. 53BP1 foci per nucleus were measured by QIBC and are depicted in single cell scatter plots as a function of the cell cycle, from low DAPI to high DAPI intensities. (B) U-2 OS cells were treated for increasing time periods with APH as indicated and 53BP1 foci per nucleus are shown. (C) U-2 OS cells were treated with ATRi for 24 h and 53BP1 foci per nucleus are depicted. (D) One-dimensional cell cycle profiles are depicted for untreated and ATRi-treated U-2 OS cells based on total DAPI intensities. (E) Two-dimensional cell cycle profiles are depicted for untreated and ATRi-treated U-2 OS cells based on Cyclin A / DAPI co-staining. Cell cycle staging was performed according to the indicated color code and percentages of cells in individual cell cycle phases are shown on the right.
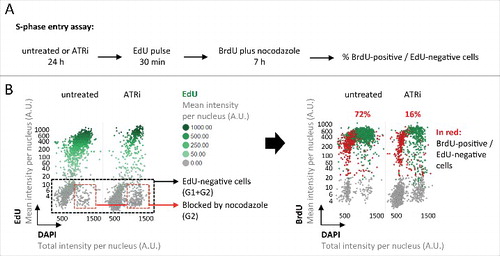
In order to directly measure the cellular commitment to cell cycle progression and S-phase entry, we employed a previously reported G1/S checkpoint assay.Citation12 In brief, asynchronously growing cells were either left untreated or challenged with ATRi for 24 hours, incubated with EdU for 30 minutes to discriminate cells in S-phase from cells in G1/G2, transition through mitosis was prevented by addition of the microtubule-disrupting drug nocodazole, and S-phase entry of G1 cells was monitored by BrdU incorporation in EdU-negative cells (). In line with our previous conclusions, ATRi greatly reduced entry of G1 cells into S-phase from 72% to 16% (). Taken together, these results reveal that elevated levels of inherited DNA lesions upon ATRi are closely associated with reduced S-phase commitment in the next cell cycle.
Figure 2. Inherited DNA lesions impair S-phase entry. (A) Experimental scheme to measure S-phase entry from G1 in asynchronously growing U-2 OS cell populations. (B) QIBC-derived cell cycle staging based on EdU, BrdU and DAPI. EdU-negative cells were in G1 or G2 prior to BrdU addition. Cells in G2 were blocked from progressing into the next cell cycle by nocodazole. BrdU-positive cells within the EdU-negative cell population were thus in G1 prior to BrdU addition and have entered S-phase during the 7 h BrdU incubation. Percentages of S-phase entry from G1 are shown in red.
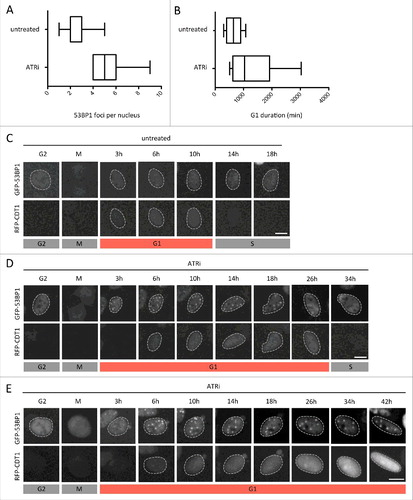
To follow the fate of individual cells we performed extended time-lapse imaging for up to 72 hours of asynchronous cell populations in unperturbed conditions or in the presence of mild replication stress. We employed a U-2 OS cell line stably expressing GFP-53BP1 in combination with BacMam-mediated expression of an RFP-CDT1 construct from the FUCCI Cell Cycle Sensor System.Citation38 This allowed us to simultaneously monitor G1 duration (defined as the time from mitotic exit to degradation of the RFP-CDT1 fusion) and the amount of GFP-53BP1-marked inherited lesions. These cell-tracking experiments revealed that increasing amounts of inherited DNA lesions were associated with a prolonged G1 duration ( and ; examples from individual cells are shown in and ). Strikingly, these experiments also identified examples of G1 cells with excessive amounts of inherited DNA lesions, which during the course of the experiment did not re-enter the cell cycle (). A threshold of inherited DNA lesions thus seems to exist, which is incompatible with further cell cycle commitment. Reassuringly, U-2 OS cells stably expressing both FUCCI constructs, GFP-Geminin and RFP-CDT1, recapitulated these results and confirmed the inability of a sub-set of ATRi-treated cells to enter the next S-phase (Supplementary Figures S3A-S3E). Similar results were obtained when we employed a low dose of APH to induce mild replication stress (Supplementary Figure S3F).
Figure 3. Inheritance of DNA lesions is associated with extended G1 duration. Asynchronously growing U-2 OS cells stably expressing GFP-53BP1 transduced with BacMam RFP-CDT1 were followed by time-lapse microscopy for 72 h at 30 minutes intervals in the absence or presence of ATRi. Individual cells were followed from mitotic exit (marked by nuclear localization of 53BP1 in the two daughter cells) to their entry into S-phase (marked by loss of the RFP-CDT1 signal). Maximum 53BP1 foci numbers in G1 cells (A) as well as G1 duration (B) were measured. (C) Single-cell images of progression of U-2 OS cells through G1 in unperturbed conditions. (D) Single-cell images of progression of U-2 OS cells through G1 in the presence of ATRi-induced replication stress. (E) Single-cell images of U-2 OS cells undergoing G1 arrest upon excessive inherited DNA damage in response to ATRi-induced replication stress. Scale bars, 10 μm.
Taken together, these findings suggest that inherited DNA lesions, as a natural byproduct of unperturbed proliferationCitation30 and, in a more severe form, as a consequence of mild replication stress,Citation20,Citation26 impact G1 duration in daughter cells and can thereby explain cellular heterogeneity in S-phase commitment. S-phase commitment is controlled by Cyclin/CDK activity, which can be antagonized by the tumor suppressor protein p53 and its downstream effector p21.Citation9 Since various types of DNA damage are known to induce p53, we aimed to test whether inherited DNA lesions prolong G1 duration in a p53-dependent manner. Due to a gain-of-function mutation of the p53 antagonist and gatekeeper phosphatase Wip1,Citation23 U-2 OS cells have a dampened but not completely abolished p53 response,Citation2,Citation15,Citation35 and in our experiments clearly accumulated in G1 upon mild replication stress treatments ( and ). Strikingly, depletion of p53 by siRNA (Supplementary Figures S4A and S4B) rescued the observed G1 arrest almost completely as revealed by one- and two-dimensional cell cycle profiling ( and ). Importantly, however, loss of p53 did not lead to a reduction in the amount of inherited DNA lesions marked by 53BP1, but instead allowed cells to enter S-phase with elevated levels of unresolved 53BP1-marked lesions (). Time-lapse microscopy confirmed that prolonged G1 duration in individual cells upon ATRi is rescued by p53 depletion ( and Supplementary Figure S4C). Thus, loss of p53 overrides replication stress-induced G1 prolongation and allows S-phase entry with excessive amounts of 53BP1-marked inherited DNA lesions ().
Figure 4. The tumor suppressor protein p53 regulates G1 duration in response to inherited DNA lesions from the previous S-phase. (A) U-2 OS cells were transfected with siRNAs and exposed to ATRi as indicated. QIBC-derived one-dimensional cell cycle profiles based on total DAPI intensities are shown. (B) QIBC-derived two-dimensional cell cycle profiles based on Cyclin A / DAPI co-staining of U-2 OS cells are shown. Cell cycle staging was performed according to the indicated color code and percentages of cells in individual cell cycle phases are shown on the right. (C) 53BP1 foci were quantified in U-2 OS cells and are depicted as a function of the cell cycle. Note that loss of p53 leads to S-phase entry with elevated amounts of 53BP1 foci (red arrows). (D) Asynchronously growing FUCCI U-2 OS cells were transfected with siRNAs for 24 h and then exposed to ATRi as indicated. Cells were followed by time-lapse microscopy for 72 h at 30 minutes intervals and G1 duration was determined in individual cells.
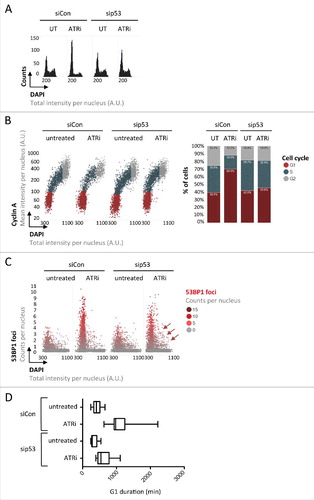
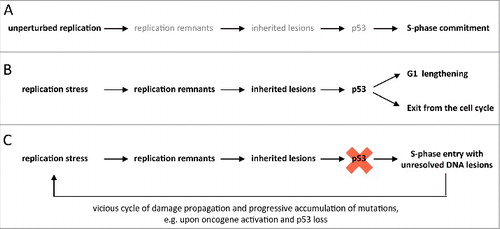
Figure 5. Model for S-phase commitment in the context of inherited DNA lesions. (A) During unperturbed replication the small number of replication remnants and low amounts of inherited DNA lesions promotes a smooth transition through G1 and rapid S-phase entry. (B) Upon replication stress, an increase in unresolved replication remnants (e.g. stretches of unreplicated DNA) leads to an elevated number of 53BP1-marked inherited DNA lesions. This results in p53-dependent G1 lengthening or, if the damage load is too high, exit from the cell cycle. (C) In a p53-suppressed situation, cells experiencing replication stress enter the next S-phase prematurely with elevated levels of unresolved inherited genomic lesions. Upon oncogene activation during cancer development this may initiate a vicious cycle of damage propagation and accumulation of mutations.
Discussion
The duration of cell cycle phases shows significant cell-to-cell variation, the causes of which are largely unknown. Here, we provide evidence, which suggests that the cellular heterogeneity observed at the level of G1/S transition is not stochastic but instead can be explained by the history of each individual cell and by how faithful and complete DNA replication occurred during the previous S-phase. The time, which a cell spends in G1, is thus determined at least in part by the amount of replication remnants that have been transmitted through mitosis. Similar conclusions were reached recently.Citation6,Citation7
Extending G1 duration to deal with inherited DNA lesions could be an important mechanism to avoid S-phase re-entry with an excessive DNA damage load. During cancer development, oncogene-induced replication stressCitation10,Citation17,Citation19 may thus synergize with loss of p53 function to maintain cell cycle commitment in spite of elevated amounts of unresolved replication intermediates and unreplicated DNA sequences transmitted through mitosis. Most p53-related mutations, either in p53 itself or in the pathways signaling to p53, result in functionally impaired p53, which can even exert dominant-negative regulation of remaining wild-type p53.Citation31 Thus, the spectrum of cancers, in which deregulation of p53 functionally cooperates with replication stress to propagate inherited DNA lesions across multiple cell generations, might be broad. While the fate of inherited DNA lesions and how exactly they are resolved is currently not known, it is likely that committing to cell cycle progression prematurely will lead to an increase in genomic instability. Along these lines, we note that unlike RPE-1 cells, which efficiently prolong their G1 phase when exposed to ATRi, HeLa cells – similar to p53-depleted U-2 OS cells – enter S-phase with significant amounts of unresolved 53BP1-marked lesions ( and Supplementary Figure S2C). Mild levels of replication stress in a p53-suppressed background may thus, over time and through successive rounds of cell proliferation, lead to damage accumulation and thereby contribute to cancer development ().
The proposed link between 53BP1-marked inherited DNA lesions and p53-dependent G1 duration seems reminiscent of the 53BP1-p53 cooperation in a different cellular context, namely in response to clastogen-induced DNA double-strand breaks (DSBs).Citation13 Dissecting the molecular events, which signal from 53BP1-marked inherited lesions to p53, and elucidating whether they are identical to the signals initiated at DSBs, requires further studies. In support of a potential role of DNA damage response kinase activation in this signal transduction, the ATM kinase was previously shown to counteract persistence and transmission of DSBs generated by failed V(D)J recombination in lymphocytes.Citation11
Interestingly, while in the context of p53-deficient cancer cells DNA damage inheritance and premature cell cycle commitment may exacerbate genome instability and lead to a progressive accumulation of mutations, other highly proliferative cell types such as embryonic stem cells may have evolved specialized mechanisms to deal with inherited DNA lesions without having to extend G1 duration.Citation1
A promising avenue in personalized cancer therapy is to target cancer cells harboring elevated levels of replication stress with replication and checkpoint inhibitors.Citation14,Citation16 The rationale behind is to aggravate replication stress and its adverse effects on genome integrity up to a point where cancer cells can no longer cope with the elevated stress load. One way to reach this point is to exhaust the cellular machinery dealing with replication stress and genome integrity maintenance directly in S-phase.Citation41 However, not all cancer cells may reach this point of no return and some cells may escape the challenges in S-phase by entering the next cell cycle. In such a scenario, p53 proficiency would generate a selective advantage by extending G1 duration and allowing cells to take care of therapy-induced inherited DNA lesions. In contrast, p53 deficiency would promote entry into the next S-phase with unresolved lesions and provide another chance for S-phase-specific drugs to be effective. Indeed, p53 deficiency was previously shown to confer hyper-sensitivity to ATR inhibition or ATR depletion.Citation37 Thus, a better understanding of the interplay between replication-born, inherited lesions marked by 53BP1 and S-phase commitment in the next round of the cell cycle offers an opportunity to define the damage thresholds compatible with sustained proliferation, both in the presence and absence of functional p53.
Experimental procedures
Cell culture and replication stress treatments
Human U-2 OS, HeLa, and hTERT-RPE1 cells as well as U-2 OS cells stably expressing GFP-53BP1 (a kind gift of Jiri Lukas) or the GFP-Geminin/RFP-CDT1 FUCCI constructs (a kind gift of Hisao Masai) were grown under standard cell culture conditions (humidified atmosphere, 5% CO2) in Dulbecco's modified Eagle's medium (DMEM) containing 10% fetal bovine serum (GIBCO) and penicillin-streptomycin antibiotics. All cell lines were routinely tested for potential mycoplasma contamination and scored negatively. APH (Aphidicolin, Sigma) was used at a final concentration of 0.2 μM unless otherwise noted. ATR inhibitor AZ-20 (Tocris) was used at a final concentration of 1 μM.
S-phase entry assay
S-phase entry was measured as described before.Citation12 For pulsed EdU (5-ethynyl-2′-desoxyuridine) incorporation, cells were incubated for 30 minutes in medium containing 10 μM EdU (Thermo Fisher Scientific). Click-iT EdU Alexa Fluor Imaging Kit (Thermo Fisher Scientific) was used for EdU detection. BrdU (5-Bromo-2-Deoxyuridine, Sigma) was used at a final concentration of 10 μM and cells were allowed to incorporate BrdU for 7 hours in the presence of 0.25 ug/ml nocodazole (Sigma).
Transfections
Duplex siRNA transfections were performed for 72 hours with Ambion Silencer Select siRNAs using Lipofectamine RNAiMAX (Thermo Fisher Scientific). Silencer Select siRNA against p53 (s606) was used at a final concentration of 25 nM. Negative control 1 (4390843) from Ambion served as a non-targeting control siRNA (siCon).
Immunochemical methods
Whole cell extracts were prepared in ice-cold RIPA buffer (50 mM Tris pH 8, 150 mM NaCl, 1% Igepal CA-630, 1% Na-deoxycholic acid, 0.1% SDS) containing 2 mM MgCl2 and Benzonase (25 units/ml, Novagen) and supplemented with protease and phosphatase inhibitors (Roche). Proteins were resolved by SDS-polyacrylamide gel electrophoresis (SDS-PAGE) and transferred onto polyvinylidene fluoride (PVDF) membranes. Membranes were blocked with PBS-Tween20 (0.01%) containing 5% milk powder for 1 hour at room temperature. Primary antibodies in blocking solution were applied over night at 4°C. The following primary antibodies were used for western blot analysis: p53 (mouse, MA5-12571 Thermo Fisher Scientific, 1:1000), KAP1 (rabbit, A300–274A Bethyl, 1:1000). Secondary horseradish peroxidase-coupled antibodies (Thermo Fisher Scientific) were applied for 1 hour at room temperature in PBS-Tween20 (0.01%) containing 1% milk powder prior to detection by ECL-based chemiluminescence.
Quantitative real-time PCR
Quantitative real-time PCR (qRT-PCR) was performed essentially as described previouslyCitation3 on a RotorGene3000 machine (Corbett Life Science). Total RNA was isolated by phenol-chlorophorm extraction, reverse transcribed using the high-capacity cDNA reverse transcription kit (Applied Biosystems), and qRT-PCR was performed in triplicates using the SensiMix Plus SYBR kit (Quantace). The following primer pair sequences were used:
p53 forward: 5′-CGTGTATCAGCAGCCAGACTGC-3′
p53 reverse: 5′-CAAGGGGGACAGAACGTTGTTTTCAG-3′
RPS12 forward: 5′-GGAGGCTTGGGTGCGTTCAAG-3′
RPS12 reverse: 5′-GGTGGCAGTTTTGTTCCGGTTGC-3′
Immunostaining
Cells were grown on sterile 12 mm glass coverslips, fixed in 3% formaldehyde in PBS for 15 minutes at room temperature, washed once in PBS, permeabilized for 5 minutes at room temperature in 0.2% Triton X-100 (Sigma-Aldrich) in PBS, and washed twice in PBS. For denaturing BrdU stainings cells were treated with 2 M HCl for 15 min and neutralized by several washes in 100mM Tris-HCl (pH 7.5). All primary antibodies (see below for specifications) and secondary antibodies (Alexa fluorophores, Life Technologies) were diluted in filtered DMEM containing 10% FBS and 0.02% Sodium Azide. Antibody incubations were performed for 1–2 hours at room temperature. Following antibody incubations, coverslips were washed once with PBS and incubated for 10 minutes with PBS containing 4′,6-Diamidino-2-Phenylindole Dihydrochloride (DAPI, 0.5 μg/ml) at room temperature to stain DNA. After three washing steps in PBS, coverslips were briefly washed with distilled water and mounted on 5μl Mowiol-based mounting media (Mowiol 4.88 (Calbiochem)/Glycerol/TRIS). The following primary antibodies were used for immunostaining: 53BP1 (rabbit, Santa Cruz sc-22760, 1:500), 53BP1 (mouse, Upstate MAB3802, 1:1000), Cyclin A (mouse, Abcam ab 16726, 1:200), Cyclin A (rabbit, Santa Cruz sc-751, 1:100), BrdU (mouse, Abcam ab 6326, 1:100).
Quantitative image-based cytometry (QIBC)
Automated multichannel wide-field microscopy for quantitative image-based cytometry (QIBC) was performed as described previouslyCitation36 on an Olympus ScanR Screening System equipped with an inverted motorized Olympus IX83 microscope, a motorized stage, IR-laser hardware autofocus, a fast emission filter wheel with single band emission filters, and a 12bit digital monochrome Hamamatsu ORCA-FLASH 4.0 V2 sCMOS camera (dynamic range 4000:1, 2048 × 2048 pixel of size 6.5 × 6.5 μm, 12 bit dynamics). For each condition, image information of large cohorts of cells (typically at least 500 cells for the UPLSAPO 40x objective (NA 0.9), at least 2000 cells for the UPLSAPO 20x objective (NA 0.75), and at least 5000 cells for the UPLSAPO 10x (NA 0.4) and UPLSAPO 4x (NA 0.16) objectives) was acquired under non-saturating conditions. Identical settings were applied to all samples within one experiment. Images were analyzed with the inbuilt Olympus ScanR Image Analysis Software Version 2.5.1, a dynamic background correction was applied, nuclei segmentation was performed using an integrated intensity-based object detection module using the DAPI signal, and foci segmentation was performed using an integrated spot-detection module. All downstream analyses were focused on properly detected interphase nuclei containing a 2C–4C DNA content as measured by total and mean DAPI intensities per nucleus. Fluorescence intensities were quantified and are depicted as arbitrary units. Color-coded scatter plots of asynchronous cell populations were generated with Spotfire data visualization software (TIBCO). Within one experiment, similar cell numbers were compared for the different conditions. For visualizing discrete data in scatter plots (e.g. foci numbers), mild jittering (random displacement of data points along the discrete data axes) was applied in order to demerge overlapping data points. Representative scatter plots and quantifications of independent experiments, typically containing several thousand cells each, are shown.
Time-lapse microscopy
Time-lapse microscopy was performed on the same Olympus ScanR Screening System under CO2 (5%) and temperature (37 °C) control and employing an inbuilt infrared-based hardware autofocus. For extended time-lapse imaging for up to 72 h exposure times were kept minimal to avoid phototoxicity. Cells were plated on multi-well plates (Greiner CELLSTAR 96-well-plates, Sigma Aldrich) at a density of 8,000 cells per well 24 h prior to imaging. Images were taken at 30 min intervals for up to 72 h using a UPLSAPO 20x objective (NA 0.75) in Dulbecco's DMEM medium containing 10% FCS (GIBCO) and penicillin-streptomycin. GFP-53BP1 cells were transduced 8 h prior to imaging with BacMam RFP-CDT1 Premo (FUCCI Cell Cycle Sensor BacMam 2.0, Life Technologies) using 0.1 μl of BacMam CDT1-RPF per 8,000 seeded cells in 200 μl of medium. Image processing and analysis was performed with the help of Fiji and Olympus ScanR Analysis software. For showing single cells at defined time-points, brightness and contrast were adjusted for individual frames to correct for background fluorescence. G1 duration was determined based on the CDT1 cell cycle marker.
kccy_a_1383578_sm6696.zip
Download Zip (2.4 MB)Acknowledgments
We are grateful to Hisao Masai for kindly providing the U-2 OS FUCCI cells, to Jiri Lukas for providing GFP-53BP1 cells, and to Johannes Ommer and Beat Schäfer for providing the p53 antibody. We would like to acknowledge the Center for Microscopy and Image Analysis at the University of Zurich, in particular Urs Ziegler and José María Mateos Melero, for excellent microscopy support. We thank all members of the Altmeyer lab for valuable discussions and experimental help. Research in the lab of Matthias Altmeyer is supported by the Swiss National Science Foundation (SNSF Professorship Grant PP00P3_150690), the European Research Council (Horizon 2020 ERC-2016-STG 714326 DiVineGenoMe), the Novartis Foundation for Medical-Biological Research (Grant 16B078), and the Swiss Foundation to Combat Cancer (Stiftung zur Krebsbekämpfung). Aleksandra Lezaja is a member of the Cancer Biology Program of the Life Science Zurich Graduate School.
Related Research Data
References
- Ahuja AK, Jodkowska K, Teloni F, Bizard AH, Zellweger R, Herrador R, Ortega S, Hickson ID, Altmeyer M, Mendez J, et al. A short G1 phase imposes constitutive replication stress and fork remodelling in mouse embryonic stem cells. Nat Commun. 2016;7:10660. doi:10.1038/ncomms10660. PMID:26876348
- Akan P, Alexeyenko A, Costea PI, Hedberg L, Solnestam BW, Lundin S, Hallman J, Lundberg E, Uhlen M, Lundeberg J. Comprehensive analysis of the genome transcriptome and proteome landscapes of three tumor cell lines. Genome Med. 2012;4:86. doi:10.1186/gm387. PMID:23158748
- Altmeyer M, Barthel M, Eberhard M, Rehrauer H, Hardt WD, Hottiger MO. Absence of poly(ADP-ribose) polymerase 1 delays the onset of salmonella enterica serovar typhimurium-induced gut inflammation. Infect Immun. 2010;78:3420-31. doi:10.1128/IAI.00211-10. PMID:20515923
- Altmeyer M, Lukas J. Guarding against collateral damage during chromatin transactions. Cell. 2013;153:1431-4. doi:10.1016/j.cell.2013.05.044. PMID:23791174
- Altmeyer M, Toledo L, Gudjonsson T, Grofte M, Rask MB, Lukas C, Akimov V, Blagoev B, Bartek J, Lukas J. The chromatin scaffold protein SAFB1 renders chromatin permissive for DNA damage signaling. Mol Cell. 2013;52:206-20. doi:10.1016/j.molcel.2013.08.025. PMID:24055346
- Arora M, Moser J, Phadke H, Basha AA, Spencer SL. Endogenous replication stress in mother cells leads to quiescence of daughter cells. Cell Rep. 2017;19:1351-64. doi:10.1016/j.celrep.2017.04.055. PMID:28514656
- Barr AR, Cooper S, Heldt FS, Butera F, Stoy H, Mansfeld J, Novak B, Bakal C. DNA damage during S-phase mediates the proliferation-quiescence decision in the subsequent G1 via p21 expression. Nat Commun. 2017;8:14728. doi:10.1038/ncomms14728. PMID:28317845
- Barr AR, Heldt FS, Zhang T, Bakal C, Novak B. A dynamical framework for the all-or-none G1/S transition. Cell Syst. 2016;2:27-37. doi:10.1016/j.cels.2016.01.001. PMID:27136687
- Bartek J, Lukas J. Pathways governing G1/S transition and their response to DNA damage. Febs Lett. 2001;490:117-22. doi:10.1016/S0014-5793(01)02114-7. PMID:11223026
- Bartkova J, Horejsi Z, Koed K, Kramer A, Tort F, Zieger K, Guldberg P, Sehested M, Nesland JM, Lukas C, et al. DNA damage response as a candidate anti-cancer barrier in early human tumorigenesis. Nature. 2005;434:864-70. doi:10.1038/nature03482. PMID:15829956
- Callen E, Jankovic M, Difilippantonio S, Daniel JA, Chen HT, Celeste A, Pellegrini M, McBride K, Wangsa D, Bredemeyer AL, et al. ATM prevents the persistence and propagation of chromosome breaks in lymphocytes. Cell. 2007;130:63-75. doi:10.1016/j.cell.2007.06.016. PMID:17599403
- Cescutti R, Negrini S, Kohzaki M, Halazonetis TD. TopBP1 functions with 53BP1 in the G1 DNA damage checkpoint. Embo J. 2010;29:3723-32. doi:10.1038/emboj.2010.238. PMID:20871591
- Cuella-Martin R, Oliveira C, Lockstone HE, Snellenberg S, Grolmusova N, Chapman JR. 53BP1 integrates DNA repair and p53-dependent cell fate decisions via distinct mechanisms. Mol Cell. 2016;64:51-64. doi:10.1016/j.molcel.2016.08.002. PMID:27546791
- Dobbelstein M, Sorensen CS. Exploiting replicative stress to treat cancer. Nat Rev Drug Discov. 2015;14:405-23. doi:10.1038/nrd4553. PMID:25953507
- Florenes VA, Maelandsmo GM, Forus A, Andreassen A, Myklebost O, Fodstad O. Mdm2 gene amplification and transcript levels in human sarcomas–relationship to Tp53 gene status. J Natl Cancer Inst. 1994;86:1297-302. doi:10.1093/jnci/86.17.1297. PMID:8064888
- Gaillard H, Garcia-Muse T, Aguilera A. Replication stress and cancer. Nat Rev Cancer. 2015;15:276-89. doi:10.1038/nrc3916. PMID:25907220
- Gorgoulis VG, Vassiliou LVF, Karakaidos P, Zacharatos P, Kotsinas A, Liloglou T, Venere M, DiTullio RA, Kastrinakis NG, Levy B, et al. Activation of the DNA damage checkpoint and genomic instability in human precancerous lesions. Nature. 2005;434:907-13. doi:10.1038/nature03485. PMID:15829965
- Gut G, Tadmor MD, Pe'er D, Pelkmans L, Liberali P. Trajectories of cell-cycle progression from fixed cell populations. Nat Methods. 2015;12:951–4. doi:10.1038/nmeth.3545. PMID:26301842
- Halazonetis TD, Gorgoulis VG, Bartek J. An oncogene-induced DNA damage model for cancer development. Science. 2008;319:1352-5. doi:10.1126/science.1140735. PMID:18323444
- Harrigan JA, Belotserkovskaya R, Coates J, Dimitrova DS, Polo SE, Bradshaw CR, Fraser P, Jackson SP. Replication stress induces 53BP1-containing OPT domains in G1 cells. J Cell Biol. 2011;193:97-108. doi:10.1083/jcb.201011083. PMID:21444690
- Hoppe-Seyler F, Butz K. Repression of endogenous p53 transactivation function in HeLa cervical carcinoma cells by human papillomavirus type 16 E6, human mdm-2, and mutant p53. J Virol. 1993;67:3111-7. PMID:8388491
- Kafri R, Levy J, Ginzberg MB, Oh S, Lahav G, Kirschner MW. Dynamics extracted from fixed cells reveal feedback linking cell growth to cell cycle. Nature. 2013;494:480-3. doi:10.1038/nature11897. PMID:23446419
- Kleiblova P, Shaltiel IA, Benada J, Sevcik J, Pechackova S, Pohlreich P, Voest EE, Dundr P, Bartek J, Kleibl Z, et al. Gain-of-function mutations of PPM1D/Wip1 impair the p53-dependent G1 checkpoint. J Cell Biol. 2013;201:511-21. doi:10.1083/jcb.201210031. PMID:23649806
- Kochetkov DV, Il'inskaia GV, Komarov PG, Strom E, Agapova LS, Ivanov AV, Budanov AV, Frolova EI, Chumakov PM. [Transcriptional inhibition of human papilloma virus in cervical carcinoma cells reactivates functions of the tumor suppressor p53]. Mol Biol (Mosk). 2007;41:515-23. doi:10.1134/S0026893307030120. PMID:17685229
- Liu YW, Heilman SA, Illanes D, Sluder G, Chen JJ. p53-independent abrogation of a postmitotic checkpoint contributes to human papillomavirus E6-induced polyploidy. Cancer Res. 2007;67:2603-10. doi:10.1158/0008-5472.CAN-06-3436. PMID:17363579
- Lukas C, Savic V, Bekker-Jensen S, Doil C, Neumann B, Pedersen RS, Grofte M, Chan KL, Hickson ID, Bartek J, et al. 53BP1 nuclear bodies form around DNA lesions generated by mitotic transmission of chromosomes under replication stress. Nat Cell Biol. 2011;13:243-53. doi:10.1038/ncb2201. PMID:21317883
- Macheret M, Halazonetis TD. DNA replication stress as a hallmark of cancer. Annu Rev Pathol. 2015;10:425-48. doi:10.1146/annurev-pathol-012414-040424. PMID:25621662
- Mankouri HW, Huttner D, Hickson ID. How unfinished business from S-phase affects mitosis and beyond. Embo J. 2013;32:2661-71. doi:10.1038/emboj.2013.211. PMID:24065128
- Minocherhomji S, Ying SM, Bjerregaard VA, Bursomanno S, Aleliunaite A, Wu W, Mankouri HW, Shen HH, Liu Y, Hickson ID. Replication stress activates DNA repair synthesis in mitosis. Nature. 2015;528:286-+. doi:10.1038/nature16139. PMID:26633632
- Moreno A, Carrington JT, Albergante L, Al Mamun M, Haagensen EJ, Komseli ES, Gorgoulis VG, Newman TJ, Blow JJ. Unreplicated DNA remaining from unperturbed S phases passes through mitosis for resolution in daughter cells. Proc Natl Acad Sci U S A. 2016;113:E5757-64. doi:10.1073/pnas.1603252113. PMID:27516545
- Muller PA, Vousden KH. p53 mutations in cancer. Nat Cell Biol. 2013;15:2-8. doi:10.1038/ncb2641. PMID:23263379
- Ochs F, Somyajit K, Altmeyer M, Rask MB, Lukas J, Lukas C. 53BP1 fosters fidelity of homology-directed DNA repair. Nat Struct Mol Biol. 2016;23:714-21. doi:10.1038/nsmb.3251. PMID:27348077
- Overton KW, Spencer SL, Noderer WL, Meyer T, Wang CL. Basal p21 controls population heterogeneity in cycling and quiescent cell cycle states. Proc Natl Acad Sci U S A. 2014;111:E4386-93. doi:10.1073/pnas.1409797111. PMID:25267623
- Panier S, Durocher D. Push back to respond better: Regulatory inhibition of the DNA double-strand break response. Nat Rev Mol Cell Biol. 2013;14:661-72. doi:10.1038/nrm3659. PMID:24002223
- Pedersen RS, Karemore G, Gudjonsson T, Rask MB, Neumann B, Heriche JK, Pepperkok R, Ellenberg J, Gerlich DW, Lukas J, et al. Profiling DNA damage response following mitotic perturbations. Nat Commun. 2016;7:13887. doi:10.1038/ncomms13887. PMID:27976684
- Pellegrino S, Michelena J, Teloni F, Imhof R, Altmeyer M. Replication-coupled dilution of H4K20me2 guides 53BP1 to pre-replicative chromatin. Cell Rep. 2017;19:1819-31. doi:10.1016/j.celrep.2017.05.016. PMID:28564601
- Reaper PM, Griffiths MR, Long JM, Charrier JD, MacCormick S, Charlton PA, Golec JMC, Pollard JR. Selective killing of ATM- or p53-deficient cancer cells through inhibition of ATR. Nat Chem Biol. 2011;7:428-30. doi:10.1038/nchembio.573. PMID:21490603
- Sakaue-Sawano A, Kurokawa H, Morimura T, Hanyu A, Hama H, Osawa H, Kashiwagi S, Fukami K, Miyata T, Miyoshi H, et al. Visualizing spatiotemporal dynamics of multicellular cell-cycle progression. Cell. 2008;132:487-98. doi:10.1016/j.cell.2007.12.033. PMID:18267078
- Schwertman P, Bekker-Jensen S, Mailand N. Regulation of DNA double-strand break repair by ubiquitin and ubiquitin-like modifiers. Nat Rev Mol Cell Biol. 2016;17:379-94. doi:10.1038/nrm.2016.58. PMID:27211488
- Spencer SL, Cappell SD, Tsai FC, Overton KW, Wang CL, Meyer T. The proliferation-quiescence decision is controlled by a bifurcation in CDK2 activity at mitotic exit. Cell. 2013;155:369-83. doi:10.1016/j.cell.2013.08.062. PMID:24075009
- Toledo L, Neelsen KJ, Lukas J. Replication catastrophe: When a checkpoint fails because of exhaustion. Mol Cell. 2017;66:735–49. doi:10.1016/j.molcel.2017.05.001. PMID:28622519
- Toledo LI, Altmeyer M, Rask MB, Lukas C, Larsen DH, Povlsen LK, Bekker-Jensen S, Mailand N, Bartek J, Lukas J. ATR prohibits replication catastrophe by preventing global exhaustion of RPA. Cell. 2013;155:1088-103. doi:10.1016/j.cell.2013.10.043. PMID:24267891
- Zeman MK, Cimprich KA. Causes and consequences of replication stress. Nat Cell Biol. 2014;16:2-9. doi:10.1038/ncb2897. PMID:24366029