
ABSTRACT
We have previously reported a critical role of HMGA proteins in pituitary tumorigenesis since either the Hmga1 or Hmga2 gene overexpression/activation induces the development of mixed growth hormone/prolactin cell pituitary adenomas by activating the E2F transcription factor 1, and then enhancing the G1/S transition of the cell cycle. Consistently, amplification and overexpression of the HMGA2 gene was found in human pituitary prolactinomas. Since impairment of the cell cycle control represents a feature of experimental and human pituitary adenomas, we have investigated the possible synergism between the alterations of other cell cycle regulators, such as p27 deficiency or Cdk4R24C mutation, with Hmga2 overexpression in pituitary tumorigenesis. Therefore, we crossed the Hmga2/T mice, overexpressing the truncated/active form of the Hmga2 gene, either with the knockout mice for p27kip1, or with the knockin mice for the Cdk4R24C mutation, both developing pituitary adenomas.
Increased incidence and decreased latency in the development of pituitary lesions appeared in double mutant Hmga2/T;Cdk4R24C mice, and increased features of invasiveness and atypia were observed in pituitary tumors of both Hmga2/T;p27-ko and Hmga2/T;Cdk4R24C double mutant mice as compared with single mutant compounds. Interestingly, most of these mice develop pituitary adenomas with high Ki67 index, extrasellar expansion and brain tissue infiltration, representing good mouse models for human aggressive pituitary adenomas.
Taken together, the results reported here indicate a cooperation between HMGA2 overexpression and either p27kip1 or CDK4 impairment in promoting pituitary tumor development and progression.
Introduction
Several studies indicate a driving role for the HMGA protein family, including the HMGA1a, HMGA1b and HMGA2 members, in pituitary tumorigenesis [Citation1]. They are chromatin regulating factors acting as cellular oncogenes when overexpressed [Citation2,3]. They act at transcription level by mediating the assembly of multiprotein complexes working on the enhancer and promoter regions of several eukaryotic genes [Citation4]. Several pieces of evidence support a critical role of HMGA overexpression in the development of pituitary adenomas (PAs). Indeed, they are overexpressed in human prolactinomas [Citation5–7], and mice overexpressing either Hmga1 or Hmga2, as well as mice overexpressing a truncated form of Hmga2 (Hmga2/T), develop PAs [Citation8–10]. The enhanced acetylation of E2F1, and its consequent activation, following the binding of Hmga2 with pRb and subsequent displacement of HDAC [Citation11], is crucial for the development of PAs overexpressing the Hmga proteins, since leads to the enhancement of the G1/S phase transition of the cell cycle. Then, the subsequent analysis of human prolactinomas revealed amplification of the HMGA2 locus and HMGA2 gene overexpression in a significant number of cases [Citation5]. According to the critical role of HMGA gene overexpression and E2F1 activation in pituitary tumorigenesis, the microRNA (miRNA) expression profile of GH - somatropic adenomas showed the dowregulation of several miRNAs that are able to target HMGA1, HMGA2 and E2F1 gene with the associated increased expression of these proteins in PAs [Citation12]. Moreover, we also reported that the CCNB2 gene, whose protein product regulates the G2/M phase transition, is upregulated in Hmga-overexpressing PAs [Citation13], thus suggesting that HMGA overexpression is involved in the control of different steps of cell cycle progression [Citation10].
Interestingly, it has been widely reported that cell cycle dysregulation plays a critical role in pituitary tumorigenesis. In fact, more than 80% of human pituitary tumors display cell cycle alterations [Citation10,14], and targeted disruption or overexpression of cell cycle regulators frequently causes onset of pituitary tumors in animal models [Citation10]. Key players in the regulation of cell cycle are cyclin/cyclin-dependent kinase (Cdk) complexes [Citation15]. Among them, Cdk4 and Cdk6, by binding to D-type cyclins, and Cdk2, by binding to E-type cyclins, are involved in cell cycle initiation and G1/S transition through the inactivation of the gatekeeper retinoblastoma protein (pRb), while Cdk2 and Cdk1, by binding to A-type and B-type cyclins, participate in the G2 progression and G2/M transition [Citation16]. The action of the cyclin/Cdk complexes is inhibited by specific Cdk inhibitors that are subdivided in two families: the INK4 (p16INK4a, p15INK4b, p18INK4c and p19INK4d), and the Cip/Kip (p21Cip1, p27kip1 and p57kip2) family. The former is involved in the inhibition of Cdk4/cyclin D and Cdk6/cyclin E complexes, while the latter is committed to inhibit Cdk2/cyclin E, Cdk2/cyclin A, Cdk1/cyclin A and Cdk1/cyclin B complexes, thus operating in different phases of the cell cycle [Citation17]. Interestingly, downregulation of p27kip1 protein expression is frequent in pituitary carcinomas and ACTH-secreting adenomas [Citation18,19], and p27-null mice develop PAs [Citation20–22]. Moreover, components of the pRb/p16/cyclin D1/CDK4 pathway, either alone or in combination, are frequently deregulated in human pituitary tumors [Citation23], and alterations of the p18/CDK4/pRB pathway are involved in the development of PAs in mice [Citation10,24].
The aim of our work has been to evaluate the cooperation of Hmga2/T overexpression with the impairment of other cell cycle regulators. Therefore, we crossed the Hmga2/T transgenic mice with mice carrying functional deficiencies either in p27 (p27-knockout) or Cdk4 (Cdk4R24C knock-in) proteins. The Cdk4R24C knock-in mice have a single miscoding mutation (R24C) in the first exon of the mouse Cdk4 locus, leading to the expression of a Cdk4 protein insensitive to INK4 inhibitors [Citation25]. Cdk4R24C/R24C mice develop a wide spectrum of tumors, including PAs, with an average age at tumor incidence of 8 months and a median survival of 15 months [Citation26]. The p27kip1-knockout mice have a targeted disruption of the murine p27kip1 gene. They also develop PAs, together with a syndrome of multiorgan hyperplasia with features of gigantism and female sterility [Citation20–22]. The inactivation of both INK4 and p27kip1 pathways, by crossing Cdk4R24C knock-in mice with p27kip1-knockout animals led to the development of more invasive and atypical pituitary tumors [Citation27].
Here, we report that in the Hmga2/T transgenic background, p27+/− and p27−/− mice, as well as Cdk4R24C/+ and Cdk4R24C/R24C mice show significantly earlier appearance of pituitary tumors with an increased number of mitoses, overexpression of Ki67, and, in frequent cases, features of malignancy that were diagnosed as aggressive pituitary adenomas. Therefore, the absence of p27kip1, as well as the loss of Cdk4 inhibition, enhances the tumorigenic phenotype in Hmga2/T mice, suggesting that HMGA2 and either p27 loss or CDK4 act cooperatively to promote tumor development and progression.
Results
The loss of p27 increases pituitary tumorigenesis in Hmga2/T transgenic mice
To examine a possible cooperation between Hmga2/T transgene and p27kip1 deficiency, we crossed Hmga2/T transgenic mice with p27 knockout mice. Double mutants Hmga2/T;p27−/− mice developed pituitary tumors significantly earlier than their Hmga2/T;p27+/+ littermates [P = 0.035, Log-rank (Mantell-Cox) test], with a median age of tumor incidence of 8 versus 13 months (HR = 0.4938; 95% CI 0.08110-0.6234) (; ). Unexpectedly, in the new genetic background resulting from the crossing of the two mutant mice, Hmga2/T mice developed more invasive and aggressive pituitary adenomas (). These adenomas appeared usually larger than 6 mm () with microscopic features of malignancy such as nuclear atypia changes, increased mitotic index (), marked angiogenesis (), and infiltration of the surrounding nerve tissue (). The incidence of PAs was similar in Hmga2/T;p27+/+, Hmga2/T;p27+/− and Hmga2/T;p27−/− littermates. However, they showed more aggressive features, such as solid aspects and invasive phenotype, in Hmga2/T;p27−/− and Hmga2/T;p27+/− mice than their Hmga2/T;p27+/+ littermates (). Interestingly, the aggressive adenomas were prevalent in females. Only typical adenomas were observed in mice not carrying the Hmga2/T transgene (data not shown).
Figure 1. Pituitary tumor incidence and features in Hmga2/T;p27-ko mice: (A) Kaplan-Meier survival curves analyzing pituitary tumor incidence in Hmga2/T mice with different p27kip1 genotypes. Mice were monitored and harvested when they exhibited symptoms of disease. As assessed by Log Rank test, the curves were significantly different (P = 0.0212); (B) Gross morphology of a representative PA in a Hmga2/T;p27−/− mouse. Tumor size exceeded 6 mm; (C) Histological section of a representative PA of a Hmga2/T;p27+/+ mouse showing proliferation of neoplastic cells with mild nuclear atypia, and several atypical mitoses (arrows). Original magnification: x40; (D) Histological section of a representative PA of a Hmga2/T;p27+/− mouse showing solid aspects. Note the cancer cells that expand and compress the surrounding brain tissue. Original magnification: x10; (E) Histological section of the sample shown in A. Note the neoplastic cells infiltrating the surrounding brain tissue. Original magnification x20. (F) Schematic representation of percentage of pituitary tumors in 8-months old Hmga2/T;p27 female mice (see also Table S1); (G) gross and histological (H&E) appearance of representative PAs developed by 8-months old Hmga2/T;p27+/+ (left panels) and Hmga2/T;p27+/− (right panels) female mice. Original magnification: x40. Scale Bars: 50 μm.
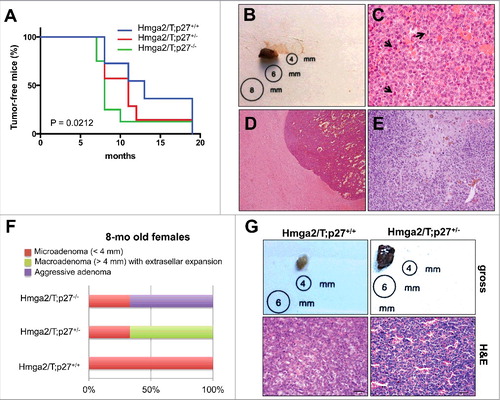
Table 1. Pituitary tumors in HMGA2/T; p27 double mutant mice.
Moreover, if we take in consideration only females sacrificed at 8 months of age to analyze more homogenous groups, a progressive increased growth and invasiveness of the pituitary lesion was evident going from Hmga2/T;p27+/+ mice, showing only microadenomas (<4 mm), to Hmga2/T;p27+/−, mostly showing macroadenomas (>6 mm) with extrasellar expansion, and then Hmga2/T;p27−/− littermates, mostly showing aggressive adenomas (, Table S1).
These results indicate a cooperation between the two mutations and suggest that HMGA2 and p27kip1 exert pituitary growth control at different levels.
Cooperation between the Cdk4R24C mutation and the Hmga2/T transgene in pituitary tumorigenesis
To determine whether Cdk alterations may synergistically act with HMGA2 overexpression in the induction of pituitary neoplasias, we crossed Hmga2/T mice with knock-in mice for the Cdk4R24C mutation. In the new genetic background Hmga2/T mice develop PAs at a median age of 9.5 months, whereas Cdk4R24C mice have a median age of tumor incidence at 17.5 and 7.5 months for heterozygotes and homozygotes, respectively (; Figure S1). Importantly, the average and median age of tumor incidence significantly shortens, the size of tumors increased and invasive aggressive adenomas develop only when both mutations are present (; ; Table S2). Survival curves analyzing the age of incidence of all pituitary lesions, followed by Log-Rank (Mantell-Cox test), showed significant differences between Hmga2/T;Cdk4R24C/R24C and either Hmga2/T;Cdk4+/+ or Hmga2/T;Cdk4R24C/+ mice (P = 0.0338; HR = 0.4361; 95% CI 0.06664-0.6410 and P = 0.0002; HR = 0.2621; 95% CI 0.01371–0.2003, respectively) (). Moreover, if we limit the analysis only to pituitary typical macroadenomas with extrasellar expansion (> 6 mm) and aggressive adenomas, the Hmga2/T;Cdk4R24C/+ group is significantly different from Hmga2/T;Cdk4+/+ mice (P = 0.0263; HR = 0.1419; 95% CI 0.07493–0.8261), and is still significantly different from Hmga2/T;Cdk4R24C/R24C littermates (P < 0.0001; HR = 0.1942; 95% CI 0.004988–0.1230), with a median age of tumor incidence at 19.5 months for Hmga2/T;Cdk4+/+, 12 months for Hmga2/T;Cdk4R24C/+ and 8 months for Hmga2/T;Cdk4R24C/R24C (). Notably, no invasive aggressive adenomas and rare typical macroadenomas develop in Hmga2WT;Cdk4R24C mice (, Table S2). At 7/9 months of age (the average age of tumor incidence in Hmga2/T;Cdk4R24C/R24C mice), differences in tumor size and aggressiveness among the different genotypic groups was particularly marked (Table S3), indicating a progressive enhancement of tumor growth and progression going from Hmga2/T;Cdk4+/+ to Hmga2/T;Cdk4R24C/R24C mice.
Table 2. Pituitary tumors in HMGA2/T; Cdk4R24C double mutant mice.
Figure 2. Pituitary tumor incidence and features in Hmga2/T;Cdk4R24C mice: (A) Kaplan-Meier survival curves analyzing pituitary tumor incidence in Hmga2/T mice with different Cdk4 genotype. Mice were monitored and harvested when they exhibited symptoms of disease. As assessed by Log Rank test, the curves were significantly different (P < 0.0001). No significant differences were observed between Hmga2/T;Cdk4+/+ and Hmga2/T;Cdk4R24C/+ mice; (B) Kaplan-Meier survival curves of mice showing macroadenomas and aggressive adenomas. As assessed by Log Rank test, the curves were significantly different (P < 0.0001). A significant difference was also observed between Hmga2/T;Cdk4+/+ and Hmga2/T;Cdk4R24C/+ mice; (C) Schematic representation of the percentage of specific pituitary tumor subtypes in Hmga2/T;Cdk4R24C mice and related Hmga2wt controls (see also and S2); (D) gross appearance (insets) and histological sections of representative pituitary tumors in Hmga2/T;Cdk4+/+ (α: microadenoma), Hmga2/T;Cdk4R24C/+ (β: macroadenoma) and Hmga2/T;Cdk4R24C/R24C (γ,δ: aggressive adenoma) mice. Micro and macroadenoma show mild to moderate cellular and nuclear pleomorphism and few mitotic figures. Aggressive adenoma shows moderate morphological atypias such as anisokaryosis and anisocytosis and invasive growth in the nervous system, suggesting a clinically aggressive behavior. Original magnification: x40 in α,β,δ and x10 in γ. Scale Bars: 50 μm.
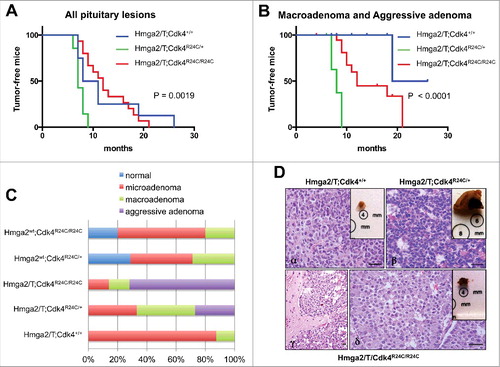
At a gross analysis, the pituitary gland of Hmga2/T;Cdk4+/+ mice appears only slightly increased in volume (<4 mm) in most adenoma cases (, inbox - subpanel α). Conversely, in double mutant mice (Hmga2/T;Cdk4R24C/R24C), it appears from moderately to greatly increased in size, and often shows extrasellar expansive growth (, inbox - subpanel β). Histologically, in Hmga2/T;Cdk4+/+ mice the tumors were characterized by a proliferation of rounded cells showing atypia features such anisokaryosis and anisocytosis and moderate or rare atypical mitoses (, subpanel α), whereas features of moderate atypia and frequent atypical mitoses (about 3 × 10HPF), together with an intense vascularization, were present in Hmga2/T;Cdk4R24C/+ and Hmga2/T;Cdk4R24C/R24C mice ( - subpanel β).
In the tissue samples diagnosed as aggressive pituitary adenomas (31% of Hmga2/T;Cdk4R24C/+ and 71% of Hmga2/T;Cdk4R24C/R24C mice) the neoplastic cells show large nuclei with marked atypia such as anisokaryosis, anisocytosis, big and multiple nucleoli and numerous atypical mitoses (about 4 × 10HPF) ( - subpanels γ, δ). They also show active neoangiogenesis associated with several hemorrhagic areas, sometimes solid aspects and, in the double mutants homozygous for the R24C mutation, invasion of the surrounding nervous tissue ( - subpanels γ, δ, Figure S2). Conversely, HMGA2WT;Cdk4R24C/+ and HMGA2WT;Cdk4R24C/R24C, similarly to Hmga2/T;Cdk4+/+ mice, only showed typical PAs with a phenotype characterized prevalently by small tumor volume, minor/moderate cell atypia and rare atypical mitoses ( and data not shown).
All together these data indicate a cooperation between HMGA2/T and Cdk4R24C mutations in pituitary cell proliferation and tumor progression, suggesting that HMGA2 and Cdk4 exert pituitary cell growth control at different levels.
The cooperation between Hmga2/T and either Cdk4R24C or p27-null mutations leads to enhanced proliferation of pituitary tumor cells
To deeper investigate differences in the cell proliferation rate of PAs developed by Hmga2/T;Cdk4R24C/+ and Hmga2/T;CdkR24C/R24C or Hmga2/T;p27+/− and Hmga2/T;p27−/− mice compared to those derived by Hmga2/T;Cdk+/+ mice and Hmga2/T;p27+/+ mice, respectively, we analyzed Ki67 expression by immunohistochemistry on tumor samples from each genotypic group. Consistent with enhanced cell proliferation in PAs from Hmga2/T;Cdk4R24/+ mice compared to those from Hmga2/T;Cdk+/+ mice, there was a significant increase in the percentage of cells positively stained for Ki67 (P = 0.0325; Mann-Whitney test). A significant increase in PA cell proliferation was also observed in Hmga2/T;CdkR24C/R24C compared to Hmga2/T;Cdk+/+ mice (P = 0.0159; Mann-Whitney test), whereas the number of Ki67 positive cells in Hmga2/T;Cdk4R24/+ PA samples was comparable to that one observed in the aggressive pituitary adenomas from Hmga2/T;Cdk4R24C/R24C mice ().
Figure 3. Ki67 staining of pituitary tumors: (A,B) Percentage of pituitary tumor cells stained positively for Ki67 proliferation marker in Hmga2/T mice with different CDK4 (A) or p27 (B) genotype. Differences among means were statistically significant, according to one-way ANOVA analysis of variance (P values are indicated on the top-left corner of each graph). *, P < 0.05 versus control group (blue bars), according to Mann-Whitney test; (C,D) Representative Ki67 immunostaining of pituitary tumors occurring in Hmga2/T;Cdk4+/+ (C,α), Hmga2/T;Cdk4R24C/+ (C,β), Hmga2/T;Cdk4R24C/R24C (C,γ), Hmga2/T;p27+/+ (D,α), Hmga2/T;p27+/− (D,β) and Hmga2/T;p27−/− (D,γ) mice. Representative negative controls obtained by omitting the primary antibody are shown in panels C,δ and D,δ. Original magnification x40.
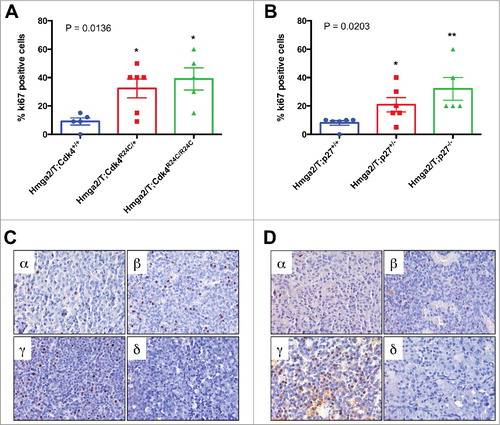
Similarly, compared to Hmga2/T;p27+/+ mice, we found significant differences of PA Ki67 expression in Hmga2/T;p27+/− (P = 0.0325; Mann-Whitney test) and Hmga2/T;p27−/− (P = 0.0022; Mann-Whitney test) mice. A trend for a major Ki67 expression was observed in Hmga2/T;p27−/− mice compared with Hmga2/T;p27+/− tumor samples ().
These results confirm a cooperative role of Hmga2/T and either CDK4R24C or p27-null mutations in enhancing PA cell proliferation, suggesting that the different tumor size observed in Hmga2/T;p27+/− compared to Hmga2/T;p27+/+ mice is due to enhanced PA cell proliferation in Hmga2/T mice carrying at least one knockin allele for CDK4R24C mutation or one p27-knockout allele than compound CDK4 and p27 wild-type mice, respectively. Moreover, the high Ki67 index confirmed the diagnosis of aggressive pituitary adenomas in most of the double mutant mice.
Discussion
Pituitary adenomas (PAs), representing approximately 15% of all brain tumors [Citation28], are invariably benign: their mitotic activity is low, even in aggressive PAs. However, their morbidity is due to mass effects, being locally invasive, and to the inappropriate secretion of pituitary hormones, but they very rarely progress to true malignancy with the presence of extracranial metastases. Despite the standard protocols of treatment, some PAs may have a clinically aggressive course with tendency to recur, becoming giant in size, and/or invading surrounding structures [Citation29]. According to the World Health Organization (WHO), pituitary tumors were initially classified as typical adenomas, atypical adenomas, and carcinomas, where the term ‘atypical’ referred to tumors that disclose aggressive behavior, such as invasive growth, elevated mitotic index, and a Ki67 labeling index >3% [Citation30]. Pituitary carcinomas can only be diagnosed if metastases are documented [Citation31]. These tumors most commonly evolve from invasive, aggressive adenomas that recur over several years rather than presenting as de novo neoplasm [Citation32]. More recently, a new clinicopathological classification of pituitary tumors has been proposed, which takes into account both tumor size and the five IHC subtypes (PRL, GH, FSH/LH, ACTH and TSH), as well as a grading system based on invasion and proliferation status [Citation33]. This classification displayed highly significant prognostic value for predicting post-operative outcome: at 8-year follow-up, the probability of a patient showing evidence of disease or tumor progression was significantly higher if they had an invasive and proliferative tumor than they had a non-invasive and non-proliferative tumor [Citation33]. On these bases the recently released 4th edition of the WHO classification of pituitary neoplasms abandoned the term ‘atypical adenomas’ in favor of ‘aggressive adenomas’, a term that refers to a clinically aggressive behavior of tumors characterized by invasiveness and high proliferative index [Citation34].
According to this, the pituitary phenotype developed by Hmga2/T;CdkR24C/R24C and Hmga2/T;p27−/− double mutant mice, which is in most of the cases invasive and proliferative, should be classified as Grade 2b of the proposed classification by Trouillas et al. [Citation33], and used as model of clinically aggressive pituitary tumors of the 2017 WHO classification [Citation34]. Although pituitary carcinomas, defined by the presence of systemic or cerebro/spinal metastases, are very rare, Raverot et al. discussed that a potential malignancy in pituitary tumors could be reasonably suspected based on the association of the following pathological signs: invasion, neoangiogenesis, vascular invasion, abnormal mitoses, very high index of Ki67 >10%, p53 >5% and genomic alterations, leading to postulate that Grade 2b tumors are indeed malignant tumors without metastases [Citation35]. The mechanisms underlying lack of progression step for these neoplasias is still unknown, even though a premature proliferative arrest, such as senescence, may be hypothesized envisaging a critical role of CDK inhibitors, such as p21cip1, p27kip1 and p15ink4b/p16ink4a, in this process [Citation36,37].
Several animal models developing PAs have been generated [Citation10,38]. In most of cases these mice carry alterations of genes coding for proteins involved in cell cycle regulation. Indeed, mice carrying mutations impairing p27kip1, pRB, CDK4, p18ink4c, p16ink4a, p21cip1 and PTTG1 functions develop PAs of different histotype. Also in the case of the Hmga2 transgenic mice the perturbation of cell cycle control accounts for the development of the mixed growth hormone/prolactin cell pituitary adenomas. In fact, it has been shown that HMGA2 interacts with pRB and induces E2F1 activity in mouse PAs by displacing HDAC1 from the pRB/E2F1 complex, a process that results in E2F1 acetylation, and then activation [Citation11]. Moreover, Cyclin B2/CCNB2 expression has been found drastically upregulated in Hmga2-transgenic mice and in human PAs likely due to a direct effect of the HMGA proteins on CCNB2 promoter [Citation13]. The analysis of the microRNA expression profile of human PAs confirms the role of the cell cycle regulators in PA pathogenesis since it showed a drastic downregulation of several genes targeting cell cycle enhancers, including miR-34b, miR-326, miR-432, miR-548c-3p, miR-570, and miR-603, all targeting HMGA1, HMGA2 and E2F [Citation12], miR-410 targeting Cyclin B1/CCNB1, and miR-130 targeting Cyclin A2/CCNA2 [Citation39,40]. These evidences prompted us to investigate the association of more than one alteration of cell cycle control in pituitary adenoma cell transformation.
Here, we demonstrate that the association of Hmga2 gene overexpression (obtained by transgenic expression of an Hmga2 gene truncated at its third AT-hook and devoid of the 3′UTR) with impairment of CDK inhibitors leads to a more aggressive PA phenotype, with increased size and earlier incidence, in comparison with the Hmga2/T mice, and, even more importantly, in the case of the double mutants Hmga2/T;Cdk4R24C mice, induces the appearance of invasive/aggressive adenomas that represent a rarer finding than typical adenomas in human pituitary pathology. These results may suggest that in human aggressive PAs there might be the involvement of more than one gene regulating cell growth. The mechanism of this gene cooperation may be similar to that of other mouse models, such as mice overexpressing pttg crossed to Rb+/− mice or double knockout for Rb and p27 [Citation41,42]. In fact, HMGA2 overexpression, as Rb deletion, causes E2F1 activation [Citation11]. This molecular feature, which activates entrance into the cell cycle, cooperates with other cell cycle dysregulations, such as pttg overexpression or loss of CDK inhibition, to enhance pituitary tumor development by integrating different regulatory signals.
Interestingly, in the new genetic background resulting from breeding Hmga2/T transgenic mice with p27kip1 knockout mice (a mixed 129Sv/C57BL6J) there is a significant incidence of aggressive adenomas in Hmga2/T mice carrying or not the p27kip1 deficiency. We would imagine the presence of some other unknown factors in this mouse strain that somehow enhance pituitary tumor progression. However, also in this case, if we examine the mice at an earlier time (8 months of age), we observe that a more aggressive tumor is present in Hmga2/T;p27-null mice that may be diagnosed as aggressive adenoma according to the human pathologic classification. It is not surprising at all that the aggressive adenomas are prevalent in females since we have previously demonstrated that PAs in Hmga2 mice had a drastically higher incidence (85% versus 40%), associated with a shorter latency (6 months versus 18 months) in females than males [Citation8], consistently also with human PA pathology [Citation28]. The analysis of tumor Ki67 expression showed an increased cell proliferation in pituitary tumors from Hmga2/T mice carrying at least one knockin allele for mutated CDK4 or one p27-knockout allele than compound CDK4 and p27kip1 wild-type mice, respectively, thus suggesting a cooperation between HMGA2 activation and either CDK4R24C mutation or p27kip1 loss in enhancing pituitary cell proliferation. Accordingly, the higher PA size of both double mutant compared to single mutant mice may be attributed to the enhanced cell proliferation. Therefore, as for p21 that restrains pituitary tumor growth and may cause the failure of benign pituitary tumors to progress to true malignancy [Citation36], our work confirms that other cell cycle inhibitors, such as p27 and p16 may have a similar role.
In conclusion, the results reported here demonstrate that HMGA2 overexpression can cooperate with both CDK4 and p27kip1 pathways in pituitary tumorigenesis, providing a proof of concept for future combined therapies that, by double inhibition of HMGA2 and CDK4 or inhibition of HMGA2 coupled to the restoration of p27kip1 function, may block pituitary tumor proliferation, development and progression. On the basis of previous work having shown that somatostatin (SST) analogues, which play an important role in the medical management of pituitary adenomas for their anti-proliferative effect, stimulate p27 expression in pituitary tumors [Citation43], our study suggests that the treatment of pituitary tumors with SST analogues may inhibit their progression towards a more aggressive adenoma, even though the ability of SST analogues to activate p27kip1 function could also be helpful for the treatment of aggressive adenomas. In fact, no genetic mutations of the gene coding for p27kip1 has been so far found in sporadic PAs [Citation44], but the expression of p27kip1 is lower in pituitary tumors than in normal pituitaries, and is much lower in invasive adenomas and pituitary carcinomas compared with that of typical adenomas [Citation45]. Indeed, despite the reduced response of aggressive PAs to SST analogues, standard therapy with the SST analogues octreotide and lanreotide is considered first-line therapy for aggressive somatotropinomas [Citation46,47], and therapy with pasireotide (another SST analogue with a wider spectrum of SST receptor affinity) may be taken in consideration for resistant cases [Citation48]. Hence, the Hmga2/T;p27−/− and Hmga2/T;CdkR24C/R24C mice, generated in this study, could represent an excellent model to evaluate the ability of SST analogues and other drugs, including dopamine agonists, to inhibit the growth of aggressive PAs.
Materials and methods
Mouse strains, handling, and genotyping
Hmga2/T (formerly known as HMGI-C/T) transgenic mice [Citation49], from a mixed 129Sv/C57BL6J genetic background, were crossed with either p27kip1-null [Citation20], from a mixed 129Sv/C57BL6J genetic background, or Cdk4R24C [Citation23], to obtain double mutant mice, and littermates were used as controls. The genotypes relative to p27kip1 and Cdk4 were analyzed by PCR with genomic DNA isolated from mouse tail, as described [Citation20,23]. For Hmga2/T genotyping, tail DNA digested with BamHI was analyzed by southern blot with a cDNA corresponding to the CMV promoter (only present in transgenic mice).
Mice were sacrificed at any sign of disease and pituitary tissues were recovered for histological and molecular analysis. A group of apparently healthy mice was sacrificed at the age of 7–9 months.
All animal procedures were reviewed and approved by the Institutional Ethical Committee of the Istituto Nazionale dei Tumori, Fondazione Pascale, Naples, Italy, in accordance with Italian regulations for experimentations on animals.
Histological and immunohistochemical analysis
Tissues were surgically removed, fixed by immersion in 10% buffered formalin for at least 24h and then embedded in paraffin using standard procedures. Sections (5 μm) were stained with hematoxylin and eosin (H&E) using standard histologic techniques or processed for the immunohistochemistry. Pituitary tumors were evaluated following criteria defined by Trouillas et al. [Citation33] All tumors were classified based on tumor diameter into micro (<5 mm) and macroadenoma (≥5 mm) and graded as typical adenomas or aggressive adenomas according to their histological features (cellularity, cytoplasmic and nuclear atypia), invasiveness (histological signs of cavernous or sphenoid sinus invasion) and proliferation status (number of mitoses >2/10 HPF and Ki67 labeling index ≥3%). Immunohistochemical detection of Ki67 nuclear antigen was performed with rabbit polyclonal antibody anti-Ki67 (ab 15580, abcam; 1:200 dilution), using the avidin/biotin/peroxidase detection Universal ICQ LSAB plus kit (Dako). To facilitate antigen retrieval, slides were previously microwaved on a DAKO autostainer in 0.01 M citric acid for 10 min and then quenched in 1% H2O2. Micrographs were taken with a photo Zeiss system. All magnifications in legends represent objective lens.
Survival curves and statistical analysis
Kaplan-Meier survival curves were used to analyze the percentage of tumor-free in mice examined during all their life. Differences were analyzed by Log-Rank (Mantell-Cox) test. Ki67 data are expressed as mean +/− SD. Differences among the means were analyzed by one-way ANOVA, and the nonparametric Mann-Whitney test was used to compare two ranks. P values ≤ 0.05 were considered significant for all the statistical tests employed.
Disclosure of potential conflicts of interest
No potential conflicts of interest were disclosed.
2017CC7703R1-s02.ppt
Download MS Power Point (100.5 KB)2017CC7703R1-s01.doc
Download MS Word (28.5 KB)Acknowledgments
We are grateful to Matthew L. Fero and Mariano Barbacid, for sharing the p27-knockout and Cdk4R24C mice, respectively, and to Annamaria Colao for critical discussion about clinical perspectives of this study.
Additional information
Funding
Related Research Data
References
- Fusco A, Fedele M. Roles of HMGA proteins in cancer. Nat Rev Cancer. 2007;7(12):899–910. doi:10.1038/nrc2271. PMID:18004397.
- Fedele M, Berlingieri MT, Scala S, et al. Truncated and chimeric HMGI-C genes induce neoplastic transformation of NIH3T3 murine fibroblasts. Oncogene. 1998;17(4):413–418. doi: 10.1038/sj.onc.1201952. PMID:9696033.
- Wood LJ, Maher JF, Bunton TE, et al. The oncogenic properties of the HMG-I gene family. Cancer Res. 2000;60(15):4256–4261. doi: Published August 2000. PMID:10945639.
- Thanos D, Maniatis T. Virus induction of human IFN beta gene expression requires the assembly of an enhanceosome. Cell. 1995;83(7):1091–1100. doi:10.1016/0092-8674(95)90136-1. PMID:8548797.
- Finelli P, Pierantoni GM, Giardino D, et al. The High Mobility Group A2 gene is amplified and overexpressed in human prolactinomas. Cancer Res. 2002;62(8):2398–2405. doi: Published April 2002. PMID:11956103.
- Pierantoni GM, Finelli P, Valtorta E, et al. High-mobility group A2 gene expression is frequently induced in non-functioning pituitary adenomas (NFPAs), even in the absence of chromosome 12 polysomy. Endocr Relat Cancer. 2005;12(4):867–874. doi:10.1677/erc.1.01049. PMID:16322327.
- Qian ZR, Asa SL, Siomi H, et al. Overexpression of HMGA2 relates to reduction of the let-7 and its relationship to clinicopathological features in pituitary adenomas. Mod Pathol. 2009;22(3):431–441. doi:10.1038/modpathol.2008.202. PMID:19136928.
- Fedele M, Battista S, Kenyon L, et al. Overexpression of the HMGA2 gene in transgenic mice leads to the onset of pituitary adenomas. Oncogene. 2002;21(20):3190–3198. doi:10.1038/sj.onc.1205428. PMID:12082634.
- Fedele M, Pentimalli F, Baldassarre G, et al.: Transgenic mice overexpressing the wild-type form of the HMGA1 gene develop mixed growth hormone/prolactin cell pituitary adenomas and natural killer cell lymphomas. Oncogene. 2005;24(21):3427–3435. doi:10.1038/sj.onc.1208501. PMID:15735694.
- Fedele M, Fusco A. Role of the high mobility group A proteins in the regulation of pituitary cell cycle. J Mol Endocrinol. 2010;44(6):309–318. doi:10.1677/JME-09-0178. PMID:20219853.
- Fedele M, Visone R, De Martino I, et al. HMGA2 induces pituitary tumorigenesis by enhancing E2F1 activity. Cancer Cell. 2006;9(6):459–471. doi:10.1016/j.ccr.2006.04.024. PMID:16766265.
- D'Angelo D, Palmieri D, Mussnich P, et al. Altered microRNA expression profile in human pituitary GH adenomas: down-regulation of miRNA targeting HMGA1, HMGA2, and E2F1. J Clin Endocrinol Metab. 2012;97(7):E1128–E1138. doi:10.1210/jc.2011-3482. PMID:22564666.
- De Martino, I, Visone, R, Wierinckx A, et al. HMGA proteins up-regulate CCNB2 gene in mouse and human pituitary adenomas. Cancer Res. 2009;69(5):1844–1850. doi:10.1158/0008-5472.CAN-08-4133. PMID:19223528.
- Malumbres M, Barbacid M. To cycle or not to cycle: a critical decision in cancer. Nat Rev Cancer. 2001;1(3):222–231. doi:10.1038/35106065. PMID:11902577.
- Sherr CJ, Roberts JM. CDK inhibitors: positive and negative regulators of G1-phase progression. Genes Dev. 1999;13(12):1501–1512. doi:10.1101/gad.13.12.1501. PMID:10385618.
- Pines J, Hunter T. Isolation of a human cyclin cDNA: Evidence for cyclin mRNA and protein regulation in the cell cycle and for interaction with p34cdc2. Cell. 1989;58(5):833–846. doi:10.1016/0092-8674(89)90936-7. PMID:2570636.
- Cheng M, Olivier P, Diehl JA, et al. The p21(Cip1) and p27(Kip1) CDK ‘inhibitors’ are essential activators of cyclin D-dependent kinases in murine fibroblasts. EMBO J. 1999;18(6):1571–1583. doi:10.1093/emboj/18.6.1571. PMID:10075928.
- Bamberger CM, Fehn M, Bamberger AM, et al. Reduced expression levels of the cell-cycle inhibitor p27Kip1 in human pituitary adenomas. Eur J Endocrinol. 1999;140(3):250–255. doi:10.1530/eje.0.1400250. PMID:10216521.
- Lidhar K, Korbonits M, Jordan S, et al. Low expression of the cell cycle inhibitor p27Kip1 in normal corticotroph cells, corticotroph tumors, and malignant pituitary tumors. J Clin Endocrinol Metab. 1999;84(10):3823–3830. doi:10.1210/jcem.84.10.6066. PMID:10523037.
- Fero ML, Rivkin M, Tasch M, et al. A syndrome of multiorgan hyperplasia with features of gigantism, tumorigenesis, and female sterility in p27(Kip1)-deficient mice. Cell. 1996;85(5):733–744. doi:10.1016/S0092-8674(00)81239-8. PMID:8646781.
- Kiyokawa H, Kineman RD, Manova-Todorova KO, et al. Enhanced growth of mice lacking the cyclin-dependent kinase inhibitor function of p27(Kip1). Cell. 1996;85(5):721–732. doi:10.1016/S0092-8674(00)81238-6. PMID:8646780.
- Nakayama K, Ishida N, Shirane M, et al. Mice lacking p27(Kip1) display increased body size, multiple organ hyperplasia, retinal dysplasia, and pituitary tumors. Cell. 1996;85(5):707–720. doi:10.1016/S0092-8674(00)81237-4. PMID:8646779.
- Simpson DJ, Frost SJ, Bicknell JE, et al. Aberrant expression of G(1)/S regulators is a frequent event in sporadic pituitary adenomas. Carcinogenesis. 2001;22(8):1149–1154. doi:10.1093/carcin/22.8.1149. PMID:11470742.
- Quereda V, Malumbres M. Cell cycle control of pituitary development and disease. J Mol Endocr. 2009;42(2):75–86. doi:10.1677/JME-08-0146. doi:10.1677/JME-08-0146.
- Rane SG, Dubus P, Mettus RV, et al. Loss of Cdk4 expression causes insulin-deficient diabetes and Cdk4 activation results in beta-islet cell hyperplasia. Nat Genet. 1999;22(1):44–52. doi:10.1038/8751. PMID:10319860.
- Sotillo R, Dubus P, Martín J, et al. Wide spectrum of tumors in knock-in mice carrying a Cdk4 protein insensitive to INK4 inhibitors. EMBO J. 2001;20(23):6637–6647. doi:10.1093/emboj/20.23.6637. PMID:11726500.
- Sotillo R, Renner O, Dubus P, et al. Cooperation between Cdk4 and p27kip1 in tumor development: a preclinical model to evaluate cell cycle inhibitors with therapeutic activity. Cancer Res. 2005;65(9):3846–3852. doi:10.1158/0008-5472.CAN-04-4195. PMID:15867383.
- Ostrom QT, Gittleman H, Farah P, et al. CBTRUS statistical report: Primary brain and central nervous system tumors diagnosed in the United States in 2006-2010. Neuro Oncol. 2013;15(Suppl 2):ii1–56. doi:10.1093/neuonc/not151. PMID:24137015.
- Colao A, Grasso LF, Pivonello R, et al. Therapy of aggressive pituitary tumors. Expert Opin Pharmacother. 2011;12(10):1561. doi:10.1517/14656566.2011.568478. PMID:21434849.
- Lloyd RV, Kovacs K, Young WF, et al. Pituitary tumors. In: DeLellis RA, Lloyd RV, Heitz PU, Eng C, editors. Pathology and genetics of tumours of endocrine organs. Lyon: IARC Press; 2004. p. 10–13.
- Syro LV, Rotondo F, Ramirez A, et al. Progress in the diagnosis and classification of pituitary adenomas. Front Endocrinol (Lausanne). 2015;6:97. doi:10.3389/fendo.2015.00097. PMID:26124750.
- Lopes MB, Scheithauer BW, Schiff D. Pituitary carcinoma: diagnosis and treatment. Endocrine. 2005;28:115–121. doi:10.1385/ENDO:28:1:115. PMID:16311418.
- Trouillas J, Roy P, Sturm N, et al. A new prognostic clinicopathological classification of pituitary adenomas: a multi- centric case-control study of 410 patients with 8 years post-operative follow-up. Acta Neuropathol. 2013;126(1):123–135. doi:10.1007/s00401-013-1084-y. PMID:23400299.
- Lloyd RV, Osamura RY, Klöppel G, et al. WHO classification of tumours of endocrine organs. 4th ed. Lyon: IARC Press; 2017.
- Raverot G, Jouanneau E, Trouillas J. Management of endocrine disease: clinicopathological classification and molecular markers of pituitary tumours for personalized therapeutic strategies. Eur J Endocrinol. 2014;170(4):R121–R132. doi:10.1530/EJE-13-1031. PMID:24431196.
- Chesnokova V, Zonis S, Kovacs K, et al. p21(Cip1) restrains pituitary tumor growth. Proc Natl Acad Sci USA. 2008;105(45):17498–17503. doi:10.1073/pnas.0804810105. PMID:18981426.
- Chesnokova V, Zonis S, Rubinek T, et al. Senescence mediates pituitary hypoplasia and restrains pituitary tumor growth. Cancer Res. 2007;67(21):10564–10572. doi:10.1158/0008-5472.CAN-07-0974. PMID:17975001.
- Cano DA, Soto-Moreno A, Leal-Cerro A. Genetically engineered mouse models of pituitary tumors. Front Oncol. 2014;4:203. doi:10.3389/fonc.2014.00203. PMID:25136513.
- Müssnich P, Raverot G, Jaffrain-Rea ML, et al. Downregulation of miR-410 targeting the cyclin B1 gene plays a role in pituitary gonadotroph tumors. Cell Cycle. 2015;14(16):2590–2597. doi:10.1080/15384101.2015.1064207. PMID:26125663.
- Leone V, Langella C, D'Angelo D, et al. Mir-23b and miR-130b expression is downregulated in pituitary adenomas. Mol Cell Endocrinol. 2014;390(1-2):1–7. doi:10.1016/j.mce.2014.03.002. PMID:24681352.
- Donangelo I, Gutman S, Horvath E, et al. Pituitary tumor transforming gene overexpression facilitates pituitary tumor development. Endocrinology. 2006;147(10):4781–4791. doi:10.1210/en.2006-0544. PMID:16809444.
- Park MS, Rosai J, Nguyen HT, et al. p27 and Rb are on overlapping pathways suppressing tumorigenesis in mice. Proc Natl Acad Sci USA. 1999;96(11):6382–6387. doi:10.1073/pnas.96.11.6382. PMID:10339596.
- Hubina E, Nanzer AM, Hanson MR, et al. Somatostatin analogues stimulate p27 expression and inhibit the MAP kinase pathway in pituitary tumours. Eur J Endocrinol. 2006;155(2):371–379. doi:10.1530/eje.1.02213. PMID:16868153.
- Zhou Y, Zhang X, Klibanski A. Genetic and epigenetic mutations of tumor suppressive genes in sporadic pituitary adenoma. Mol Cell Endocrinol. 2014;386(0):16–33. doi:10.1016/j.mce.2013.09.006. PMID:24035864.
- Korbonits M, Chahal HS, Kaltsas G, et al. Expression of phosphorylated p27(Kip1) protein and Jun activation domain-binding protein 1 in human pituitary tumors. J Clin Endocrinol Metab. 2002;87(6):2635–2643. doi:10.1210/jcem.87.6.8517. PMID:12050228.
- Giustina A, Mazziotti G, Torri V, et al. Meta-analysis on the effects of octreotide on tumor mass in acromegaly. PLoS One. 2012;7(5):e36411. doi:10.1371/journal.pone.0036411. PMID:22574156.
- Colao A, Auriemma RS, Pivonello R. The effects of somatostatin analogue therapy on pituitary tumor volume in patients with acromegaly. Pituitary. 2016;19(2):210–221. doi:10.1007/s11102-015-0677-y.
- Bronstein MD, Fleseriu M, Neggers S, et al. Pasireotide C2305 Study Group. Switching patients with acromegaly from octreotide to pasireotide improves biochemical control: crossover extension to a randomized, double-blind, Phase III study. BMC Endocr Disord. 2016;16:16. doi:10.1186/s12902-016-0096-8. PMID:27039081.
- Battista S, Fidanza V, Fedele M, et al. The expression of a truncated HMGI-C gene induces gigantism associated with lipomatosis. Cancer Res. 1999;59(19):4793–4797. doi: Published October 1999. PMID:10519386.