
ABSTRACT
RNA polymerase (Pol) III transcribes small untranslated RNAs that are essential for cellular homeostasis and growth. Its activity is regulated by inactivation of tumor suppressor proteins and overexpression of the oncogene c-MYC, but the concerted action of these tumor-promoting factors on Pol III transcription has not yet been assessed. In order to comprehensively analyse the regulation of Pol III transcription during tumorigenesis we employ a model system that relies on the expression of five genetic elements to achieve cellular transformation. Expression of these elements in six distinct transformation intermediate cell lines leads to the inactivation of TP53, RB1, and protein phosphatase 2A, as well as the activation of RAS and the protection of telomeres by TERT, thereby conducting to full tumoral transformation of IMR90 fibroblasts. Transformation is accompanied by moderately enhanced levels of a subset of Pol III-transcribed RNAs (7SK; MRP; H1). In addition, mRNA and/or protein levels of several Pol III subunits and transcription factors are upregulated, including increased protein levels of TFIIIB and TFIIIC subunits, of SNAPC1 and of Pol III subunits. Strikingly, the expression of POLR3G and of SNAPC1 is strongly enhanced during transformation in this cellular transformation model. Collectively, our data indicate that increased expression of several components of the Pol III transcription system accompanied by a 2-fold increase in steady state levels of a subset of Pol III RNAs is sufficient for sustaining tumor formation.
Introduction
Tumoral transformation is the result of a multistep process including the inactivation of tumor suppressor gene products and the activation of oncogenes. Hallmarks of this process are the acquirement of replicative immortality and the capability of anchorage-independent growth under tissue culture conditions. This process leads in vivo to tumor formation, invasion and the generation of metastases [Citation1]. A straightforward model for the generation of tumor cells from primary cells was published. In this model the inactivation of RB1, TP53 and protein phosphatase 2A (PP2A) by defined genetic elements, combined with the constitutive activation of RAS, is sufficient for overriding cell cycle control points. The additional introduction of the catalytic component of telomerase (TERT) immortalizes these cells and completes the transformation process, leading to the creation of tumor cells [Citation2,3].
Regulation of gene expression is essential for the homeostasis of cells and for coordinated development of multicellular organisms. In mammalian cells, nuclear gene expression is accomplished by three DNA-dependent RNA polymerases with specialized functions. In humans, RNA polymerase (Pol) I transcribes 47S ribosomal (r)RNA which contributes to the structure and enzymatic activity of the ribosome [Citation4]. Pol II transcribes messenger (m)RNAs, long non coding (lnc)RNAs, small nuclear (sn) and nucleolar (sno)RNAs, as well as micro (mi)RNAs [Citation5–8]. Pol III transcribes a variety of small untranslated RNAs, regulating essential cellular processes including transcription (7SK RNA; Alu RNAs), RNA processing (U6 RNA; RNAse P; RNAse MRP), translation (5S rRNA; tRNAs) and protein translocation (7SL RNA) [Citation9]. Transcription of Pol III-transcribed genes is governed by promoters that are either located within the transcribed region (type 1: 5S gene; type 2: tRNA and Alu genes) or positioned upstream the transcription initiation site (type 3: U6, 7SK, H1 genes). Transcription factors required for the expression of these Pol III genes (TFIIIA; TFIIIB; TFIIIC; PBP/PTF/SNAPc) have been identified and the cDNAs encoding these factors have been cloned [Citation10,11].
Pol III transcription activity is correlated with cell growth and cell division [Citation12,13] (reviewed in [Citation10]). Several studies point to an important role of Pol III transcription in the process of cellular transformation. Pol III transcription is repressed by tumor supressor genes (TP53 [Citation14,15]; RB1 [Citation16,17]; PTEN [Citation18]; ARF/CDKN2A [Citation19]; BRCA1 [Citation20];) and enhanced by the proto-oncogene MYC [Citation21], as well as by components of the MAP kinase pathway (ERK [Citation22]; JNK1 [Citation23];). In addition, it has recently been shown that ectopic expression of tRNA-GluUUC and tRNA-ArgCCG leads to triple negative breast cancer (TNBC) progression towards invasion and metastasis through induction of EXOSC2- and GRIPAP1- expression [Citation24]. The influence of tumor suppressor gene and oncogene products on the regulation of Pol III transcription has individually been shown, but their relative contributions to the deregulation of Pol III transcription during cell transformation within a coherent model system of cellular transformation have not yet been analyzed. Here we present the results of our study on the expression of components of the Pol III transcription system and the activities of the Pol III transcription machinery during transformation of primary human IMR90 fibroblasts with defined genetic elements. Our results demonstrate that the protein levels of several subunits of Pol III and its cognate transcription factors TFIIIB, TFIIIC and PTF/SNAPc increase during cell transformation. Surprisingly however, the expression levels of many Pol III transcripts remain unchanged during the process of cell transformation and only those of 7SK- and H1- and MRP-RNA genes are increased.
Results
Transformation of primary human IMR90 fibroblasts with defined genetic elements
In order to analyze the regulation of RNA polymerase III transcription during tumorigenesis, we transformed primary human embryonic IMR90 fibroblasts with defined genetic elements. This involves ectopic expression of (i) human papillomavirus (HPV16) proteins E6 and E7, which inactivate tumor suppressor proteins TP53 and RB1, respectively, (ii) SV40 small t antigen, which inactivates protein phosphatase 2A (PP2A), (iii) constitutively active RAS (RAS-G12V) and (iv) the telomerase catalytic subunit TERT, which protects telomeres from shortening. This model system is slightly modified from a published protocol [Citation2,3] by utilizing papillomavirus E6 and E7 proteins instead of SV40 large T for inactivating TP53 and RB1 (the effects of papillomavirus E6 and E7 proteins, as well as of SV40 Large T-antigen were reviewed by Levine [Citation25]). By employing these five defined genetic elements, we established 16 distinct cell lines (transformation intermediates) that stably express either one of these elements alone or several different combinations thereof. We chose 6 of the 16 transformation intermediate cell lines that represented the most relevant steps in the process of transformation and constructed a biological replicate of these six cell lines. We analyzed the expression of the individual genetic elements in the cell lines of both systems by RT-qPCR and by western blot ( and Suppl. Fig. 1). Due to the lack of specific antibodies recognizing E6, E7 and TERT, we determined the expression of a direct E6 target (TP53; ) [Citation26] and an indirect E7 target (CDKN2A; p16; ) [Citation27] and analyzed the reverse transcriptase activity of telomerase by the telomere repeat amplification protocol (TRAP) assay [Citation28] (). The disappearance of TP53 correlates well with the expression status of E6 (, uppermost panel; compare lane 1 with lanes 2–6). We observe a strong overexpression of CDKN2A (p16) in cell lines that ectopically express E7 (, second panel from the top; compare lane 1 with lanes 2, 4 and 6), which is repressed by RAS-G12V (, lanes 3 and 5), unless TERT is simultaneously expressed (, lane 6).
Figure 1. Expression and activity of genetic elements employed for the transformation of human IMR90 fibroblasts. The following cell lines were analyzed: IMR90; IMR90/E6/E7 (90/6/7); IMR90/E6/E7/RAS (90/6/7/R); IMR90/E6/E7/small t (90/6/7/S); IMR90/E6/E7/RAS/small t (90/6/7/R/S); IMR90/E6/E7/RAS/small t/TERT (90/6/7/R/S/T). (A.) Western blot analyses of the expression of TP53 (uppermost panel), CDKN2A / p16 (second panel from the top), RAS (second panel from the bottom) and of SV40 small t antigen (lowermost panel). Cell lines analyzed are appropriately indicated below the images. 30 µg of nuclear extract (for the analysis of TP53, CDKN2A and RAS expression) or cytoplasmic extract (SV40 small t expression) were loaded per lane and separated by SDS 12% -PAGE. (B.) Telomere repeat amplification assay (TRAP). 2µg of cellular lysate were employed for each assay [Citation50]. TRAPEZE Telomerase Detection Kit (Millipore) positive control reaction without (lane 1) or after heat inactivation (lane 2). Individual cell lines analyzed are appropriately indicated below the image. Odd numbers: without heat treatment; even numbers: after heat inactivation.
![Figure 1. Expression and activity of genetic elements employed for the transformation of human IMR90 fibroblasts. The following cell lines were analyzed: IMR90; IMR90/E6/E7 (90/6/7); IMR90/E6/E7/RAS (90/6/7/R); IMR90/E6/E7/small t (90/6/7/S); IMR90/E6/E7/RAS/small t (90/6/7/R/S); IMR90/E6/E7/RAS/small t/TERT (90/6/7/R/S/T). (A.) Western blot analyses of the expression of TP53 (uppermost panel), CDKN2A / p16 (second panel from the top), RAS (second panel from the bottom) and of SV40 small t antigen (lowermost panel). Cell lines analyzed are appropriately indicated below the images. 30 µg of nuclear extract (for the analysis of TP53, CDKN2A and RAS expression) or cytoplasmic extract (SV40 small t expression) were loaded per lane and separated by SDS 12% -PAGE. (B.) Telomere repeat amplification assay (TRAP). 2µg of cellular lysate were employed for each assay [Citation50]. TRAPEZE Telomerase Detection Kit (Millipore) positive control reaction without (lane 1) or after heat inactivation (lane 2). Individual cell lines analyzed are appropriately indicated below the image. Odd numbers: without heat treatment; even numbers: after heat inactivation.](/cms/asset/261c6bd1-5300-4f81-a9dd-11bc1d4877c0/kccy_a_1405881_f0001_b.gif)
Small t and RAS-G12V overexpression was directly detected by western blot with antibodies specifically recognizing these proteins (Panels 3 and 4 from the top in ). Surprisingly, co-expression of small t and RAS-G12V together with either E6 or E7 results in barely detectable small t protein levels ( lane 5, lowest panel; Suppl. Fig. 1, lanes 5, 9 and 13, lowest panel). In contrast, co-expression of small t, RAS-G12V, E6, E7 and TERT results in clearly detectable small t protein levels (, lane 6; Suppl. Fig. 1 lowest panel, lane 16). However, comparable levels of SV40 small t mRNA are detected by RT-qPCR in all cell lines that were engineered to express SV40 small t antigen (data not shown). These data indicate that expression of RAS-G12V reduces small t protein levels in cell lines with impaired RB and TP53 functions, but not or to a lesser extent in cell lines that co-express TERT.
The expression of telomerase and its function were respectively assayed by RT-qPCR (data not shown) and by the telomere repeat amplification protocol (TRAP) [Citation28]. The cell line ectopically expressing TERT (, lane 13) as well as the control (lane 1) show robust expression and activity of TERT. Collectively, these data indicate that the genetic elements are expressed as expected in the corresponding cell lines.
Characterization of the expression of cell cycle regulators in the cellular model system of transformation
We next analyzed the impact of the expression of these genetic elements in IMR90 fibroblasts on mRNA expression levels of known cell cycle regulators. We determined expression levels in cycling cells (10% fetal calf serum) and in cells that were grown under growth factor restrictive conditions (serum starvation in 0.2% fetal calf serum) for 48 hours. Upon cell transformation, we observe under both conditions increased mRNA levels of E2F1, CDKN2A, S-phase and mitotic cyclins (CCNA2; CCNB1; CCNB2) and of CDKs 1, 2 and 4 (Suppl. Figs 2 and 3). The increase is particularly strong for E2F1, CDK1, CDK2 and CCNA2 compared to IMR90 cells. E2F1, CDK1 and CDK2 mRNA levels are most prominently increased upon serum starvation. In contrast, the alterations in the expression of CDK6, and CCND1, are less pronounced and range from repression (CDK6; CCND1) to modest increase (CCNE1; Suppl. Figs 2 and 3). Overexpression of CDKN2A can be attributed to the expression of HPV-E7 [Citation27]. Collectively, the expression data indicate that the transformation process inactivates the G1-S check point (low expression of CCND1; CDK6), increasing the percentage of cells that are in S-G2-M phases of the cell cycle (high expression of CDK1; CDK2; CCNA2; CCNB2; AURKA; cyclin and CDK expression is reviewed in [Citation29]). mRNA expression levels of other cell cycle regulators (TP53, RB1, CDKN1B (p27)) are only slightly altered (Suppl. Figs. 2 and 3). Expression of mRNAs encoding cell cycle regulators was corroborated by a single-run RNA-sequencing experiment that we conducted with the six cell lines of the biological replicate system (IMR90; IMR90/E6/E7; IMR90/E6/E7/RAS-G12V; IMR90/E6/E7/small t; IMR90/E6/E7/RAS-G12V/small t; IMR90/E6/E7/RAS-G12V/small t/TERT; Suppl. table 1). The changes in cyclin and CDK expression fit furthermore well to FACS analyses confirming that higher percentages of cells are found in G2/M phases of the cell cycle in transformation intermediate and completely transformed cells than in parent IMR90 fibroblasts. FACS analysis also clearly shows that inactivation of TP53 and of RB1 almost completely abolishes the G1-S cell cycle check point (Suppl. Fig. 4). Thus, FACS analyses confirm the mRNA expression data indicating that the expression of many cell cycle regulators, notably of CDK1, CDK2, CDK4, CCNA and of E2F1 is deregulated upon TP53 and RB1 inactivation (Suppl. Figs 2 and 3)
Figure 2. Analyses of tumor cell growth properties of IMR90 cells and transformation intermediates derived therefrom. (A) Soft agar assay. Colour codes of cell lines analyzed are appropriately indicated to the right of the graph. Mean numbers of colonies +/- standard deviation that were generated per 5 × 10⁵ cells seeded are shown on the Y-axis. Three independent experiments have been performed. Statistically significant differences between the groups were determined by analysis of variance (ANOVA). p-values of Tukey's post-hoc analyses are presented. *P<0.05, **P<0.01 and ***P<0.001. (B) Tumor cell growth in CB17 SCID Beige mice. The cell lines that have been employed are indicated to the right. The mean tumor volume +/- standard deviation in mm3 is shown on the Y-axis. The results were obtained from three independent experiments. (C) Sphere formation assay. The cell lines employed are indicated below the graph. The number of spheres +/- standard deviation that were formed per 103 cells seeded is shown on the Y-axis. The data have been obtained from three independent experiments.
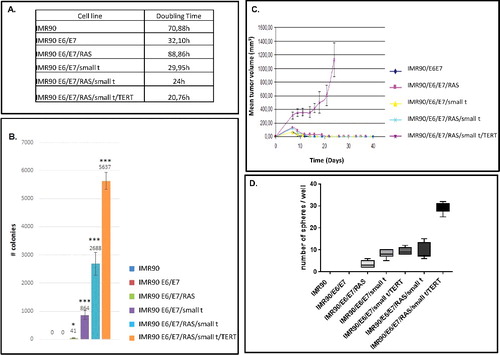
Analysis of soft agar growth and tumor formation properties in nude mice of transformation intermediate cell lines
The transformation status of cells was determined by soft-agar assays and by tumor formation in nude mice. In addition, we determined the doubling time of individual cell lines (). As expected, IMR90 fibroblasts are not able to form colonies in soft-agar assays (, lane 1), whereas cells expressing E6/E7/small t form about 800 colonies / 5 × 10⁵ cells seeded and the most highly transformed cells up to 5000–6000 colonies /5 × 105 cells seeded (, lanes 4–6). The mean size of individual colonies likewise increases along the process of transformation from 32.3 µm to 99 µm (Suppl. Fig. 5).
Efficient tumor formation after intracutaneous injection into CB17 SCID Beige mice is only observed with IMR90 fibroblasts expressing all five genetic elements (IMR90/E6/E7/RAS/small t/TERT). All other cell lines, even if they are efficiently forming colonies in soft agar, are unable to form tumors in mice ().
In addition, we analyzed stem cell-like growth properties of IMR90 cells in six distinct transformation intermediates by sphere formation assays () [Citation30,31]. These experiments show that IMR90 and IMR90/E6/E7 cells are unable to form spheres, whereas the other five transformation intermediates are able to do so.
We then determined the genomic profile of individual cell lines of the first model by CGH array. These experiments demonstrate normal profiles for all cell lines except the most transformed cell line (IMR90/E6/E7/RAS/small t/TERT), which exhibit a gain of the chromosome 20q region, and the IMR90/E6/E7/RAS/ small t cell line which shows a loss in chromosome X (Suppl. Fig. 6).
mRNA expression of components of the RNA polymerase III transcription machinery
Having established that the genetic elements that had been introduced into IMR90 fibroblasts were appropriately expressed and led to the stepwise transformation of these cells, we next determined whether the expression of Pol III subunits or transcription factors was altered during transformation. By employing RT-qPCR and western blot analyses we assessed mRNA and protein levels of most RNA polymerase III transcription factors and some Pol III subunits in cellular lysates (mRNA) or nuclear extracts (proteins) derived from the 6 transformation intermediate cell lines. We analyzed mRNA levels of most primary DNA-binding Pol III transcription factors (GTF3A; GTF3C1-6; SNAPC1-4). Of these factors, we assessed protein levels of GTF3C1-5. In addition, we analyzed mRNA and protein levels of all components of TFIIIBα (TBP; BDP1; BRF2) and of TFIIIBβ (TBP; BDP1; BRF1). Furthermore, we determined mRNA levels of 5 Pol III subunits (POLR3C; POLR3D; POLR3F; POLR3G; POLR3GL). Finally, we also analyzed protein levels of four of these five Pol III subunits (POLR3C; POLR3D; POLR3F; POLR3G).
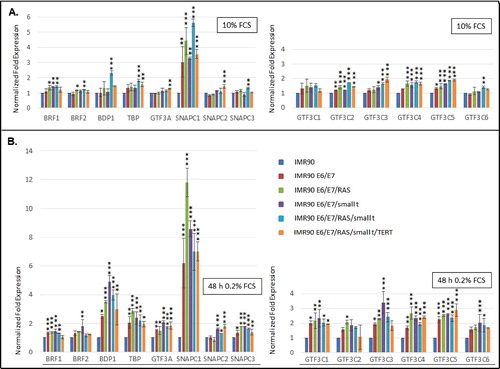
Our results show that mRNA levels of most Pol III subunits () and transcription factors () do not vary substantially during the transformation process. Under normal cell culture conditions, a more than 3-fold increase in mRNA expression is only observed for SNAPC1 () and POLR3G (). Under serum starvation, the expression of SNAPC1 is strongly induced upon transformation (, sixth panel from the left). In addition, we observe increased expression of POLR3F and BDP1 mRNAs ( and ). Enhanced expression levels of POLR3G mRNA strongly correlate with the expression of small t protein and are slightly repressed by the expression of RAS-G12V ( and , fourth panel from the left).
Figure 3. RT-qPCR analyses of the expression of Pol III subunits. (A.) Expression of POLR3C, -D, -F, -G and GL in cells grown in the presence of 10% Fetal calf serum (FCS) (B.) Expression of POLR3C, -D, -F, -G and GL in cells grown in the presence of 0.2% FCS. The colour code of individual cell lines employed is depicted to the right. The genes analysed are appropriately indicated below the graphs. RT-qPCR data were normalized relative to expression in IMR90 cells and to the expression of PPIA and PMM1 genes that were determined as stable housekeeping genes in the transformation model system by employing the Bestkeeper software. Normalization of expression in cells grown in 10% FCS or 0.2% FCS is relative to IMR90 cells grown under the same conditions. Data were obtained from three independent experiments and standard deviation is shown. Statistically significant differences between the groups were determined by analysis of variance (ANOVA). p-values of Tukey's post-hoc analyses are presented. *P<0.05, **P<0.01 and ***P<0.001.
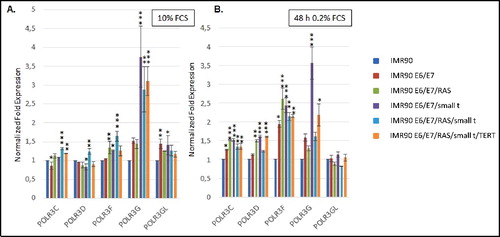
Figure 4. RT-qPCR analyses of the expression of Pol III transcription factors. (A.) Expression of TFIIIA and subunits of TFIIIB, TFIIIC and SNAPc in cells grown in the presence of 10% Fetal calf serum (FCS) (B.) Expression of TFIIIA and subunits of TFIIIB, TFIIIC and SNAPc in cells grown in the presence of 0.2% FCS. The colour code of individual cell lines employed is depicted to the right. The genes analysed are appropriately indicated below the graphs. RT-qPCR data were normalized relative to expression in IMR90 cells and to the expression of PPIA and PMM1 genes that were determined as stable housekeeping genes in the transformation model system by employing the Bestkeeper software. Normalization of expression in cells grown in 10% FCS or 0.2% FCS is relative to IMR90 cells grown under the same conditions. Data were obtained from three independent experiments and standard deviation is shown. Statistically significant differences between the groups were determined by analysis of variance (ANOVA). p-values of Tukey's post-hoc analyses are presented. *P<0.05, **P<0.01 and ***P<0.001.
RNA-sequencing confirmed the changes in mRNA expression that we determined for basal Pol III transcription components (Suppl. table 2). In addition, these results suggest that POLR3G and SNAPC1 are the only basal components of the three nuclear RNA polymerase systems that are strongly upregulated in their mRNA expression levels during tumoral transformation (Suppl. tables 2–4).
Protein expression of components of the RNA polymerase III transcription machinery
Alterations in mRNA levels of Pol III transcription factors and subunits did not necessarily coincide with similar changes in protein levels of the same factors. We observe significant increases in the protein levels of several components of the Pol III transcription apparatus during cellular transformation. TFIIIC subunits GTF3C1 – GTF3C5 exhibit enhanced protein levels as soon as TP53 and RB1 are inactivated by expression of HPV E6 and E7, respectively (), although none of these subunits shows increased mRNA levels (). The increase in protein levels for these subunits is independent of whether cells had been grown in the presence of serum or under serum starvation. As observed for TFIIIC subunits, we also detect changes in protein levels of several TFIIIBα and TFIIIBβ [Citation32] subunits (BRF1 [Citation33], BRF2 [Citation34], TBP, BDP1 [Citation35]). BRF1 is required for transcription of Pol III genes with gene-internal promoters (e.g. tRNA, 5S rRNA etc.) whereas BRF2 drives expression of Pol III genes with promoters located upstream the transcription start site (e.g. 7SK RNA, U6 RNA, H1 RNA etc.) [Citation32–35]. Expression of BRF2 increases during tumoral transformation. BDP1 protein levels were difficult to assess since several protein bands of about 90, 120, 150, 220 and 280 kDa reacted with the anti-TFIIIB150 antibodies. These protein bands could either correspond to splicing variants of BDP1 that have been described earlier [Citation36] or represent degradation products of full length BDP1. Overall, expression of the 280 kDa band (indicated on by an asterisk) that reacts with the anti-TFIIIB150 antibodies, probably corresponding to full length BDP1 remains unchanged during the transformation process. This expression pattern does not reflect enhanced BDP1 mRNA levels that we observe upon serum starvation in several transformation intermediates (). In contrast to the changes in the expression of BRF2, alterations in the expression of BRF1 are more complex since two bands react with the anti-BRF1 antibodies. One of the bands approximately corresponds to the calculated mass for BRF1 (73.84 kDa for 677 amino acids), whereas the band of 90 kDa is usually observed in western blots in transformed cell lines and may represent post-translationally modified BRF1. The highest BRF1 protein levels do not coincide with complete cellular transformation, but its expression is already maximally increased in IMR90 cells expressing E6 and E7, leading to impaired TP53 and RB function ( uppermost panel). Taken together, the protein levels of BRF1 and BRF2, increase during cell transformation, whereas those of BDP1 and TBP remain stable.
Figure 5. Western blot analyses of the expression of Pol III subunits and transcription factors. (A.) Analyses of subunits of TFIIIC. (B.) Analyses of subunits of TFIIIB. (C). Analyses of RNA polymerase III subunits. The numbers below the figures correspond to the cell lines listed in the table in the bottom right corner of the Figure. The proteins analysed are appropriately indicated to the right of individual images. Extracts derived from cells grown with 10% FCS or 0.2% FCS are respectively shown in left or right panels of each Figure.
Protein levels of POLR3D (RPC53) and of POLR3G (RPC32α) also increase (, uppermost and lowest panel). In contrast, the protein expression levels of POLR3F (RPC39) and POLR3C (RPC62) only exhibit minor changes in cells grown in the presence of serum, whereas RPC39 protein expression is enhanced upon transformation in serum-starved cells (, nd and 3rd panel from the top). Taken together, the expression of proteins of the Pol III transcription apparatus is generally enhanced upon expression of E6 and E7 proteins, but little further increase is observed in subsequent steps of transformation.
Expression of Pol III transcribed RNAs is moderately altered during cellular transformation
Since we observed changes in the protein expression of several components of the Pol III transcription apparatus, we also analyzed Pol III-transcribed RNA levels by northern blot (). To our surprise, expression levels of known Pol III transcripts are in general not dramatically affected by cellular transformation, although this process was accompanied by enhanced expression of several Pol III transcription factors and polymerase subunits ( and ). As shown in , only 7SK, H1 and MRP RNAs show enhanced expression levels upon cellular transformation. Expression of 7SK RNA is enhanced up to about 2.5-fold compared to 5.8S RNA expression levels (). The expression of 5.8S RNA did not change relative to that of mRNA reference genes (RT-qPCR; data not shown). Determination of Pol III RNA expression levels per cell suggested higher amplitudes of individual RNAs during tumoral transformation (Suppl. Fig. 7). However, also the expression rate of reference genes (PPIA, PMM1), as well as total RNA amounts per cell were increased during transformation, explaining the modest changes in Pol III transcription if normalized towards these mRNAs or relative to the total amount of RNA per cell. Taken together, these data show that Pol III RNA expression is enhanced during tumorigenesis, but since general gene expression also increases during this process, the relative modification rate of Pol III expression versus the general increase of expression is modest.
Figure 6. Northern blot analyses of the expression of RNA polymerase III-transcribed RNAs. Normalized fold expression relative to IMR90 cells and 5.8S RNA expression is indicated on the Y-axis of the graph.
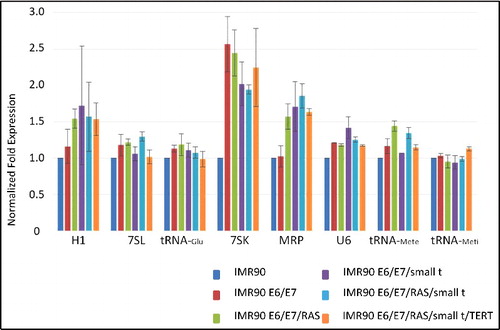
tRNA-Meti, tRNA-Mete and tRNA-Glu levels compared to reference gene expression remain overall unchanged upon tumoral transformation. Collectively, the changes in the expression of Pol III transcripts during cellular transformation are less pronounced than could have been anticipated from published results [Citation10,37,38], but they are sufficient for supporting cellular transformation.
Discussion
Research over the past twenty years led to the conclusion that the regulation of human RNA polymerase III transcription is lost during tumoral transformation. This loss of regulation was in parts attributed to the inactivation of tumor suppressor gene products such as TP53 [Citation14,15], RB1 [Citation16,17], PTEN [Citation18,39], BRCA1 [Citation20] and ARF [Citation19] and in parts to the activation of proto-oncogenes such as c-MYC [Citation21,40] and c-JUN [Citation23]. Often, these studies analyzed the effects of transient suppression or overexpression of tumor suppressor proteins or of oncogenes in cells. Therefore, effects that were observed in these model systems may reflect immediate responses of cells to the inactivation of tumor suppressor proteins or the activation of oncoproteins, which could not be balanced by other regulators within these cells. However, tumorigenesis is a multistep process that develops over long periods of time during which cells try to adapt to the deregulation of individual tumor suppressor protein or oncogene activities. As a consequence, and in order to understand overall alterations in Pol III transcription upon cellular transformation, we aimed at establishing a comprehensive cellular model system that relies on the stable expression or suppression of a combination of oncogenes and tumor suppressor genes. Here, we employed such a system similar to the one that was previously published by Weinberg and colleagues [Citation2,3]. Our data clearly show that the introduction of five genetic elements (HPV-E6; HPV-E7; SV40 small t; RAS-V12G; TERT) alters cell cycle regulation (Suppl. Figs. 2–4) and leads to cellular transformation as analyzed by anchorage-independent growth in soft agar assays and by tumor formation in nude mice ( and Suppl. Fig. 5). Our data indicate that the expression of HRAS-G12V represses that of p16 and small t (). We do not have an experimental explanation for this observation. It may be that RAS-G12V expression negatively impacts on p16 expression by mechanisms that are similar to what was shown in human fibroblasts, which escape RAS-induced senescence by suppressing p16 expression (Kohsaka et al., 2011) [Citation41]. In this publication it was argued that RAS-expressing cells need inactivate p16 (CDKN2A) expression to prevent being arrested in oncogene-induced senescence. It may thus be that we selected cells that were able to inactivate p16 expression as a consequence of RAS-G12V expression.
Surprisingly, the magnitude of deregulation of Pol III-transcribed genes relative to that of reference mRNAs is unexpectedly low during the process of transformation (). However, if taking into account that cell doubling times decrease during transformation (), it can be deduced that Pol III transcription must be strongly stimulated during tumoral transformation in order to support increased cell division rates. This stimulation though takes place in the context of a general enhancement of gene expression explaining why the amplitude of variation of Pol III gene expression is relatively low compared to reference gene expression. Importantly, the alterations in the expression of Pol III transcription components and of Pol III-transcribed RNAs that we describe here, even if being overall modest, must be sufficient for tumoral transformation in this defined cellular model system. As a consequence, it is possible that tumor growth in vivo also only requires modest changes in expression of Pol III-transcribed RNAs.
Transcription of all Pol III-transcribed RNAs that were upregulated during transformation in our model system is driven by type 3 promoters that are located upstream of the transcription initiation site (H1; MRP; U6). Since we observe enhanced SNAPC1 mRNA expression levels during transformation, it is conceivable that this PTF-subunit is limiting for the constitution of the PTF/SNAPc-complex in IMR90 fibroblasts. Thus, its overexpression may increase the abundance of complete PTF/SNAPc complex in tumor cells, leading to the activation of type 3 promoter-dependent Pol III transcription. However, overexpression of SNAPC1 could also have other cellular effects, since this subunit was implicated in PTF/SNAPc-independent transcription elongation by RNA polymerase II and was suggested to represent a general Pol II transcriptional co-activator [Citation42].
Interestingly, we observe changes in mRNA expression during transformation only for a subset of Pol III subunits and transcription factors (POLR3G; POLR3F; BDP1; SNAPC1). In contrast, increased protein levels are found not only for these genes upon transformation, but also for other components of the Pol III transcription apparatus, suggesting that post-translational mechanisms such as protein modification and stabilization may be involved in the accumulation of these factors.
Our data are in accordance with published results indicating that the TFIIIBα-subunit BRF2 contributes to tumoral transformation. An amplification of chromosome 8p11-12 carrying the gene encoding BRF2 has been observed in sporadic and in familial cases of breast cancer [Citation43], in urothelial and other epithelial cancers [Citation44] and in squamous lung carcinoma [Citation45,46]. Lockwood et al., demonstrated that chromosomal amplification is accompanied by overexpression of BRF2 in squamous lung carcinoma [Citation45]. In our study we show that BRF2 protein but not mRNA is overexpressed upon cellular transformation ( and ). However, increased BRF2 expression in our system occurs in the absence of chromosome 8p11-12 alterations that would be detectable by CGH array (Suppl. Fig. 6). These data indicate that enhanced BRF2 expression may be required for cell transformation and that this increased expression is either achieved by chromosomal amplification [Citation45,46] or by yet unknown mechanisms of increased translation and/or protein stabilization in the case of the cellular transformation model employed here.
We analysed the RNA-sequencing data that we included into this manuscript with caution since they have been obtained by a single experiment and primarily serve as control for the RT-qPCR data presented here. In addition to confirming the RT-qPCR data they also suggest that POLR3G is the only basal component of the three DNA-dependent RNA polymerases that exhibits a more than 4-fold change (up to 5.44-fold) in mRNA expression upon tumoral transformation (Suppl tables 2–4). SNAPC1 overexpression detected by RT-qPCR is also confirmed by RNA-seq and increases up to 3.82-fold (Suppl. table 2).
In summary, the process of tumoral transformation in a human fibroblast model system is accompanied by changes in the expression of components of the Pol III transcription apparatus that occur predominantly on the level of protein translation and/or stabilization. These alterations are accompanied by a moderate increase of type 3 promoter-dependent Pol III RNA levels. Importantly, however, these discrete alterations are sufficient to sustain anchorage-independent growth and tumor formation of the transformed cell line in immunocompromized mice. It remains to be determined whether these changes occur concomitantly to transformation or whether they are crucial for tumoral growth, metastasis and invasion. The latter possibility has recently been suggested for tRNA overexpression in a breast cancer model system [Citation24].
Materials and methods
Creation of cell lines and cell culture conditions
IMR90 cells were grown in modified DMEM supplemented with 15% fetal calf serum (Invitrogen; #10270-106) and 100 U/ml Penicillin and 100 µg/ml Streptomycin (Invitrogen,; # 15140122). Plasmids employed for establishing cell lines that stably express pBabe-ras and pBabe-TERT were kindly provided, respectively, by Scott Lowe [Citation47] and Robert Weinberg [Citation2]. pZIPSV40 was obtained from Parmjit Jat [Citation48]. The gene encoding SV40 small t was amplified by PCR from pZIPSV40 and cloned into the pBabe-puro vector. E6 and E7 were amplified by PCR from HPV16 genomic DNA and cloned into the pBabe-neo vector. pBabe constructs were co-transfected with the pCL-10A1 (IMGENEX) vector into 293 cells and the retrovirus-containing supernatant was collected after 48 hours, 0.45 µm-filtered, supplemented with 8µg/ml Sequabrene (Sigma-Aldrich) and incubated with IMR90 cells or the appropriate transformation intermediates. Cells that had incorporated the respective construct were identified by adding the appropriate selection marker for 5 days to 4 weeks (400 µg/ml G418; Sigma-Aldrich; 2µg/ml puromycin; PAA, #P11-019; 100 µg/ml hygromycin; PAA, P02-015).
Soft agar assay
Growth of cells in soft agar was as previously described [Citation2].
Sphere formation assay
Cells were cultured in M11 sphere medium (DMEM/F12 (1:1), N2 and B27 Supplement (1/50), Glutamine 3 mM, Glucose 0.6%, insulin 4mg/ml, Penicilin G 100U/ml, Streptomycin 100ug/ml, hBasic-FGF 10 ng/ml, hEGF 20 ng/ml). 1000 cells were plated in 1mL M11 medium into ultra low attachment plates (Corning; 24-well). Spheres with a diameter of >50µM were counted after 6 days.
Tumor growth in nude mice
All experimental procedures were carried out in the animal facilities of the Université Paris Sud (Kremlin-Bicêtre) in accordance with ethical principles. Both flanks of 6-week-old SCID-Beige female mice (CB17 strain, Charles River laboratories) were subcutaneously injected with 200µl of cell suspensions at a concentration of 4 × 10⁷ cells per ml in DPBS. Tumor growth was monitored three times a week for about 6 weeks by caliper measurements in two dimensions. Tumor volumes were calculated with the formula of a spheroid volume: 4/3π x L/2 x w/2 x h/2 (L = length [L/2 = b], w = width, h = height; with the height being considered to be equal to the width [w/2 and h/2 = a]; [V = 4/3πa2b]).
Western blot assay
SDS-PAGE, transfer to nitrocellulose membranes (Whatman Protran BA85) and incubation with primary as well as secondary antibodies was performed as described [Citation49].
Northern blot
Total RNA was isolated by mirVana™ miRNA Isolation Kit (Ambion) according to the manufacturer's recommendations. 8 µg of total RNA was separated by electrophoresis and blotted onto Hybond-XL nylon membrane (GE Healthcare, RPN2020S). The membrane was incubated in 1x Church buffer (0.25 M NaH2PO4; 1 mM EDTA; 7% SDS; 20 mg/ml salmon sperm DNA; 0.5% BSA) for 2 hrs at 28°C and the denatured radioactive probe was added for incubation overnight. Membrane were washed once in buffer A (2xSSC; 0.1% SDS) and once in buffer B (1xSSC; 1% SDS). Radioactivity (PerkinElmer) on membranes was quantified Typhoon TRIO+ PhosphorImager and ImageQuant software (GE Healthcare). Alternatively, the samples were normalized relative to cell numbers.
The following probes were used for the detection of RNAs:
7SK RNA (5′AAGCTTGACTACCCTACGTTCTC3′),
5.8S RNA (5′GATCAATGTGTCCTGCAATTCAC3′),
tRNA-Meti (5′GGGTATGGGCCCAGCACGCTTCCG3′),
tRNA-Glu (5′CCCGGGCCGCGGCGGTGAAAGCGCC3′),
tRNA-Mete (5′ACTGACGCGCTACCTACTGCGC3′),
H1 (5′AGGGAGAGCCCTGTTAG3′),
7SL (5′AGAACTCCTGGACTCAAGCG3′),
U6 (5′AACGCTTCACGAATTTGCG3′),
MRP (5′CGTAACTAGAGGGAGCTGA3′).
The telomeric repeat amplification protocol (TRAP)
TRAP assay was performed as described [Citation28,50].
RT-qPCR
Total RNA was isolated by employing TRIzol (Invitrogen). Genomic DNA was removed using the turboDNA free kit (Ambion). cDNA was synthesized from 2 μg of total RNA by using Scientific Maxima Reverse Transcriptase (Thermo Scientific) and random primers (Fermentas). Aliquots of cDNA (4 ng) were then subjected to PCR amplification in a 10 μl reaction volume containing 500 nM primers and the SsoAdvanced™ Universal SYBR® Green Supermix (BioRad) using CFX96™ Real-Time PCR Detection System (BioRad). PCR amplification cycles were: 95°C for 30 sec followed by 40 cycles with 95°C, 5 sec and 60°C for 10 sec. Cq values for the gene of interest were normalized against two genes: PMM1 and PPIA. Bestkeepper software was used to determine normalization effectiveness of each reference gene among all samples. The relative expression levels were calculated using the comparative (2-ΔΔCT) method and controls were arbitrarily set at 1. All the results are expressed as mean ± SEM. The primers employed for PCR are listed in Suppl. Table 5.
CGH array
Array-based CGH experiments were done as described [Citation51]. Briefly, the probes were prepared and hybridized as previously described [Citation52]. The data were analyzed by CAPweb; http://bioinfo-out.curie.fr/CAPweb/. Cyanine-5/cyanine-3 ratios >2 were considered as amplifications, and ratios >1.2 and <0.8 were considered as gains and losses, respectively. Analysis of array CGH (computation of genomic alterations) was provided by the VAMP interface (http://bioinfo-out.curie.fr/projects/vamp/).
RNA-Seq
Total RNA was isolated by mirVana™ miRNA Isolation Kit (Ambion) according to the manufacturer's recommendations. RNAs were sequenced for a single replicate for each cell line by the Illumina technology. We estimated general read quality using FastQC (v0.10.1), trimmed low-quality 5′ and 3′ ends (Phred score <20) using Sickle (v1.2), removed remaining adapters and merged overlapping reads (at least 10 bp) using SeqPrep (v1.1) and split merged reads in half with a home-made Awk routine. Finally, paired-ends with one read shorter than 30 bp were discarded. Between 40 and 70 million reads were left for downstream analyses for the various samples. Gene expression levels in the six cell lines were computed following the protocol of Haas et al. [Citation53] using tools from the Trinity 2.2.0 [Citation54] and RSEM 1.3.0 [Citation55] packages. RSEM was employed (by means of the Trinity companion tool “align_and_estimate_abundance.pl”) to estimate gene-level abundances by aligning RNA-Seq reads onto the cDNA sequences of the protein-coding transcripts obtained from the Ensembl release 87 (http://www.ensembl.org) database, which are based on assembly hg38 (GRCh38) of the human genome. Bowtie 2.2.5 [Citation56] was used as read aligner. Abundances were then transformed into TMM (trimmed mean of M-values)-normalized FPKM (fragments per kb per million mapped reads) gene expression values by means of the Trinity companion tool “run_TMM_normalization_write_FPKM_matrix.pl”.
Abbreviations and acronyms
| tRNA | = | Transfer ribonucleic acid |
| TF | = | Transcription factor |
| BRF | = | TFIIB-related factor |
| TBP | = | TATA-binding protein |
| SV | = | Simian virus |
| BDP1 | = | TFIIIB double prime |
| PP2A | = | Protein phosphatase 2A |
| TERT | = | Telomerase reverse transcriptase |
| RB1 | = | Retinoblastoma protein 1 |
| TP53 | = | Tumor protein 53 |
| HPV | = | Human papilloma virus |
| E6 | = | HPV protein E6 |
| E7 | = | HPV protein E7 |
| Pol | = | DNA-dependent RNA polymerase |
| MAP | = | Mitogen-activated protein |
| PBP | = | PSE-binding protein |
| PTF | = | Proximal sequence element-binding transcription factor |
| SNAPC | = | Small Nuclear RNA-activating Protein Complex |
| PTEN | = | Phosphatase and tensin homolog |
| ARF | = | Alternative reading frame |
| BRCA1 | = | Breast cancer type 1 susceptibility protein |
| ERK | = | Extracellular Signal-regulated Kinases |
| JNK1 | = | Jun kinase 1 |
| RT-qPCR | = | Reverse transcription-quantitative polymerase chain reaction |
| CDKN2A | = | Cyclin-dependent kinase inhibitor 2A |
| CCN | = | Cyclin |
| CDK | = | Cell cycle-dependent kinase |
| TRAP | = | Telomere repeat amplification protocol |
| AURKA | = | Aurora kinase A |
| GTF | = | General transcription factor |
Disclosure of potential conflicts of interest
The authors declare no conflict of interest.
suppl.rar
Download (2.4 MB)Acknowledgements
We acknowledge financial support from the National Ligue Contre le Cancer (to M.T.; Equipe labelisée and comité de Gironde), the National Cancer Institute (INCa; to M.T., S.V. and D.J.), the CNRS (to D.J.), the INSERM (to M.T. and S.V.) and the NIH (to R.G.R.).
Additional information
Funding
Related Research Data
References
- Hanahan D, Weinberg RA. Hallmarks of cancer: the next generation. Cell. 2011;144:646–674. doi:10.1016/j.cell.2011.02.013. PMID:21376230
- Hahn WC, Counter CM, Lundberg AS, et al. Creation of human tumour cells with defined genetic elements. Nature. 1999;400:464–468. doi:10.1038/22780. PMID:10440377
- Hahn WC, Dessain SK, Brooks MW, et al. Enumeration of the simian virus 40 early region elements necessary for human cell transformation. Mol Cell Biol. 2002;22:2111–2123. doi:10.1128/MCB.22.7.2111-2123.2002. PMID:11884599
- Steitz TA. A structural understanding of the dynamic ribosome machine. Nat Rev Mol Cell Biol. 2008;9:242–253. doi:10.1038/nrm2352. PMID:18292779
- Roeder RG. Transcriptional regulation and the role of diverse coactivators in animal cells. FEBS Lett. 2005;579:909–915. doi:10.1016/j.febslet.2004.12.007. PMID:15680973
- Matera AG, Terns RM, Terns MP. Non-coding RNAs: lessons from the small nuclear and small nucleolar RNAs. Nat Rev Mol Cell Biol. 2007;8:209–220. doi:10.1038/nrm2124. PMID:17318225
- Guttman M, Amit I, Garber M, et al. Chromatin signature reveals over a thousand highly conserved large non-coding RNAs in mammals. Nature. 2009;458:223–227. doi:10.1038/nature07672. PMID:19182780
- Schanen BC, Li X. Transcriptional regulation of mammalian miRNA genes. Genomics. 2011;97:1–6. doi:10.1016/j.ygeno.2010.10.005. PMID:20977933
- Dieci G, Fiorino G, Castelnuovo M, et al. The expanding RNA polymerase III transcriptome. Trends Genet. 2007;23:614–622. doi:10.1016/j.tig.2007.09.001. PMID:17977614
- Dumay-Odelot H, Durrieu-Gaillard S, Da Silva D, et al. Cell growth- and differentiation-dependent regulation of RNA polymerase III transcription. Cell Cycle. 2010;9:3687–3699. doi:10.4161/cc.9.18.13203. PMID:20890107
- Dumay-Odelot H, Durrieu-Gaillard S, El Ayoubi L, et al. Contributions of in vitro transcription to the understanding of human RNA polymerase III transcription. Transcription. 2014;5:e27526. doi: 10.4161/trns.27526. doi:10.4161/trns.27526. PMID:25764111
- Mauck JC, Green H. Regulation of pre-transfer RNA synthesis during transition from resting to growing state. Cell. 1974; 3:171–177. doi:10.1016/0092-8674(74)90122-6. PMID:4473272
- Schwartz LB, Sklar VE, Jaehning JA, et al. Isolation and partial characterization of the multiple forms of deoxyribonucleic acid-dependent ribonucleic acid polymerase in the mouse myeloma, MOPC 315. J Biol Chem. 1974;249:5889–5897. PMID:4414007
- Chesnokov I, Chu WM, Botchan MR, et al. p53 inhibits RNA polymerase III-directed transcription in a promoter-dependent manner. Mol Cell Biol. 1996;16:7084–7088. doi:10.1128/MCB.16.12.7084. PMID:8943363
- Cairns CA, White RJ. p53 is a general repressor of RNA polymerase III transcription. EMBO J. 1998;17:3112–3123. doi:10.1093/emboj/17.11.3112. PMID:9606193
- White RJ, Trouche D, Martin K, et al. Repression of RNA polymerase III transcription by the retinoblastoma protein. Nature. 1996;382:88–90. doi:10.1038/382088a0. PMID:8657311
- Chu WM, Wang Z, Roeder RG, et al. RNA polymerase III transcription repressed by Rb through its interactions with TFIIIB and TFIIIC2. J Biol Chem. 1997;272:14755–14761. doi:10.1074/jbc.272.23.14755. PMID:9169441
- Woiwode A, Johnson SAS, Zhong S, et al. PTEN represses RNA polymerase III-dependent transcription by targeting the TFIIIB complex. Mol Cell Biol. 2008;28:4204–4214. doi:10.1128/MCB.01912-07. PMID:18391023
- Morton JP, Kantidakis T, White RJ. RNA polymerase III transcription is repressed in response to the tumour suppressor ARF. Nucleic Acids Res. 2007;35:3046–3052. doi:10.1093/nar/gkm208. PMID:17439968
- Veras I, Rosen EM, Schramm L. Inhibition of RNA polymerase III transcription by BRCA1. J Mol Biol. 2009;387:523–531. doi:10.1016/j.jmb.2009.02.008. PMID:19361418
- Gomez-Roman N, Felton-Edkins ZA, Kenneth NS, et al. Activation by c-Myc of transcription by RNA polymerases I, II and III. Biochem Soc Symp. 2006;73:141–154. doi:10.1042/bss0730141.
- Felton-Edkins ZA, Fairley JA, Graham EL, et al. The mitogen-activated protein (MAP) kinase ERK induces tRNA synthesis by phosphorylating TFIIIB. EMBO J. 2003;22:2422–2432. doi:10.1093/emboj/cdg240. PMID:12743036
- Zhong S, Machida K, Tsukamoto H, et al. Alcohol induces RNA polymerase III-dependent transcription through c-Jun by co-regulating TATA-binding protein (TBP) and Brf1 expression. J Biol Chem. 2011;286:2393–2401. doi:10.1074/jbc.M110.192955. PMID:21106530
- Goodarzi H, Nguyen HC, Zhang S, et al. Modulated expression of specific tRNAs drives gene expression and cancer progression. Cell. 2016;165:1416–1427. doi:10.1016/j.cell.2016.05.046. PMID:27259150
- Levine AJ. The common mechanisms of transformation by the small DNA tumor viruses: the inactivation of tumor suppressor gene products: p53. Virology. 2009;384:285–293. doi:10.1016/j.virol.2008.09.034. PMID:19081592
- Scheffner M, Huibregtse JM, Vierstra RD, et al. The HPV-16 E6 and E6-AP complex functions as a ubiquitin-protein ligase in the ubiquitination of p53. Cell. 1993;75:495–505. doi:10.1016/0092-8674(93)90384-3. PMID:8221889
- Khleif SN, DeGregori J, Yee CL, et al. Inhibition of cyclin D-CDK4/CDK6 activity is associated with an E2F-mediated induction of cyclin kinase inhibitor activity. Proc Natl Acad Sci USA. 1996;93:4350–4354. doi:10.1073/pnas.93.9.4350. PMID:8633069
- Kim NW, Piatyszek MA, Prowse KR, et al. Specific association of human telomerase activity with immortal cells and cancer. Science. 1994;266:2011–2015. doi:10.1126/science.7605428. PMID:7605428
- Malumbres M, Barbacid M. Cell cycle, CDKs and cancer: a changing paradigm. Nat Rev Cancer. 2009;9:153–166. doi:10.1038/nrc2602. PMID:19238148
- Pastrana E, Silva-Vargas V, Doetsch F. Eyes wide open: a critical review of sphere-formation as an assay for stem cells. Cell Stem Cell. 2011;8:486–498. doi:10.1016/j.stem.2011.04.007. PMID:21549325
- Su Y-J, Lai H-M, Chang Y-W, et al. Direct reprogramming of stem cell properties in colon cancer cells by CD44. EMBO J. 2011;30:3186–3199. doi:10.1038/emboj.2011.211. PMID:21701559
- Teichmann M, Seifart KH. Physical separation of two different forms of human TFIIIB active in the transcription of the U6 or the VAI gene in vitro. EMBO J. 1995;14:5974–5983. PMID:8846790
- Wang Z, Roeder RG. Structure and function of a human transcription factor TFIIIB subunit that is evolutionarily conserved and contains both TFIIB- and high-mobility-group protein 2-related domains. Proc Natl Acad Sci USA. 1995;92:7026–7030. doi:10.1073/pnas.92.15.7026. PMID:7624363
- Teichmann M, Wang Z, Roeder RG. A stable complex of a novel transcription factor IIB- related factor, human TFIIIB50, and associated proteins mediate selective transcription by RNA polymerase III of genes with upstream promoter elements. Proc Natl Acad Sci USA. 2000;97:14200–14205. doi:10.1073/pnas.97.26.14200. PMID:11121026
- Schramm L, Pendergrast PS, Sun Y, et al. Different human TFIIIB activities direct RNA polymerase III transcription from TATA-containing and TATA-less promoters. Genes Dev. 2000;14:2650–2663. doi:10.1101/gad.836400. PMID:11040218
- Kelter AR, Herchenbach J, Wirth B. The transcription factor-like nuclear regulator (TFNR) contains a novel 55-amino-acid motif repeated nine times and maps closely to SMN1. Genomics. 2000;70:315–326. doi:10.1006/geno.2000.6396. PMID:11161782
- White RJ. RNA polymerases I and III, non-coding RNAs and cancer. Trends Genet. 2008;24:622–629. doi:10.1016/j.tig.2008.10.003. PMID:18980784
- Marshall L, White RJ. Non-coding RNA production by RNA polymerase III is implicated in cancer. Nat Rev Cancer. 2008;8:911–914. doi:10.1038/nrc2539. PMID:18987635
- Cabarcas S, Watabe K, Schramm L. Inhibition of U6 snRNA Transcription by PTEN. Online J Biol Sci. 2010;10:114–125. doi:10.3844/ojbsci.2010.114.125. PMID:21479160
- Johnson SAS, Dubeau L, Johnson DL. Enhanced RNA polymerase III-dependent transcription is required for oncogenic transformation. J Biol Chem. 2008;283:19184–19191. doi:10.1074/jbc.M802872200. PMID:18456653
- Kohsaka S, Sasai K, Takahashi K, et al. A population of BJ fibroblasts escaped from Ras-induced senescence susceptible to transformation. Biochem Biophys Res Commun. 2011;410:878–84. doi:10.1016/j.bbrc.2011.06.082. PMID:21703241
- Baillat D, Gardini A, Cesaroni M, et al. Requirement for SNAPC1 in transcriptional responsiveness to diverse extracellular signals. Mol Cell Biol. 2012;32:4642–4650. doi:10.1128/MCB.00906-12. PMID:22966203
- Melchor L, Garcia MJ, Honrado E, et al. Genomic analysis of the 8p11-12 amplicon in familial breast cancer. Int J Cancer. 2007;120:714–717. doi:10.1002/ijc.22354. PMID:17096335
- Williams SV, Platt FM, Hurst CD, et al. High-resolution analysis of genomic alteration on chromosome arm 8p in urothelial carcinoma. Genes Chromosome Cancer. 2010;49:642–659. PMID:20461757
- Lockwood WW, Chari R, Coe BP, et al. Integrative genomic analyses identify BRF2 as a novel lineage-specific oncogene in lung squamous cell carcinoma. PLoS Med. 2010;7:e1000315. doi:10.1371/journal.pmed.1000315. PMID:20668658
- Cabarcas S, Schramm L. RNA polymerase III transcription in cancer: the BRF2 connection. Mol Cancer. 2011;10:47. doi:10.1186/1476-4598-10-47. PMID:21518452
- Serrano M, Lin AW, McCurrach ME, et al. Oncogenic ras provokes premature cell senescence associated with accumulation of p53 and p16INK4a. Cell. 1997;88:593–602. doi:10.1016/S0092-8674(00)81902-9. PMID:9054499
- Jat PS, Cepko CL, Mulligan RC, et al. Recombinant retroviruses encoding simian virus 40 large T antigen and polyomavirus large and middle T antigens. Mol Cell Biol. 1986;6:1204–1217. doi:10.1128/MCB.6.4.1204. PMID:3023876
- Teichmann M, Dieci G, Huet J, et al. Functional interchangeability of TFIIIB components from yeast and human cells in vitro. EMBO J. 1997;16:4708–4716. doi:10.1093/emboj/16.15.4708. PMID:9303315
- Wright WE, Shay JW, Piatyszek MA. Modifications of a telomeric repeat amplification protocol (TRAP) result in increased reliability, linearity and sensitivity. Nucleic Acids Res. 1995;23:3794–3795. doi:10.1093/nar/23.18.3794. PMID:7479015
- Italiano A, Lagarde P, Brulard C, et al. Genetic profiling identifies two classes of soft-tissue leiomyosarcomas with distinct clinical characteristics. Clin Cancer Res. 2013;19:1190–1196. doi:10.1158/1078-0432.CCR-12-2970. PMID:23329812
- La Rosa P, Viara E, Hupé P, et al. VAMP: visualization and analysis of array-CGH, transcriptome and other molecular profiles. Bioinformatics. 2006;22:2066–2073. doi:10.1093/bioinformatics/btl359. PMID:16820431
- Haas BJ, Papanicolaou A, Yassour M, et al. De novo transcript sequence reconstruction from RNA-seq using the Trinity platform for reference generation and analysis. Nat Protoc. 2013;8(8):1494–1512. doi: 10.1038/nprot.2013.084. Epub 2013 Jul 11. doi:10.1038/nprot.2013.084. PMID:23845962
- Grabherr MG, Haas BJ, Yassour M, et al. Full-length transcriptome assembly from RNA-Seq data without a reference genome. Nat Biotechnol. 2011;29(7):644–652. doi: 10.1038/nbt.1883. doi:10.1038/nbt.1883. PMID:21572440
- Li B, Dewey CN. RSEM: accurate transcript quantification from RNA-Seq data with or without a reference genome. BMC Bioinform. 2011;12:323. doi: 10.1186/1471-2105-12-323. doi:10.1186/1471-2105-12-323. PMID:21816040
- Langmead B, Trapnell C, Pop M, et al. Ultrafast and memory-efficient alignment of short DNA sequences to the human genome. Genome Biol. 2009;10(3):R25. doi: 10.1186/gb-2009-10-3-r25. Epub 2009 Mar 4. doi:10.1186/gb-2009-10-3-r25. PMID:19261174