
ABSTRACT
It is believed that the alteration of tissue microenvironment would affect cancer initiation and progression. However, little is known in terms of the underlying molecular mechanisms that would affect the initiation and progression of breast cancer. In the present study, we use two murine mammary tumor models with different speeds of tumor initiation and progression for whole genome expression profiling to reveal the involved genes and signaling pathways. The pathways regulating PI3K-Akt signaling and Ras signaling were activated in Fvb mice and promoted tumor progression. Contrastingly, the pathways regulating apoptosis and cellular senescence were activated in Fvb.B6 mice and suppressed tumor progression. We identified distinct patterns of oncogenic pathways activation at different stages of breast cancer, and uncovered five oncogenic pathways that were activated in both human and mouse breast cancers. The genes and pathways discovered in our study would be useful information for other researchers and drug development.
| Abbreviations | ||
| B6 | = | C57BL/6J |
| FVB | = | FVB/NJ |
| DEGs | = | differentially expressed genes |
| KEGG | = | Kyoto Encyclopedia of Genes and Genomes |
| GO | = | gene ontology |
| MF | = | molecular function |
| H&E | = | haematoxylin and eosin stain |
| ECM | = | extracellular matrix |
| TCGA | = | The Cancer Genome Atlas |
| FPKM | = | Reads Per Kilobase of exon model per Million mapped reads |
| PCA | = | principal component analysis |
| PI3K | = | phosphoinositide 3-kinase |
| PH | = | pleckstrin homology |
| IGF-1R | = | insulin-like growth factor-1 receptor |
Introduction
Breast cancer is the most prevalent cancer among women globally [Citation1]. In 2012, the cancer mortality rate was ranked 5th among cancers due to significant advances in the clinical treatment and basic research of breast cancer, but the number of deaths was still very large (522,000 deaths) [Citation1]. In China, there were 278,800 new cases in 2013 and 64,600 attributable deaths during the same year [Citation2,Citation3]. Therefore, it is important to investigate the molecular mechanisms involved in the progression of breast cancer and to identify novel prognostic biomarkers of breast cancer. Accordingly, these investigations will contribute to a better prognosis and provide potential therapeutic targets for breast cancer.
Overactivation of PI3K-Akt pathway has been reported in many types of cancers including breast cancer [Citation4,Citation5], bladder cancer [Citation6], and ovarian cancer [Citation7]. PI3K-Akt pathway is a signaling cascade which operates downstream to the receptor tyrosine kinases such as insulin-like growth factor-1 receptor (IGF-1R) [Citation8], the relay of signals from the aforementioned insulin-like growth factor-1 receptor leads to the activation of Phosphoinositide 3-kinase (PI3K) which catalyses the generation of phosphatidylinositol-3,4,5-triphosphate from phosphatidylinositol-4,5-biphosphate [Citation9]. In turn, PIP3 interacts with pleckstrin homology (PH) domains of phosphoinositide-dependent kinase (PDK) and Akt and activates them [Citation10]. After phosphorylation by PDK, Akt was activated as phospho-Akt (p-Akt) to stimulate downstream targets which are involved in regulation of apoptosis, cell cycle, transcription and translation [Citation11,Citation12]. Therefore, the PI3K/Akt/mTOR pathway plays a central role in regulation of the cell proliferation, survival, migration and extensively contributes to oncogenesis [Citation13,Citation14]. So the potential for cancer treatment with agents inhibiting this pathway is attractive and useful [Citation10,Citation15,Citation16].
Extracellular matrix (ECM) is the non-cellular component present within all tissues and organs, and contains fibrous proteins and polysaccharides such as collagen, laminin and fibronectin [Citation17], Cell-ECM adhesion is mediated by the ECM receptors, including integrins [Citation18], CD44 [Citation19], and proteoglycans [Citation20]. ECM- receptor interaction regulates many pathways in cancer cells, including PI3K-Akt [Citation11], Wnt [Citation21], Src-FAK [Citation22], and Rho-GTPases [Citation23], and activation of these pathways promote breast cancer development and progression [Citation24]. ECM- receptor interaction also involves in therapy resistance, Hyaluronan is a component of the ECM that promotes resistance to a variety of chemotherapeutic drugs, by activation of PI3K signaling that supports survival via AKT [Citation25]. A number of ECM molecules also participate in the preparation of the pre-metastatic niche [Citation26,Citation27], LOX accumulates in the pre-metastatic niche and promotes recruitment of MMP-2 producing myeloid cells [Citation28], and fibronectin is upregulated at the distant site as well as the remodeling enzymes MMP-2 and MMP-9 [Citation26].
By sharing both morphological and molecular biomarkers with the human breast cancer [Citation29] and resembling the human luminal B subtype of breast cancer based on transcriptome profiling [Citation30], MMTV-PyMT mouse model has been widely used to study breast cancer [Citation31,Citation32]. By activating multiple signaling pathways, including Shc [Citation33], PI3-kinase [Citation34] and phospholipase Cγ1 (PLγ1), the membrane scaffold protein PyMT activates the MAPK, PI3K and DAG/PKC [Citation35] pathways and promotes breast cancer progression. Previous studies have shown that the host genetic background has a significant impact on the biological behavior of subsequent tumors induced by PyMT and that tumor latency, the tumor growth rate and the metastatic index varies among different F1 strain combinations, which were generated by breeding MMTV-PyMT mice with 27 different inbred strains [Citation36]. Global expression profiling of four F1 strain combinations identified a gene signature of tumor virulence in MMTV-PyMT mice [Citation37]; the gene signature had been confirmed in human breast cancer [Citation38]. Compared with MMTV-PyMT mice in the FVB/NJ background (simplified as Fvb in this article), tumor initiation is significantly delayed in the C57BL/6J (simplified as B6 in this article) background [Citation39], and the molecular mechanisms involved remain unknown. We have hypothesized that a mechanism inside the human body can postpone cancer onset [Citation40] and that B6 mice have strain-specific genes and pathways that delay tumor initiation and suppress tumor progression.
We determined the gene expression profiles of the MMTV-PyMT mammary tumors that developed in the Fvb strain and in the F1 strain combination Fvb.B6 at the adenoma stage and late carcinoma stage and compared these profiles to those of homologous normal tissues. Although the overall expression profiles of the PyMT tumors emerging in the Fvb and Fvb.B6 mice were similar, 148 to 417 strain- and stage-specific dysregulated genes were identified. Kyoto Encyclopedia of Genes and Genomes (KEGG) pathway analysis showed that PI3K-Akt and Ras signaling were specifically enriched in the Fvb background at the adenoma stage via up-regulated genes. Contrastingly, the pathways regulating apoptosis and cellular senescence were activated in Fvb.B6 mice. Cdkn1a (a cell cycle-related gene) was specifically down-regulated in the Fvb.B6 mice but up-regulated in the Fvb mice, and the survival analysis showed that high expression of Cdkn1a in human breast cancer was associated with poor prognosis by using The Cancer Genome Atlas (TCGA) database. These results suggest that Fvb.B6 mice exhibit modulated expression of genes involved in PI3K-Akt and Ras signaling to suppress mammary tumor initiation and progression.
Results
Proper tissue clustering
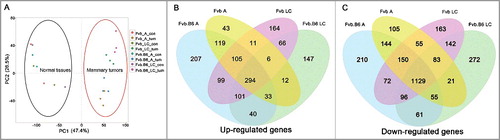
Principal component analysis (PCA) depicts the expression values as points on a two-dimensional scale (). Each dot in the figure represents the normalized expression data of one unique sample. A total of 20 dots are visible in , corresponding to the 20 samples used in this study. Based on this analysis, tumor samples were clearly clustered and separated from the homologous normal tissues, indicating proper tissue processing with high quality sequencing results.
Figure 1. Differentially expressed genes along tumor progression. (A) Principle component analysis (PCA) of the mRNA expression data in the tumor and homologous normal tissue samples. A total of 20 samples were analyzed, and the separation between the tumor and control samples was shown. (B-C) Venn diagram showing the numbers of the up-regulated (B) and down-regulated (C) genes with significant changes (p < 0.05) in expression at the adenoma and late carcinoma stages in the two types of mice. A, adenoma; LC, late carcinoma.
Differentially expressed genes and strain-specific dysregulated pathways
DEGs were screened and generated by comparing the tumor samples with homologous normal tissues. The analysis identified 2,364 and 2,736 DEGs in the Fvb mice at the adenoma stage and late carcinoma stage, respectively, and the numbers of DEGs in the Fvb.B6 mice were 2,916 and 2558, respectively (fold change > 2, FDR < 0.05, Table S1). We also found that the number of down-regulated DEGs was higher than the numbers of up-regulated DEGs at each stage in the Fvb and Fvb.B6 mice (Table S1), which was consistent with a previous study [Citation41]. The numbers of up- and down-regulated DEGs at the adenoma stage were higher in the Fvb.B6 mice than in the Fvb mice, but the opposite result was apparent at the late carcinoma stage. Among the down-regulated DEGs, a significant proportion of DEGs (1129 genes) appeared at all tumor stages in both the Fvb and Fvb.B6 mice (), and the up-regulated DEGs showed the same trend ().
We then performed KEGG pathway analysis of the DEGs identified at the adenoma and late carcinoma stages in the two genotypes of mice. At the adenoma stage, the pathways regulating PI3K-Akt signaling (KEGG:04151) and Ras signaling (KEGG: 04014) were activated in the Fvb tumor but not in the Fvb.B6 tumor ( and ). Activation of the PI3K-Akt signaling pathway plays a pivotal role in fundamental cellular functions, such as cell proliferation and survival, via phosphorylation of a variety of substrates [Citation42], and activated Ras regulates a variety of endpoints relevant to breast cancer progression, including anchorage-dependent growth, anchorage-independent growth, steroid sensitivity and cell invasion [Citation43]. Conversely, the pathways regulating cellular senescence (KEGG: 04218) and apoptosis (KEGG: 04210) were only activated in the Fvb.B6 tumors ( and ), and an activated apoptosis pathway leads to programmed cell death [Citation44]. At the late carcinoma stage of Fvb mice, the pathways regulating the cell cycle (KEGG: 04110) were enriched in the up-regulated DEGs, suggesting a high proliferative rate for the tumors at this stage (). We determined and analyzed the significantly enriched pathways (p < 0.05) and found that five pathways were enriched in the up-regulated DEGs at the adenoma and late carcinoma stages in the Fvb.B6 mice and that another five pathways were enriched in the Fvb mice ( and ). One and three pathways were enriched in the down-regulated DEGs at the adenoma and late carcinoma stages in the Fvb.B6 and Fvb mice, respectively ().
Figure 2. Pathway enrichment analysis. (A-B) KEGG enrichment of the up-regulated (A) and down-regulated (B) DEGs at the adenoma and late carcinoma stages in the two types of mice. The pathways with the most significant p-values were plotted. (C-D) Venn diagram showing the number of significant KEGG pathways (p-value < 0.05) by using the up-regulated (C) and down-regulated (D) DEGs at the adenoma and late carcinoma stages in the two types of mice. Expression levels are depicted according to the color bar beside the heat map. A, adenoma; LC, late carcinoma.
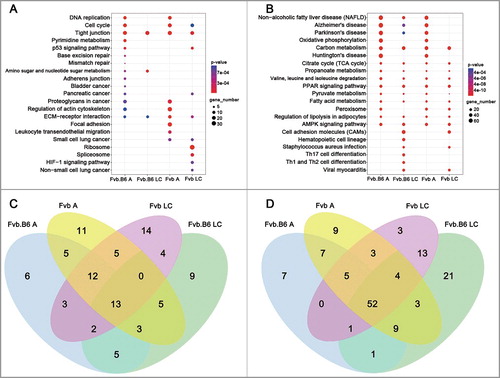
Table 1. The genes involved in ECM-receptor interaction and their functions in cancer progression.
Strain-specific up-regulated DEGs and their molecular functions
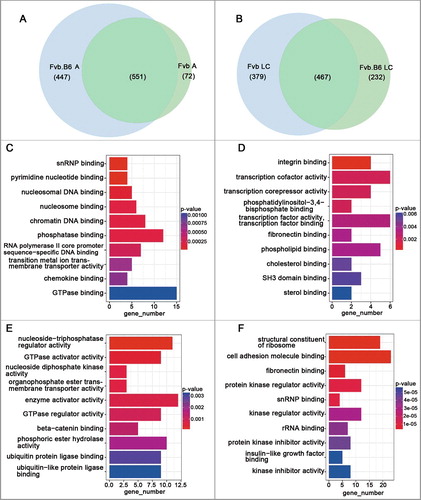
We examined strain specific up-regulated genes at the adenoma and late carcinoma stages and found that 447 and 232 up-regulated genes were specifically expressed in the Fvb.B6 mice at the adenoma and late carcinoma stages, respectively (), and that 72 and 379 up-regulated genes were specifically expressed in the Fvb mice at the adenoma and late carcinoma stages, respectively (). We then performed Gene Ontology Molecular Function (GOMF) analysis of the strain-specific up-regulated genes. Ubiquitin protein ligase binding (GO:0031625) and ubiquitin-like protein ligase binding (GO:0044389) were enriched in the Fvb.B6 mice at the late carcinoma stage (), and were involved in ubiquitin-mediated proteolysis and played important roles in cell cycle control [Citation45]. Integrin binding (GO:0005178) and fibronectin binding (GO:0001968) were enriched in the Fvb mice at the adenoma and late carcinoma stages (). Interesting, integrin is a transmembrane receptor that facilitate ECM adhesion [Citation46], and fibronectin is a high-molecular-weight (∼440 kDa) glycoprotein of the ECM that binds to a membrane spanning receptor protein known as an integrin [Citation47]. Therefore, integrin binding (GO:0005178) and fibronectin binding (GO:0001968) were all involved in the ECM-receptor interaction (KEGG:04512).
Figure 3. Strain-specific up-regulated DEGs and pathways at the adenoma and late carcinoma stages. (A-B) Venn diagram showing the numbers of strain-specific up-regulated genes with significant changes (p < 0.05) in expression at the adenoma (A) and late carcinoma (B) stages in the two types of mice. (C-D) Molecular Function Gene Ontology (MF-GO terms) analysis of the strain-specific up-regulated genes at the adenoma stage in the Fvb.B6 mice (C) and Fvb mice (D). (E-F) Molecular Function Gene Ontology (MF-GO terms) analysis of the strain-specific up-regulated genes at the late carcinoma stage in the Fvb.B6 mice (E) and Fvb mice (F). The color gradient from red to blue corresponds to an increase in the p-value.
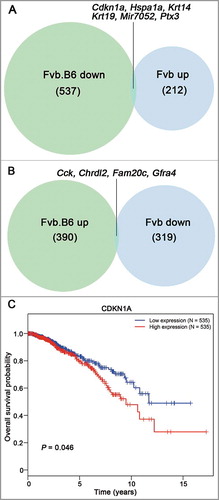
We examined all strain-specific DEGs at the adenoma and late carcinoma stages and found that 390 up-regulated genes and 537 down-regulated genes in total were specifically expressed in Fvb.B6 mice and that the number was 212 and 319 in the Fvb mice (). Interesting, six genes (Cdkn1a, Hspa1a, Krt14, Krt19, Mir7052, Ptx3) were down-regulated in the Fvb.B6 mice but up-regulated in the Fvb mice, and four genes (Cck, Chrdl2, Fam20c, Gfra4) were up-regulated in the Fvb.B6 mice but down-regulated in the Fvb mice (). To verify our RNA-sequencing results, we performed qPCR on six independent tumor samples from the Fvb.B6 and Fvb mice. The expression patterns of six genes (Cdkn1a, Hspa1a, Cck, Chrdl2, Fam20c, Gfra4) were confirmed in the two genotypes of mice (p-value < 0.05, Fig. S2C). A previous study had showed that high expression of CDKN1A was closely correlated with poor prognosis in breast cancer [Citation48] and the result confirmed in human breast cancer by using TCGA database ().
Figure 4. Venn diagram showing the inversely expressed genes between the Fvb.B6 mice and Fvb mice. (A-B) Venn diagram showing the numbers of the DEGs at both the adenoma and late carcinoma stages in the two types of mice. Six genes were down-regulated in the Fvb.B6 mice but up-regulated in the Fvb mice (A), and four genes were up-regulated in the Fvb.B6 mice but down-regulated in the Fvb mice (B). (C) Correlation of CDKN1A expression with overall survival for BRCA patients. The data were retrieved from The Cancer Genome Atlas (TCGA) database. The survival curves were plotted using the Kaplan–Meier method and compared using the log–rank test.
Commonly dysregulated pathways in the two genotypes of mice
We collected and analyzed the significantly enriched pathways (p < 0.05) and found that 13 pathways were enriched in the up-regulated DEGs at the adenoma and late carcinoma stages in the two genotypes of mice, and one of these pathways was the pathway regulating ECM receptor interaction (KEGG:04512). DNA replication (KEGG: 03030) and the cell cycle (KEGG: 04110) were enriched in the up-regulated DEGs at the adenoma stage in the two genotypes of mice (), suggesting a high proliferative rate for the tumors at this stage. We also found that 52 pathways were enriched in the down-regulated DEGs at the adenoma and late carcinoma stages in the two genotypes of mice (), including the TCA cycle (KEGG:00020); PPAR (peroxisome proliferator-activated receptor) signaling (KEGG:03320); AMPK (AMP-activated protein kinase) signaling (KEGG:04152); carbon metabolism (KEGG:01200); propanoate metabolism (KEGG:00640); valine, leucine and isoleucine degradation (KEGG:00280); pyruvate metabolism (KEGG:00620); and fatty acid metabolism (KEGG:01212). Notably, metabolic dysregulation is widely recognized in cancer [Citation49].
As described above, the ECM-receptor interaction regulates many pathways in cancer cells and plays important roles in breast cancer progression. We examined all genes involved in the pathway and found a total of 16 up-regulated and 22 down-regulated genes. Of the 38 genes, the functions and roles of 14 genes in breast cancer progression have been studied, according to the PubMed database search (https://www.ncbi.nlm.nih.gov/pubmed/). We found that the up-regulated genes had tumor-promoting effects and that the down-regulated genes had tumor-suppressive effects on breast cancer, however, the functions of the other 14 genes had been investigated in other cancers, and the remaining 10 genes (Col9a2, Col9a3, Agrn, Lamb2, Col4a1, Col6a1, Col6a2, Col6a3, Lamb1, Lamc3) had no reported roles in any cancer ().
Validated pathways and genes in human patient cohorts
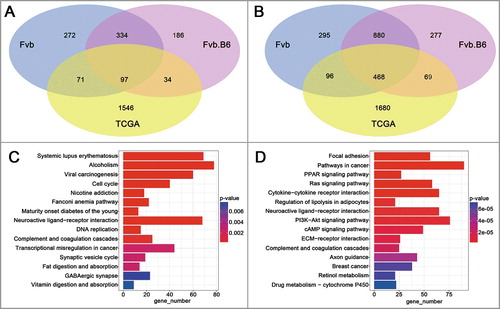
To validate the pathways and genes identified from the Fvb and Fvb.B6 mice, we used publicly available RNA-sequencing data of human breast invasive carcinoma (BRCA) from TCGA database (http://cancergenome.nih.gov/). We downloaded data for 397 luminal B subtype BRCA and 44 adjacent tissues (classified by the PAM50 model [Citation50]), which most closely resembled the MMTV-PyMT mouse model [Citation30]. The Level3 TCGA BRCA-aligned RNA-seq data were processed the same way as our sequencing data, 1748 up-regulated DEGs and 2313 down-regulated DEGs were identified (fold change > 2, FDR < 0.05). The expression patterns of 97 up-regulated and 468 down-regulated DEGs were validated in both humans and mice (), and the human homolog gene list was downloaded from MGI (Mouse Genome Informatics, http://www.informatics.jax.org/). KEGG pathway analysis of the DEGs from the TCGA samples showed that the pathways regulating the cell cycle and DNA replication were enriched in the up-regulated DEGs () and that the two pathways were also enriched in the up-regulated DEGs at the adenoma stage in the two genotypes of mice (). The pathways regulating focal adhesions (KEGG: 04510), the ECM-receptor interaction (KEGG: 04512), and cell adhesion molecules (KEGG: 04514) were enriched in the down-regulated DEGs in both humans ( and Table S2) and mice ().
Figure 5. Analysis of TCGA data. (A-B) Venn diagram showing the numbers of the up-regulated (A) and down-regulated (B) genes with significant changes (p < 0.05) in expression in the TCGA human breast carcinoma samples and late carcinoma stage of the mice. (C-D) KEGG enrichment of the up-regulated (C) and down-regulated (D) DEGs in TCGA human breast carcinoma samples. The pathways with the most significant p-values were plotted, and the expression levels are depicted according to the color bar beside the heat map.
Discussion
By 5 weeks of age, all female mice in the Fvb background had developed palpable mammary tumors [Citation31], and the Fvb.B6 mice had a median tumor latency of 64.5 days [Citation37]. The Fvb mice also had increased tumor growth and metastasis rates compared with the Fvb.B6 mice [Citation37]. To better decipher the molecular mechanisms involved in the influence of the genetic background on tumor behavior, we analyzed the global gene expression patterns of mammary tumors at the adenoma and late carcinoma stages in two genotypes of mice.
KEGG pathway analysis showed that the PI3K-Akt signaling pathway (KEGG:04151) was the pathway that was specifically enriched in the up-regulated DEGs in the Fvb mice. Previous studies have shown that the middle T antigen oncogene interacts with phosphatidylinositol 3-kinase (PI3K) and activates the PI3K-Akt signaling pathway by phosphorylated tyrosine residue Y315 [Citation51,Citation52]. PI3K-Akt signaling plays an important role in the regulation of apoptosis, the cell cycle, transcription and translation [Citation11], and activation of this pathway promotes breast cancer progression [Citation53,Citation54]. Ras proteins are well-known small GTPases that mediate MAPK cascades and regulate cell proliferation, survival, growth, and migration [Citation55]. The Ras signaling pathway was also specifically enriched in the up-regulated DEGs at the adenoma stage in the Fvb mice.
Apoptosis is typically considered an anti-oncogenic process since caspase activation can promote the elimination of genetically unstable or damaged cells [Citation56]. We observed that the promotion of apoptosis existed in the Fvb.B6 mice as apoptosis-related pathways were enriched in strain-specific up-regulated genes (). Therefore, the suppression of breast cancer progression in the Fvb.B6 mice was partly due to the activation of the apoptotic process.
Table 2. Strain specific pathways enriched by up-regulated DEGs at the adenoma and late carcinoma stage in the two types of mice.
The pathways regulating the cell cycle and DNA replication were activated in both the human and mouse breast cancers, suggesting their fundamental roles in breast cancer progression. Actually, inhibiting the expression of DNA replication-initiating genes induces apoptosis in human cancer cells [Citation57], and uncontrolled cell proliferation is a hallmark of cancer [Citation58]. The pathways regulating focal adhesion, ECM-receptor interactions and cell adhesion molecules were enriched in the down-regulated DEGs in both the human and mouse breast cancers. Interesting, all three pathways were involved in the interaction between the cancer cells and extracellular matrix. It is well known that the interaction between tumor cells and their microenvironment is important for establishing metastatic colonies and for defining the balance between dormancy and malignant growth [Citation59,Citation60]. We collected and analyzed the genes involved in the ECM-receptor interaction pathway in two genotypes of mice and found that a small subset of up-regulated genes and down-regulated genes had tumor-promoting and tumor-suppressing effects, respectively, in breast cancer, and that more than half of the DEGs had no reported roles in breast cancer progression.
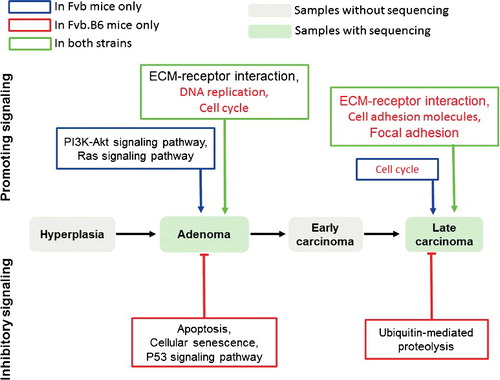
In conclusion, we have identified five oncogenic pathways that regulate breast cancer progression in both humans and mice and found strain-specific pro-oncogenic and anti-oncogenic pathways that affect the progression of breast cancer. Breast cancer progression in the Fvb mice was promoted by the activation of the PI3K-Akt signaling pathway and Ras signaling pathway, and breast cancer progression was suppressed in the Fvb.B6 mice by the activation of the apoptotic process (). The upstream molecular mechanisms involved in the pro-oncogenic PI3K-Akt and Ras signaling pathways, which are activated in the Fvb mice but not the Fvb.B6 mice, and the anti-oncogenic apoptosis-related pathways, which are activated in the Fvb.B6 mice but not the Fvb mice, remain relatively unknown and warrant further study. Our results have great clinical implications. For example, the PI3K-Akt signaling pathway is activated in many types of human cancers [Citation4–6], and PI3K-Akt inhibitors have many side effects [Citation61,Citation62]. Therefore, inactivation of the PI3K-Akt pathway by targeting upstream molecules is a novel and promising approach.
Figure 6. Schematic of the findings in this study. The PI3K-Akt signaling pathway and Ras signaling pathway were activated in the Fvb mice and promoted breast cancer progression. The pathways regulating cellular senescence and apoptosis were enriched in the up-regulated DEGs in the Fvb.B6 mice and suppressed breast cancer progression. The oncogenic pathways validated by analyzing available human breast invasive carcinoma samples in TCGA database are indicated in red.
Materials and methods
Mice and animal care
FVB/N-Tg(MMTV-PyMT)634Mul/J mice were purchased from Jackson Laboratory (Stock No:002374, https://www.jax.org/strain/002374) and B6 mice were purchased from Guangdong Medical Laboratory Animal Center. Mice were housed under specific pathogen-free conditions in Animal Center of Guangdong Pharmaceutical University. All animal experiments were performed in accordance with institutional guidelines and were approved by the Sun Yat-sen University Cancer Center Institutional Animal Care and Usage Committee, with the ethical approval number: L102012017000G.
Fvb.B6 F1 strain combinations were generated by crossing FVB/N-Tg(MMTV-PyMT)634Mul/J mice to B6 mice. FVB/N-Tg(MMTV-PyMT)634Mul/J male animals were bred to B6 female animals to produce transgene-positive Fvb.B6 F1 hybrid female progeny. These virgin F1 strain combinations and FVB/N-Tg(MMTV-PyMT)634Mul/J mice were euthanized for tissue harvesting. Mammary tumors were harvested when the diameter of largest tumor per mouse reached approximately 2 millimeters and 10 millimeters, which correspond to the Adenoma/MIN and late carcinoma stage (Fig. S1A-B).
RNA-seq and analysis
Six tumor samples and four homologous normal tissues from the FVB/N-Tg(MMTV-PyMT)634Mul/J and Fvb.B6 F1 strain combinations were stored at RNAstore Reagent (Cat.# DP408, TIANGEN) for RNA isolation, respectively. Total RNA was isolated from the 20 samples, which three tumor samples in each group, and RNA quality was assessed using an Agilent 2100 Bioanalyzer (Agilent Technologies). The RNA was sheared and reverse transcribed using random primers to obtain cDNA which was used for library construction. The library was subsequently sequenced through BGISEQ-500 platform at Beijing Genomic Institution (www.genomics.org.cn, BGI).
All statistical analyses were carried out with R v3.3.1, after removing transcriptionally inactive genes (read count per million < 1) from raw RNA sequencing gene counts, we got high confident gene counts. For gene expression analysis, the matched reads were calculated and then normalized to Reads Per Kilobase of exon model per Million mapped reads (FPKM) using RESM software [Citation63]. The R package edgeR v3.18.1 was used to perform statistical analysis on gene counts and to detect differentially expressed genes (DEGs). DEGs at each stage or site were used for further analyses of GO (gene ontology) Molecular Function and KEGG pathways using the R package clusterProfiler v3.4.4 [Citation64].
Analyses of TCGA data
RNA-seq data were downloaded from TCGA database (http://cancergenome.nih.gov/), and the aligned RNA-seq data (FPKM format) of all available invasive breast carcinoma datasets were downloaded in August 2016. Survival analysis was conducted using the survival package in R. Kaplan-Meier plots of overall patient survival were stratified by the median values of the individual mRNA expression in the TCGA datasets.
RT-PCR
The qPCR was performed using the 2−ΔΔCt method. The RNA was converted to cDNA using PrimeScript™ II 1st Strand cDNA Synthesis Kit (Cat.# 2690A, Takara), followed by reactions using Roche LightCycler 480 System (Roche). Each 10 μl reaction included 5 μl ChamQ SYBR qPCR Master Mix (Cat.# Q311-02, Vazyme), 0.8 μl RNAse-free water, 4μl cDNA (5 nM) and 0.2 μl primer. Actb was used as the internal control gene to give genes tested a relative fold change using the 2−ΔΔCt method. The qPCR primers were from PrimerBank [Citation65].
Histology
Mice mammary tumor tissues were embedded in paraffin, and 3-μm sections were cut and stained with hematoxylin and eosin (H&E).
Disclosure of potential conflicts of interest
No potential conflicts of interest were disclosed.
Supplemental Material
Download Zip (20 MB)Acknowledgments
The authenticity of this data has been validated by uploading the critical raw data onto the Research Data Deposit (RDD) public platform (www.researchdata.org.cn), with the approval RDD number as RDDB2018000303.
Additional information
Funding
Related Research Data
References
- Ferlay J, Soerjomataram I, Dikshit R, et al. Cancer incidence and mortality worldwide: sources, methods and major patterns in GLOBOCAN 2012. Int J Cancer. 2015;136:E359–E386. doi:10.1002/ijc.29210. PMID:25220842
- Zheng R, Zeng H, Zhang S, et al. Estimates of cancer incidence and mortality in China, 2013. Chin J Cancer. 2017;36:66. doi:10.1186/s40880-017-0234-3. PMID:28818111
- Chen W, Zheng R, Zhang S, et al. Cancer incidence and mortality in China, 2013. Cancer Lett. 2017;401:63–71. doi:10.1016/j.canlet.2017.04.024. PMID:28476483
- Xue B, Huang W, Yuan X, et al. YSY01A, a Novel proteasome inhibitor, induces cell cycle arrest on G2 Phase in MCF-7 Cells via ERalpha and PI3K/Akt Pathways. J Cancer. 2015;6:319–326. doi:10.7150/jca.10733. PMID:25767601
- Wu X, Sun L, Wang X, et al. Breast cancer invasion and metastasis by mPRalpha Through the PI3K/Akt Signaling Pathway. Pathol Oncol Res. 2016;22:471–476. doi:10.1007/s12253-015-0023-8. PMID:26608797
- Ching CB, Hansel DE. Expanding therapeutic targets in bladder cancer: the PI3K/Akt/mTOR pathway. Lab Invest. 2010;90:1406–1414. doi:10.1038/labinvest.2010.133. PMID:20661228
- Lee S, Choi EJ, Jin C, et al. Activation of PI3K/Akt pathway by PTEN reduction and PIK3CA mRNA amplification contributes to cisplatin resistance in an ovarian cancer cell line. Gynecol Oncol. 2005;97:26–34. doi:10.1016/j.ygyno.2004.11.051. PMID:15790433
- Ludwig JA, Lamhamedi-Cherradi SE, Lee HY, et al. Dual targeting of the insulin-like growth factor and collateral pathways in cancer: combating drug resistance. Cancers (Basel). 2011;3:3029–3054. doi:10.3390/cancers3033029. PMID:24212944
- Keane KN, Cruzat VF, Carlessi R, et al. Molecular events linking oxidative stress and inflammation to insulin resistance and beta-cell dysfunction. Oxid Med Cell Longev. 2015;2015:181643. doi:10.1155/2015/181643. PMID:26257839
- LoPiccolo J, Blumenthal GM, Bernstein WB, et al. Targeting the PI3K/Akt/mTOR pathway: effective combinations and clinical considerations. Drug Resist Updat. 2008;11:32–50. doi:10.1016/j.drup.2007.11.003. PMID:18166498
- Chang F, Lee JT, Navolanic PM, et al. Involvement of PI3K/Akt pathway in cell cycle progression, apoptosis, and neoplastic transformation: a target for cancer chemotherapy. Leukemia. 2003;17:590–603. doi:10.1038/sj.leu.2402824. PMID:12646949
- Martini M, De Santis MC, Braccini L, et al. PI3K/AKT signaling pathway and cancer: an updated review. Ann Med. 2014;46:372–383. doi:10.3109/07853890.2014.912836. PMID:24897931
- Taniguchi CM, Kondo T, Sajan M, et al. Divergent regulation of hepatic glucose and lipid metabolism by phosphoinositide 3-kinase via Akt and PKClambda/zeta. Cell Metab. 2006;3:343–353. doi:10.1016/j.cmet.2006.04.005. PMID:16679292
- Mohan CD, Srinivasa V, Rangappa S, et al. Trisubstituted-imidazoles induce apoptosis in human breast cancer cells by targeting the oncogenic PI3K/Akt/mTOR signaling pathway. PLoS One. 2016;11:e0153155. doi:10.1371/journal.pone.0153155. PMID:27097161
- Luo J, Manning BD, Cantley LC. Targeting the PI3K-Akt pathway in human cancer: rationale and promise. Cancer Cell. 2003;4:257–262. doi:10.1016/S1535-6108(03)00248-4. PMID:14585353
- Yap TA, Garrett MD, Walton MI, et al. Targeting the PI3K-AKT-mTOR pathway: progress, pitfalls, and promises. Curr Opin Pharmacol. 2008;8:393–412. doi:10.1016/j.coph.2008.08.004. PMID:18721898
- Naba A, Hoersch S, Hynes RO. Towards definition of an ECM parts list: an advance on GO categories. Matrix Biol. 2012;31:371–372. doi:10.1016/j.matbio.2012.11.008. PMID:23199376
- Hynes RO. Integrins: bidirectional, allosteric signaling machines. Cell. 2002;110:673–687. doi:10.1016/S0092-8674(02)00971-6. PMID:12297042
- Turley EA, Noble PW, Bourguignon LY. Signaling properties of hyaluronan receptors. J Biol Chem. 2002;277:4589–4592. doi:10.1074/jbc.R100038200. PMID:11717317
- Sanderson RD, Yang Y, Suva LJ, et al. Heparan sulfate proteoglycans and heparanase–partners in osteolytic tumor growth and metastasis. Matrix Biol. 2004;23:341–352. doi:10.1016/j.matbio.2004.08.004. PMID:15533755
- Brennan KR, Brown AM. Wnt proteins in mammary development and cancer. J Mammary Gland Biol Neoplasia. 2004;9:119–131. doi:10.1023/B:JOMG.0000037157.94207.33. PMID:15300008
- Bianchi-Smiraglia A, Paesante S, Bakin AV. Integrin beta5 contributes to the tumorigenic potential of breast cancer cells through the Src-FAK and MEK-ERK signaling pathways. Oncogene. 2013;32:3049–3058. doi:10.1038/onc.2012.320. PMID:22824793
- Hou Y, Zhou M, Xie J, et al. High glucose levels promote the proliferation of breast cancer cells through GTPases. Breast Cancer (Dove Med Press). 2017;9:429–436. PMID:28670141
- Zhu J, Xiong G, Trinkle C, et al. Integrated extracellular matrix signaling in mammary gland development and breast cancer progression. Histol Histopathol. 2014;29:1083–1092. PMID:24682974
- Misra S, Ghatak S, Zoltan-Jones A, et al. Regulation of multidrug resistance in cancer cells by hyaluronan. J Biol Chem. 2003;278:25285–25288. doi:10.1074/jbc.C300173200. PMID:12738783
- Kaplan RN, Riba RD, Zacharoulis S, et al. VEGFR1-positive haematopoietic bone marrow progenitors initiate the pre-metastatic niche. Nature. 2005;438:820–827. doi:10.1038/nature04186. PMID:16341007
- Psaila B, Lyden D. The metastatic niche: adapting the foreign soil. Nat Rev Cancer. 2009;9:285–293. doi:10.1038/nrc2621. PMID:19308068
- Erler JT, Bennewith KL, Cox TR, et al. Hypoxia-induced lysyl oxidase is a critical mediator of bone marrow cell recruitment to form the premetastatic niche. Cancer Cell. 2009;15:35–44. doi:10.1016/j.ccr.2008.11.012. PMID:19111879
- Lin EY, Jones JG, Li P, et al. Progression to malignancy in the polyoma middle T oncoprotein mouse breast cancer model provides a reliable model for human diseases. Am J Pathol. 2003;163:2113–2126. doi:10.1016/S0002-9440(10)63568-7. PMID:14578209
- Herschkowitz JI, Simin K, Weigman VJ, et al. Identification of conserved gene expression features between murine mammary carcinoma models and human breast tumors. Genome Biol. 2007;8:R76. doi:10.1186/gb-2007-8-5-r76. PMID:17493263
- Guy CT, Cardiff RD, Muller WJ. Induction of mammary tumors by expression of polyomavirus middle T oncogene: a transgenic mouse model for metastatic disease. Mol Cell Biol. 1992;12:954–961. doi:10.1128/MCB.12.3.954. PMID:1312220
- Luo M, Guan JL. Focal adhesion kinase: a prominent determinant in breast cancer initiation, progression and metastasis. Cancer Lett. 2010;289:127–139. doi:10.1016/j.canlet.2009.07.005. PMID:19643531
- Rodriguez-Viciana P, Collins C, Fried M. Polyoma and SV40 proteins differentially regulate PP2A to activate distinct cellular signaling pathways involved in growth control. Proc Natl Acad Sci U S A. 2006;103:19290–19295. doi:10.1073/pnas.0609343103. PMID:17158797
- Schaffhausen B, Benjamin TL. Comparison of phosphorylation of two polyoma virus middle T antigens in vivo and in vitro. J Virol. 1981;40:184–196. PMID:6169848
- Su W, Liu W, Schaffhausen BS, et al. Association of Polyomavirus middle tumor antigen with phospholipase C-gamma 1. J Biol Chem. 1995;270:12331–12334. doi:10.1074/jbc.270.21.12331. PMID:7759472
- Lifsted T, Le Voyer T, Williams M, et al. Identification of inbred mouse strains harboring genetic modifiers of mammary tumor age of onset and metastatic progression. Int J Cancer. 1998;77:640–644. doi:10.1002/(SICI)1097-0215(19980812)77:4%3c640::AID-IJC26%3e3.0.CO;2-8. PMID:9679770
- Qiu TH, Chandramouli GV, Hunter KW, et al. Global expression profiling identifies signatures of tumor virulence in MMTV-PyMT-transgenic mice: correlation to human disease. Cancer Res. 2004;64:5973–5981. doi:10.1158/0008-5472.CAN-04-0242. PMID:15342376
- Ramaswamy S, Ross KN, Lander ES, et al. A molecular signature of metastasis in primary solid tumors. Nat Genet. 2003;33:49–54. doi:10.1038/ng1060. PMID:12469122
- Davie SA, Maglione JE, Manner CK, et al. Effects of FVB/NJ and C57Bl/6J strain backgrounds on mammary tumor phenotype in inducible nitric oxide synthase deficient mice. Transgenic Res. 2007;16:193–201. doi:10.1007/s11248-006-9056-9. PMID:17206489
- Qian CN. Exploration of the postponing mechanism that delays carcinoma onset. Cancer Cell Int. 2010;10:38. doi:10.1186/1475-2867-10-38. PMID:20969754
- Cai Y, Nogales-Cadenas R, Zhang Q, et al. Transcriptomic dynamics of breast cancer progression in the MMTV-PyMT mouse model. BMC Genomics. 2017;18:185. doi:10.1186/s12864-017-3563-3. PMID:28212608
- Osaki M, Oshimura M, Ito H. PI3K-Akt pathway: its functions and alterations in human cancer. Apoptosis. 2004;9:667–676. doi:10.1023/B:APPT.0000045801.15585.dd. PMID:15505410
- Malaney S, Daly RJ. The ras signaling pathway in mammary tumorigenesis and metastasis. J Mammary Gland Biol Neoplasia. 2001;6:101–113. doi:10.1023/A:1009572700317. PMID:11467446
- Lowe SW, Lin AW. Apoptosis in cancer. Carcinogenesis. 2000;21:485–495. doi:10.1093/carcin/21.3.485. PMID:10688869
- Teixeira LK, Reed SI. Ubiquitin ligases and cell cycle control. Annu Rev Biochem. 2013;82:387–414. doi:10.1146/annurev-biochem-060410-105307. PMID:23495935
- Tarone G, Hirsch E, Brancaccio M, et al. Integrin function and regulation in development. Int J Dev Biol. 2000;44:725–731. PMID:11061437
- Pankov R, Yamada KM. Fibronectin at a glance. J Cell Sci. 2002;115:3861–3863. doi:10.1242/jcs.00059. PMID:12244123
- Wei CY, Tan QX, Zhu X, et al. Expression of CDKN1A/p21 and TGFBR2 in breast cancer and their prognostic significance. Int J Clin Exp Pathol. 2015;8:14619–14629. PMID:26823785
- Sahar S, Sassone-Corsi P. Metabolism and cancer: the circadian clock connection. Nat Rev Cancer. 2009;9:886–896. doi:10.1038/nrc2747. PMID:19935677
- Parker JS, Mullins M, Cheang MC, et al. Supervised risk predictor of breast cancer based on intrinsic subtypes. J Clin Oncol. 2009;27:1160–1167. doi:10.1200/JCO.2008.18.1370. PMID:19204204
- Webster MA, Hutchinson JN, Rauh MJ, et al. Requirement for both Shc and phosphatidylinositol 3′ kinase signaling pathways in polyomavirus middle T-mediated mammary tumorigenesis. Mol Cell Biol. 1998;18:2344–2359. doi:10.1128/MCB.18.4.2344. PMID:9528804
- Songyang Z, Shoelson SE, Chaudhuri M, et al. SH2 domains recognize specific phosphopeptide sequences. Cell. 1993;72:767–778. doi:10.1016/0092-8674(93)90404-E. PMID:7680959
- Guerrero-Zotano A, Mayer IA, Arteaga CL. PI3K/AKT/mTOR: role in breast cancer progression, drug resistance, and treatment. Cancer Metastasis Rev. 2016;35:515–524. doi:10.1007/s10555-016-9637-x. PMID:27896521
- Cidado J, Park BH. Targeting the PI3K/Akt/mTOR pathway for breast cancer therapy. J Mammary Gland Biol Neoplasia. 2012;17:205–216. doi:10.1007/s10911-012-9264-2. PMID:22865098
- Chu PY, Huang LY, Hsu CH, et al. Tyrosine phosphorylation of growth factor receptor-bound protein-7 by focal adhesion kinase in the regulation of cell migration, proliferation, and tumorigenesis. J Biol Chem. 2009;284:20215–20226. doi:10.1074/jbc.M109.018259. PMID:19473962
- Liu X, He Y, Li F, et al. Caspase-3 promotes genetic instability and carcinogenesis. Mol Cell. 2015;58:284–296. doi:10.1016/j.molcel.2015.03.003. PMID:25866249
- Feng D, Tu Z, Wu W, et al. Inhibiting the expression of DNA replication-initiation proteins induces apoptosis in human cancer cells. Cancer Res. 2003;63:7356–7364. PMID:14612534
- Sherr CJ. Cancer cell cycles. Science. 1996;274:1672–1677. doi:10.1126/science.274.5293.1672. PMID:8939849
- McGowan PM, Kirstein JM, Chambers AF. Micrometastatic disease and metastatic outgrowth: clinical issues and experimental approaches. Future Oncol. 2009;5:1083–1098. doi:10.2217/fon.09.73. PMID:19792975
- Alsarraj J, Hunter KW. Bromodomain-containing protein 4: A dynamic regulator of breast cancer metastasis through modulation of the extracellular matrix. Int J Breast Cancer. 2012;2012:670632. doi:10.1155/2012/670632. PMID:22295248
- Smith GC, Ong WK, Rewcastle GW, et al. Effects of acutely inhibiting PI3K isoforms and mTOR on regulation of glucose metabolism in vivo. Biochem J. 2012;442:161–169. doi:10.1042/BJ20111913. PMID:22142257
- Verges B, Walter T, Cariou B. Endocrine side effects of anti-cancer drugs: effects of anti-cancer targeted therapies on lipid and glucose metabolism. Eur J Endocrinol. 2014;170:R43–R55. doi:10.1530/EJE-13-0586. PMID:24154684
- Li B, Dewey CN. RSEM: accurate transcript quantification from RNA-Seq data with or without a reference genome. BMC Bioinformatics. 2011;12:323. doi:10.1186/1471-2105-12-323. PMID:21816040
- Yu G, Wang LG, Han Y, et al. clusterProfiler: an R package for comparing biological themes among gene clusters. OMICS. 2012;16:284–287. doi:10.1089/omi.2011.0118. PMID:22455463
- Spandidos A, Wang X, Wang H, et al. PrimerBank: a resource of human and mouse PCR primer pairs for gene expression detection and quantification. Nucleic Acids Res. 2010;38:D792–D799. doi:10.1093/nar/gkp1005. PMID:19906719