
ABSTRACT
Osteosarcoma (OS) is the most prevalent bone malignancy in childhood and adolescence, with highly aggressive and early systemic metastases. Here, we reported that celecoxib, a selective COX-2 inhibitor in the NSAID class, exhibits strong antitumor activity in dose dependent manner in two OS cell lines-143B and U2OS. We showed that celecoxib inhibits OS cell growth, causes G0/G1-phase arrest, modulates apoptosis and autophagy and reduces migration in OS cells. In addition, the results of fluorescent mitochondrial probe JC-1 test indicated that the mitochondrial pathway mediates celecoxib-induced apoptosis. Significantly, the autophagy inhibitor CQ combined with celecoxib causes greater cell proliferation inhibition and apoptosis. Pharmacologic inhibition of autophagy with another potent autophagy inhibitor SAR405 also enhances celecoxib-mediated suppression of cell viability. These results were confirmed with shRNAs targeting the autophagy-related gene Atg5. In OS tumor xenografts in vivo, celecoxib also presents antitumor activity. Taken together, our results shed light on the function and mechanism of antitumor action of celecoxib for treatment of OS patients.
Keywords:
Introduction
Osteosarcoma (OS) is considered to be the most prevalent bone malignancy in childhood and adolescence [Citation1]. OS exhibits a predilection to occur in the longbones of limbs, with highly aggressive and early systemic metastases [Citation2]. Although great progress has been made in surgical treatment along with chemotherapy, the 5-year overall survival rate for OS has not been significantly improved due to tumor local relapse and metastases [Citation3,Citation4]. Current chemotherapy regimens have only progress slowly, particularly during the last 30 y [Citation5]. Therefore, it is still urgent to develop novel therapeutic approaches for osteosarcoma treatment.
Cyclooxygenase-2 (COX-2), the rate-limiting enzyme in prostaglandin (PG) synthesis, has been found to be associated with inflammatory diseases and carcinogenesis [Citation6,Citation7]. Evidence indicates that the overexpression of COX-2 is related to poor prognosis in a number of different cancers through the inhibition of apoptosis and the promotion of proliferation, angiogenesis, and invasion [Citation8,Citation9]. Celecoxib, a selective COX-2 inhibitor in the NSAID class, is primarily used as an anti-inflammatory drug for the symptomatic treatment of pain associated with rheumatoid arthritis or osteoarthritis [Citation10]. Accumulating studies have shown that patients with several types of cancer can benefit from long-term use of celecoxib [Citation11–Citation14]. However, the function and underlying molecular mechanisms of celecoxib for human OS are still subject to ongoing investigation.
Autophagy, also known as type II programmed cell death (PCD), can be described as a “self-eating” process in which cells deliver damages organelles to lysosomes for energy and nutrient recycling. Autophagy plays a key role in many cellular processes and shows relevance to tumor dormancy [Citation15]. Recent studies have shown that several chemotherapeutics promote autophagy [Citation16]. Autophagy was reported to determine the response of tumor cells to chemotherapeutic drugs for cancer [Citation17,Citation18]. In addition, increasing evidence has shown that the combination of autophagy inhibition with chemotherapy triggered improved tumor cell death [Citation19–Citation21].
Chloroquine (CQ) and its derivatives such as hydroxychloroquine (HCQ), have been identified as effective autophagy inhibitors which prevent the acidification of the lysosomal compartment [Citation22–Citation24]. They have been used independently or in combination with chemotherapeutic drugs to enhance tumor cell death in vitro and in vivo [Citation25,Citation26]. However, these studies are limited by the high concentrations of CQ and HCQ required to modulate autophagy without viable alternatives [Citation27,Citation28]. Efforts to identify small molecule inhibitors that specifically target autophagy have commenced. SAR405, a potent autophagy inhibitor, causes significant impairment of lysosomal function and inhibits vesicle trafficking between late endosomes to lysosomes [Citation29]. However, the role of CQ or SAR405 may be related to autophagy-independent function and attributed to lysosomal instability [Citation25]. Thus, to test the role of autophagy in studies, targeting conserved key regulators known as autophagy-related (Atg) proteins can provide a better understanding of the involvement of autophagy in cancer.
It has been reported that induction of autophagy can confer resistance of osteosarcoma cells to doxorubicin, cisplatin and methotrexate [Citation30]. The presence of an autophagy inhibitor improves the therapeutic effect of Apatinib treatment in osteosarcoma [Citation31]. On the other hand, autophagy as a tumor suppressive factor contributes to apoptotic cell death [Citation32,Citation33]. Given that autophagy can promote cell survival or cell death, autophagy has become an unresolved target of cancer treatment.
In this study, we evaluated the anti-tumor effect of celecoxib on OS cell lines in vitro and in vivo. Furthermore, we explored whether autophagy inhibition via inhibitors (CQ, SAR405) or silencing Atg5 expression enhances the anticancer effect of celecoxib. On the basis of these findings we conclude that celecoxib, combined with autophagy inhibition, provides an innovative approach for OS treatment.
Results
Celecoxib exerts anticancer effect in OS cells
To investigate in vitro the anticancer effect of celecoxib on OS cells, we first tested whether it inhibited cellular growth of 143B and U2OS cells using Cell Counting Kit-8 (CCK-8) assay ()). Celecoxib showed anti-proliferation effect at various concentrations after 24, 48 and 72 h treatment in a time and dose-dependent manner. The colony-formation assay was performed to further verify the anti-proliferation effect of celecoxib. Two cancer cell lines 143B and U2OS were incubated with celecoxib at different concentrations (40, 80, 120 μM) for 14 d. The colony formation of OS cells was almost completely restrained by celecoxib treatment at 120 μM concentration ()). These results revealed that celecoxib caused proliferation inhibition of OS cells. Next, we determined the effects of celecoxib on cell cycle progression in 143B and U2OS cells. Flow cytometry analysis was used to examine the variation of cell cycle phase distribution induced by celecoxib treatment for 48h. In OS cell lines 143B and U2OS celecoxib increased cell proportion in G0/G1 phase, but reduced cell proportion in S and G2/M phases in a concentration-dependent manner ()).
Figure 1. Celecoxib inhibits cell proliferation, migration and induces G0/G1 arrest in human OS cells. (a) Celecoxib inhibited 143B and U2OS cell proliferation as determined by CCK-8 assay. OS cells were treated with different concentrations of celecoxib for 24h, 48h and 72h, respectively. (b) The effect of celecoxib on the colony formation of OS cell lines. (c) G0/G1-phase arrest was discovered after celecoxib 48h treatment. 143B and U2OS cells were treated with control or celecoxib (40, 80, and 120 µM). (d) The migration assay indicated that celecoxib clearly inhibited the migration of OS cells. *p < 0.05, significantly different compared with control.
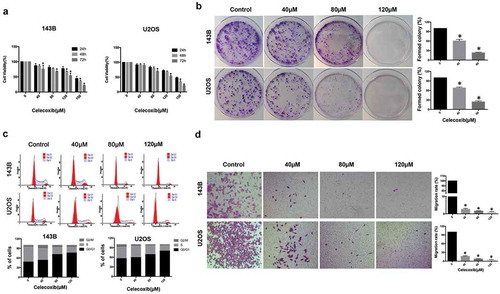
Next, we analyzed the change in migration ability of 143B and U2OS cells with celecoxib treatment. The migration assay indicated that much fewer cells with celecoxib treatment migrated through the membrane compared with control cells, suggesting that celecoxib can inhibit OS cell migration ()).
Celecoxib induces apoptosis of OS cells
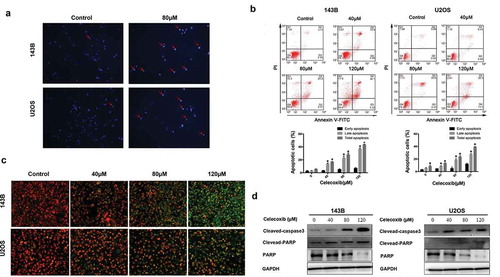
To investigate whether celecoxib is involved in the induction of apoptosis, Hoechst 33342 staining was performed to detect the effects of celecoxib on apoptosis in OS cells. The results indicated that after 24 h treatment with 80 µM celecoxib, cells exhibited apoptotic morphology, including cell shrinkage, chromatin condensation and nuclei fragmentation ()). In addition, flow cytometry analysis with the staining of Annexin V-FITC/PI was performed. Compared with control, celecoxib treatment significantly increased the apoptosis rate of OS cells in a dose-dependent manner ()). Mitochondrial probe JC-1 has been used as an apoptosis marker [Citation34]. We examined JC-1 to confirm the effect of celecoxib, while assessment of the mitochondrial membranes indicated that the celecoxib-treated cells displayed an obvious shift from red to green, demonstrating the induction of apoptosis ()). Next, we analyzed the caspase substrate (polyADP ribose polymerase (PARP) and caspase-3) cleavage and found that the cleavages of caspase-3 and PARP were elevated after cells were exposed to 40, 80, 120 μM of celecoxib. Furthermore, celecoxib treatment caused an obvious decrease of PARP in a dose-dependent manner in both 143B and U2OS cells ()). Altogether, these results indicate that celecoxib induces apoptosis in OS cells.
Figure 2. Celecoxib induces apoptosis in OS cells. (a) After OS cells were treated with celecoxib for 24h, cells were stained with Hoechst 33,342 to assess nuclear morphology changes and then visualized under fluorescence microscopy. (b) Apoptosis cells induced by celecoxib were stained with Annexin V/PI and analyzed by flow cytometry. (c) The mitochondrial membrane changes after celecoxib treatment were measured using JC-1 staining. (d) 143B and U2OS cells were incubated with celecoxib for 48h, western blot analysis was used to observe the expression level of PARP, cleaved PARP and cleaved-caspase 3. *p < 0.05, significantly different compared with control.
Celecoxib induces autophagy of OS cells
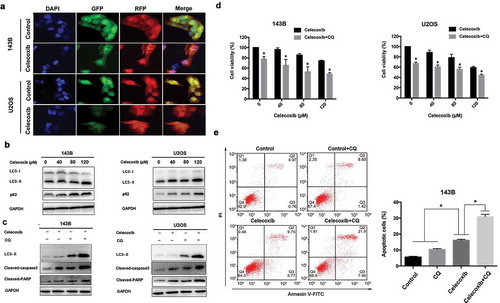
As autophagy plays an important role in cell death, we were interested in exploring the effect of celecoxib on autophagy function. Autophagy is characterized by increased acidic vesicular organelles, which correlated with increased autophagosomes [Citation35]. We used mRFP-GFP-LC3 lentivirus to monitor autophagic dynamics. We found that celecoxib treatment resulted in a significant increase in LC3 puncta formation in OS cells ()). LC3 and P62 are the classical autophagic markers, and accumulating evidence suggests that LC3-I is cleaved into a lipidated LC3-II during the maturation of the autophagosome [Citation27]. The expression of LC3-II was elevated in a concentration-dependent manner in both 143B and U2OS cells upon celecoxib treatment. In addition, p62 protein levels were also dramatically elevated following celecoxib treatment ()). To confirm the role of celecoxib on autophagy, autophagic flux assays were performed by treating cells with celecoxib in the presence or absence of the autophagy inhibitor CQ. As shown in ), the combination of CQ and celecoxib also increased the expression of LC3-II in OS cells compared with treatment of celecoxib or CQ alone, indicating that celecoxib induces autophagic flux in these cells ()). Conversely, to determine the effect of autophagy response on celecoxib-induced apoptosis and inhibition of proliferation, we employed the autophagy inhibitor chloroquine(CQ) to block autophagy. The combination of celecoxib and CQ resulted in a significant augmentation in cell death ()). We also found that CQ markedly increased celecoxib-induced apoptosis and the levels of cleaved PARP and cleaved-caspase 3 in OS cells upon celecoxib treatment ()). Previous studies show that autophagy has a dual role for therapeutic purpose in cancer and can enhance cell survival or contribute to cell death [Citation36]. Our data suggested that celecoxib-induced autophagy may be protective of cell survival in OS cells.
Figure 3. Celecoxib activates autophagy in OS cells. (a) OS cells stably expressing mRFP-GFP-LC3 were treated with control and the indicated concentrations of celecoxib for 24 h. Representative images showed mRFP-LC3 and GFP-LC3 puncta. (b) Cells were treated with various concentrations of celecoxib for 48h, autophagy-associated protein LC3 and p62 were detected by western blot analysis. (c)143B and U2OS were pre-treated with CQ (20 µM) for 2h and incubated with celecoxib (120 µM) for 24 h, the expression level of LC3, cleaved PARP and cleaved-caspase 3 were assessed by western blot analysis. (d)143B and U2OS were pre-treated with CQ (20 µM) for 2 h and incubated with celecoxib (120 µM) for 24 h, CCK-8 assay was performed to analyzed cell proliferation. (e) 143B were pre-treated with CQ (20 µM) for 2 h and incubated with celecoxib (120 µM) for 24 h, Annexin V/PI staining followed by flow cytometry was adopted to evaluate the apoptosis cells. *p < 0.05, significantly different compared with control.
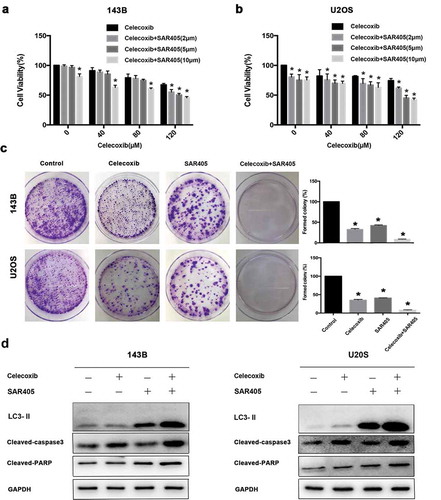
SAR405, a small-molecule kinase inhibitor of Vps18 and Vps34, was identified as a potent autophagy inhibitor and acts by impairing lysosomal function and affecting vesicle trafficking between late endosomes to lysosomes [Citation29]. To characterize the effects of SAR405 on autophagy, OS cells were with SAR405 at various concentrations. Western blot results showed that SAR405 treatment increased the LC3-II level in concentration-dependent manner (Figure S1a). To determine if SAR405 treatment was blocking the clearance of autophagic vesicles as an autophagy inhibitor, not inducing production of autophagic vesicles as an autophagy inducer, a bafilomycin clamp experiment was performed (Figure S1b). OS cells were treated with DMSO or SAR405 in the absence or presence of bafilomycin. SAR405 treatment did not result in a further increase in the LC3II/LC3I ratio in bafilomycin-treated cells compared with control cells, confirming that SAR405 is an autophagy inhibitor. To determine whether modulating the autophagy pathway could modify the cytotoxicity of celecoxib, we treated OS cells with celcecoxib and various concentrations of SAR405 and performed cell viability assays. The addition of SAR405 at 2, 5, 10 μM to celecoxib resulted in a significant inhibition of cell viability compared with celecoxib treatment alone in 143B and U2OS cells (. The clonogenic survival assays also demonstrated that SAR405 substantially enhanced the cytotoxicity of celecoxib in OS cells ()). We also found that SAR405 markedly increased cleaved PARP and cleaved caspase 3 levels in OS cells upon celecoxib treatment, confirming that the combination treatment induces further apoptosis ()). Compared with control cells, the cells treated with SAR405 exhibited an increased level of LC3-II, demonstrating that SAR405 inhibited autophagy resulting decreased lysosomal degradation of LC3-II ()).
Figure 4. The inhibition of autophagy via SAR405 potentiates celecoxib-induced growth inhibition and apoptosis of OS cells. (a) 143B and (b) U2OS were pre-treated with SAR405 at various concentrations (2, 5, 10 µM) for 2 h and incubated with celecoxib (120 µM) for 24 h, CCK-8 assay was performed to analyze cell proliferation. (c) 143B and U2OS were treated with SAR405 (2 µM) and celecoxib (80 µM) for 10d, and the colony activity of cell lines was measured by colony formation. (d) 143B and U2OS were pre-treated with SAR405 (10 µM) for 2 h and incubated with celecoxib (120 µM) for 24 h, the expression levels of LC3, cleaved PARP and cleaved-caspase3 were assessed by western blot analysis. *p < 0.05, significantly different compared with control.
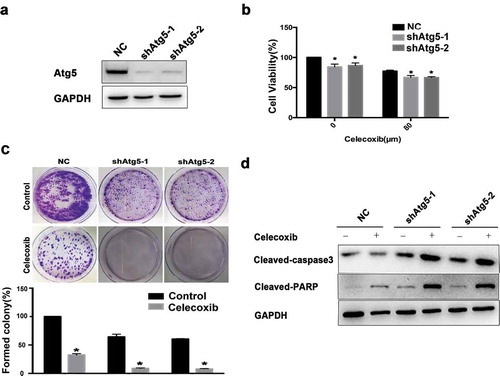
Further, we tested whether inhibiting autophagy via Atg5 knockdown would affect celecoxib-mediated cell death. Western blot analysis confirmed the efficient knockdown of Atg5 protein in 143B cells ()). The CCK-8 and colony formation assays were then performed to further investigate the anti-proliferation effect of the combination of Atg5 depletion and celecoxib treatment. Indeed, Atg5 knockdown led to a significant inhibition of cell proliferation in 143B cells (. Furthermore, OS cells stably expressing Atg5 were treated with celecoxib at 120 μM for 48h, and the levels of cleaved PARP and cleaved-caspase 3 were determined by western blot. The results showed that the knockdown of Atg5 combining with celecoxib treatment increased the level of apoptotic markers ()).
Figure 5. Atg5 knockdown potentiates celecoxib-induced growth inhibition and apoptosis of OS cells. (a) The Atg5 knockdown effects were confirmed by western blot analysis. GAPDH served as a loading control. (b) 143B cells were treated with shRNA targeting Atg5, or control in the presence or absence of celecoxib (120 µM) for 48 hours. Cell viability was measured using a CCK-8 assay. (c) The colony formation was determined by staining with trypan blue. (d) The expression levels of cleaved PARP and cleaved caspase-3 were analyzed by western blotting.
Celecoxib effectively suppresses tumor formation in vivo
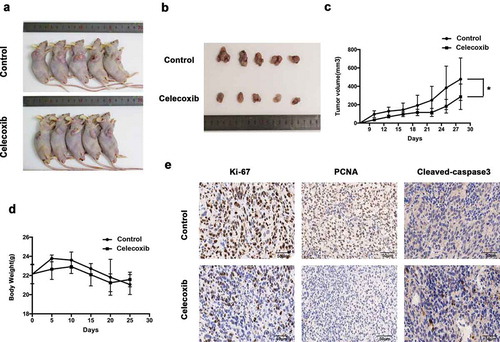
We further investigated whether celecoxib could exert antitumor effects in xenograft mice in vivo. Nude mice were subcutaneously injected in the flanks with 143B cells and randomly assigned to two groups when the xenografts reached approximately 100 mm3 Compared with the control mice, the mice treated with celecoxib (once in two days at 100 mg/kg dosage) had substantially reduced tumor growth ()). Meanwhile, there were no significant changes in body weight or toxicity in any mice during the experimental period ()), indicating that celecoxib at the designed dose was safe. Finally, mice were sacrificed to obtain tumors after 28 d of treatment. Immunohistochemistry (IHC) staining of the obtained tumors revealed that celecoxib-treated tumors exhibited weaker Ki-67 and PCNA staining, whereas stronger staining of cleaved-caspase3 was detected in celecoxib-treated tumors ()). Overall, our results indicate that in agreement with the results in vitro, celecoxib demonstrates potent anti-proliferative activity in vivo.
Figure 6. Celecoxib inhibits OS xenograft growth in vivo. (a,b) 143B cells were inoculated into the subcutaneous of BALB/c-nu mice. Pictures of BALB/c-nude mice in each group after subcutaneous injections of 143B cells vehicle or celecoxib (100 mg/kg, oral administration) every other day for four weeks. (c) Tumor volume was measured every 3 d. (d) Body weights were measured every week. (e) The expression of PCNA (proliferating cell nuclear antigen), Ki-67 and cleaved-caspase-3 were examined by immunohistochemistry. *p < 0.05, significantly different compared with control.
Discussion
Our data expand prior research results utilizing celecoxib as a preventive agent for OS formation [Citation37] In the present study, we have shown that celecoxib treatment decreases cell viability and increases cell death in a dose and time-dependent manner for different sub-types of OS cell lines. Moreover, celecoxib increases the proportion in G0/G1 phase and decreases the cell proportion in G2/M and S phases in OS cells. Importantly, our study is the first to demonstrate that celecoxib inhibits migration ability of OS cells in vitro. Our results also suggest that mitochondrial pathway mediated celecoxib-induced apoptosis.
Celecoxib, a small-molecule selective COX-2 inhibitor, has been shown to decrease cancer development and metastasis in several cancer types [Citation38–Citation41]. It was reported in several studies that both COX-2 dependent and independent mechanisms may act on changes of biological behavior, in which the inhibition of PDK-1/Akt signaling and decreased prostaglandin E2(PEG2) production seem to play an important role in proliferation inhibition and apoptosis [Citation42–Citation44]. Recently, celecoxib was found to inhibit TGF-β1-induced EMT, implying that celecoxib-induced suppression of EMT may contribute to attenuation of the invasiveness of cancer cells [Citation45]. We applied a comprehensive analysis of the effect of celecoxib on OS in vitro. Data from our study showed that celecoxib inhibits OS cell growth and migration, causes G0/G1-phase arrest, and modulates apoptosis and autophagy in OS cells. Significantly, the autophagy inhibitor CQ and celecoxib in combination showed greater cell proliferation inhibition and apoptosis than each one separately.
Autophagy can lead to cell death in many cells [Citation46–Citation48]. However, there is also evidence to show that autophagy acts to protect cell survival [Citation49], which suggests that autophagy plays a dual role in cancer therapy. There have been conflicting reports of the effect of celecoxib on autophagy, highlighting that celecoxib-induced autophagy or autophagy inhibition varies depending on the tumor types. Our study found that celecoxib induces conversion of LC3-I to LC3-II, indicating that celecoxib induces autophagy in OS cells in a dose-dependent manner. Autophagy, which could be a double-edged sword in cancer therapy, prompted us to investigate the role of autophagy in celecoxib therapy for OS. The autophagy inhibitor CQ, another new potent autophagy inhibitor SAR405, or knockdown of Atg5 was used to suppress autophagy pharmacologically or genetically in OS cells. We found that autophagy inhibition treatment pharmacologically or genetically consistently increases celecoxib-induced cell death and apoptosis significantly, indicating that autophagy plays a protective role in cell survival and that the inhibition of autophagy can enhance the anti-tumor effect of celecoxib in OS.
Hydroxychloroquine (HCQ), the analog of CQ, inhibits autophagy and is proved to be three folds less toxic than CQ in recent phase I/II clinical trials [Citation50]. However, given the limit of HCQ in long-term and high-dose treatment, better and more specific autophagy inhibitors were identified, such as SAR405 and Lys05 [Citation29]. Indeed, a recent report investigating sunitinib in combination with Lys05 demonstrated that Lys05 inhibits autophagy and enhances sunitinib-mediated suppression of cell viability in clear cell ovarian carcinoma [Citation51]. Here, we found that SAR405 was a potent inhibitor of autophagy and played a significantly more cytotoxic effect in low-dose compared with CQ in osteosarcoma, suggesting that SAR405 may have great therapeutic efficacy in osteosarcoma. Further studies are needed for other cancer types.
Similar to our findings in vitro, tumor proliferation was significantly decreased in mice treated with celecoxib, indicating that celecoxib may function in an anti-tumor manner. Furthermore, immunohistochemical analyses revealed that the celecoxib group had a greater amount of cleaved caspase-3 and substantially decrease in proliferation markers Ki-67 and PCNA, suggesting that the reduction of tumor growth in the celecoxib treatment group is due to both increased apoptosis and decreased proliferation.
In conclusion, celecoxib presents strong antitumor effect in OS in vitro and in vivo. Celecoxib inhibits OS cell growth and migration, causes cell cycle arrest, and modulates apoptosis and autophagy. Significantly, gene silencing of Atg5 or treatment with autophagy inhibitor CQ or SAR405 markedly enhances cell proliferation inhibition and promotes apoptosis induced by celecoxib. Our study indicates that combinatorial autophagy inhibition with celecoxib might have potential therapeutic values for OS.
Materials and methods
Cells and cell culture
The human osteosarcoma cancer cell lines (U2OS, 143B) were obtained from the Cell Bank of China Academy of Sciences (Shanghai, China). These cell lines were cultured routinely in high-glucose Dulbecco’s Modified Eagle’s Medium (DMEM) supplemented with 10% fetal bovine serum, 100 U/ml penicillin, and 100 μg/ml streptomycinin incubator with standard culture conditions (37°C in humidified atmosphere containing 5% CO2).
Reagents and antibodies
Celecoxib (Pfizer, USA) was dissolved in DMSO to produce a 200 mM stock, and stored at −20°C. For western blot, the primary antibodies against Cleaved caspase3, Cleaved PARP, LC3, p62 were purchased from Cell Signaling Technology (Beverly, MA, USA). Annexin V-FITC and PI were bought from BD Bioscience (BD, NJ, USA).
Colony formation assay
For colony formation assays, 2 × 10³/ml cells (U2OS, 143B) were respectively seeded and incubated with celecoxib at the various concentration (40, 80, 120 µM) in 60 mm dishes for 14 d. Cell colonies were fixed with 4% paraformaldehyde and stained with 0.1% crystal violet solution for 15 min at room temperature. The colonies that consisted of more than 50 cells were counted.
Cell growth assay
Cell growth was analyzed by the Cell Counting Kit-8 assay (Dojindo, Japan) according to the manufacturer’s Instruction. OS cells were seeded at a density of 1000 cells/well in 96-well culture plates overnight. Then the cells were treated with celecoxib at the different concentrations (40, 80, 120, 150 and 200 µM). After treatment with the celecoxib for 24 h, 48 h, 72 h, respectively, the cells were incubated with CCK-8 solutions at 37°C for 2 hours and absorbance was measured at 450 nm with a microplate reader.
Cell migration assay
The migration ability of cells was examined using 24-well Transwell chambers (8.0 μm pore, Coring Costar, USA). 5 × 10⁴ cells were seeded into the upper chamber with serum-free DMEM medium containing different concentrations of celecoxib (0, 40, 80 and120 μM), and DMEM medium containing 10% fetal bovine serum was added in the bottom chamber. After 24 h incubation at 37°C, the cells were removed with cotton wool. Cells that had migrated through the membrane were fixed with 4% paraformaldehyde, and then stained with 0.1% crystal violet. The number of migrated cells was photographed and counted through 16 fields under the microscopy (100× magnification).
Cell cycle and apoptosis analysis
The cells were seeded onto 6-well plates at a density of 1 × 10⁵ per well overnight, and were treated with celecoxib at different concentrations for 48 h. For cell cycle analysis, the cells were incubated with propidium iodide (PI) according to the instructions of the manufactures. The cells were finally analyzed by Beckham flow cytometer (USA). For cell apoptosis analysis, after washed with the cold PBS, these cells were double stained with Annexin V-FITC and PI (BD, San Diego, USA) according to the protocols provided by the manufactures.
Morphological apoptosis
Cells were treated with 80µM celecoxib for 24h after complete attachment. Before treatment, they were cultured in 6-well plates with glass bottoms at a density of 5 × 10⁵/ml. After celecoxib treatment, cells were stained with Hoechst 33,342 for 15 min at 37°C and were observed using a fluorescence microscope. All the operation was done in the dark.
Mitochondrial membrane potential assay
The changes of mitochondrial membrane potential were detected using the JC-1 Assay Kit (Beyotime, Beijing, China). Briefly, the cells were seeded in 12-well plates at a density of 5 × 10⁵/ml, and then treated with celecoxib at various concentrations for 24 h. The JC-1 stain were added into cell culture and incubated for 20 min in a CO2 incubator, according to the manufacturer’s instructions. Fluorescence microscope was used to observe changes of green fluorescence.
mRFP-GFP-LC3 puncta assay
After cells were transfected with mRFP-GFP-LC3, autophagosome formation and maturation to autolysosomes were used to examine autophagy. Green and red fluorescence indicates phagophore and autolysosome, respectively. Yellow fluorescence, which represented co-localization of RFP fluorescence with GFP indicates autophagosome, reflecting the autophagic activity [Citation52,Citation53]. Cells were stably transfected with mRFP-GFP-LC3 lentivirus and then were treated with or without 120 µM celecoxib for 24 h. Image acquisition was performed using a confocal microscope.
Plasmids and lentiviral production as well as transduction
Two short hairpin RNAs (shRNAs) were synthesized (Invitrogen) to suppress the expression of Atg5. Lentivirus were produced by co-transfecting pLKO-based gene-knockdown lentiviral vectors or shRNA plasmids and lentiviral packaging plasmids pCMV-dR8.91 and pMD2.G into 293T cells using the transfection reagent (QIAGEN) as per the manufacturer’s instructions. Supernatant containing virus was collected after 48 h transfection. 143B and U2OS cells were infected with collected virus containing polybrene (10 g/ml), followed by selection with puromycin.
Western blot
Cells were lysed with ice-cold RIPA containing a protease and a phosphatase inhibitor cocktail for 30 min on ice. Proteins were separated by SDS-PAGE and transferred to PVDF membranes at 100 V for 90 min. The blots were blocked with 5% milk for 1 h at room temperature, followed by incubation with primary antibodies overnight at 4°C. Then, the blots were incubated with secondary antibodies for 1h at room temperature and were visualized using the enhanced chemiluminescence detection kit (Milipore Corporation, USA).
Immunohistochemistry
Tissue paraffin sections of mice tumors were deparaffinized in xylene and rehydrated, followed by heat-mediated antigen retrieval. Slides were blocked and then incubated with primary antibody at 4°C overnight. The primary antibodies against mouse-Ki-67 (Abcam), PCNA (Abcam) and cleaved-caspase3 (Cell Signaling Technology) were used to perform IHC analysis of mouse tumor samples. After washing three times in 1×PBS, slides were treated with biotinylated IgG secondary antibodies, followed by detection with DAB substrate kit (Boster Biological Technology co.ltd, USA). Images were acquired using a microscope (Nikon, Japan).
Animal experiments
Five-week-old of male BALB/c nude mice was used in animal experiments with a total of twenty mice. Approximately 2 × 10⁶ 143B cells were implanted subcutaneously into the right flank. Once tumors reached approximately 100 mm3, mice were orally administered with PBS, 100 mg/kg celecoxib every 2 d. The size of tumor was measured twice a week and average tumor volume was calculated using the equation: volume = (L × W2)/2. Mice were killed when subcutaneous implanted tumor were observed for four weeks. Subcutaneous tumor was obtained to perform the histological analysis using Immunohistochemistry analysis.
Statistical analysis
Statistical analysis was performed using GraphPad Prism software. Student’s t-test and one-way ANOVA were used for calculating the significance between different groups. All data were expressed as mean ± S.D. of three independent experiments and p < 0.05 was indicated Statistical significance.
Supplemental Material
Download MS Word (244.9 KB)Disclosure statement
The authors declare no conflict of interest.
Supplemental material
Supplemental data for this article can be accessed here.
Additional information
Funding
Related Research Data
References
- Isakoff MS, Bielack SS, Meltzer P, Gorlick R. Osteosarcoma: current treatment and a collaborative pathway to success. J Clinic Oncol Off J Am Soc Clin Oncol. 2015;33:3029–3035.
- Lagmay JP, Krailo MD, Dang H, Kim A, Hawkins DS, Beaty O 3rd, Widemann BC, Zwerdling T, Bomgaars L, Langevin AM, et al. Outcome of patients with recurrent osteosarcoma enrolled in seven phase II trials through children’s cancer group, pediatric oncology group, and children’s oncology group: learning from the past to move forward. J Clinic Oncol Off J Am Soc Clin Oncol. 2016;34:3031–3038.
- Kleinerman E. Maximum benefit of chemotherapy for osteosarcoma achieved-what are the next steps? Lancet Oncol. 2016;17:1340–1342.
- Mo H, He J, Yuan Z, Mo L, Wu Z, Lin X, Liu B, Guan J. WT1 is involved in the Akt-JNK pathway dependent autophagy through directly regulating Gas1 expression in human osteosarcoma cells. Biochem Biophys Res Commun. 2016;478:74–80.
- Nataraj V, Batra A, Rastogi S, Khan SA, Sharma MC, Vishnubhatla S, Bakhshi S. Developing a prognostic model for patients with localized osteosarcoma treated with uniform chemotherapy protocol without high dose methotrexate: a single-center experience of 237 patients. J Surg Oncol. 2015;112:662–668.
- Xue X, Shah YM. Hypoxia-inducible factor-2alpha is essential in activating the COX2/mPGES-1/PGE2 signaling axis in colon cancer. Carcinogenesis. 2013;34:163–169.
- Schumacher Y, Aparicio T, Ourabah S, Baraille F, Martin A, Wind P, Dentin R, Postic C, Guilmeau S. Dysregulated CRTC1 activity is a novel component of PGE2 signaling that contributes to colon cancer growth. Oncogene. 2016;35:2602–2614.
- Liu B, Qu L, Yan S. Cyclooxygenase-2 promotes tumor growth and suppresses tumor immunity. Cancer Cell Int. 2015;15:106.
- Gandhi J, Khera L, Gaur N, Paul C, Kaul R. Role of modulator of inflammation cyclooxygenase-2 in gammaherpesvirus mediated tumorigenesis. Front Microbiol. 2017;8:538.
- McGettigan P, Olsen AS. NSAIDs for high-risk patients: none, celecoxib, or naproxen? Lancet. 2017;389:2351–2352.
- Wang G, Li J, Zhang L, Huang S, Zhao X, Zhao X. Celecoxib induced apoptosis against different breast cancer cell lines by down-regulated NF-kappaB pathway. Biochem Biophys Res Commun. 2017;490:969–976.
- Edelman MJ, Wang X, Hodgson L, Cheney RT, Baggstrom MQ, Thomas SP, Gajra A, Bertino E, Reckamp KL, Molina J, et al. Phase III randomized, placebo-controlled, double-blind trial of celecoxib in addition to standard chemotherapy for advanced non-small-cell lung cancer with cyclooxygenase-2 overexpression: CALGB 30801 (Alliance). J Clinic Oncol Off J Am Soc Clin Oncol. 2017;35:2184–2192.
- Brizzolara A, Benelli R, Vene R, Barboro P, Poggi A, Tosetti F, Ferrari N. The ErbB family and androgen receptor signaling are targets of Celecoxib in prostate cancer. Cancer Lett. 2017;400:9–17.
- Malka D, Pacault V, De Baere T, Ducreux M, Boige V. Antitumoral effect of celecoxib in hepatocellular carcinoma. J Clinic Oncol Off J Am Soc Clin Oncol. 2005;23:4805–4806.
- Minina EA, Bozhkov PV, Hofius D. Autophagy as initiator or executioner of cell death. Trends Plant Sci. 2014;19:692–697.
- Zheng HC. The molecular mechanisms of chemoresistance in cancers. Oncotarget. 2017;35:59950–59964.
- Apel A, Zentgraf H, Buchler MW, Herr I. Autophagy-A double-edged sword in oncology. Int J Cancer. 2009;125:991–995.
- Yousefi S, Simon HU. Autophagy in cancer and chemotherapy. Results Probl Cell Differ. 2009;49:183–190.
- Abedin MJ, Wang D, McDonnell MA, Lehmann U, Kelekar A. Autophagy delays apoptotic death in breast cancer cells following DNA damage. Cell Death Differ. 2007;14:500–510.
- Levy JM, Thompson JC, Griesinger AM, Amani V, Donson AM, Birks DK, Morgan MJ, Mirsky DM, Handler MH, Foreman NK, et al. Autophagy inhibition improves chemosensitivity in BRAF(V600E) brain tumors. Cancer Discov. 2014;4:773–780.
- Shi CS, Shenderov K, Huang NN, Kabat J, Abu-Asab M, Fitzgerald KA, Sher A, Kehrl JH. Activation of autophagy by inflammatory signals limits IL-1beta production by targeting ubiquitinated inflammasomes for destruction. Nat Immunol. 2012;13:255–263.
- Janku F, McConkey DJ, Hong DS, Kurzrock R. Autophagy as a target for anticancer therapy. Nat Rev Clin Oncol. 2011;8:528–539.
- Zhang X, Zeng X, Liang X, Yang Y, Li X, Chen H, Huang L, Mei L, Feng SS. The chemotherapeutic potential of PEG-b-PLGA copolymer micelles that combine chloroquine as autophagy inhibitor and docetaxel as an anti-cancer drug. Biomaterials. 2014;35:9144–9154.
- Yang ZJ, Chee CE, Huang S, Sinicrope F. Autophagy modulation for cancer therapy. Cancer Biol Ther. 2011;11:169–176.
- Maycotte P, Aryal S, Cummings CT, Thorburn J, Morgan MJ, Thorburn A. Chloroquine sensitizes breast cancer cells to chemotherapy independent of autophagy. Autophagy. 2012;8:200–212.
- Maclean KH, Dorsey FC, Cleveland JL, Kastan MB. Targeting lysosomal degradation induces p53-dependent cell death and prevents cancer in mouse models of lymphomagenesis. J Clin Invest. 2008;118:79–88.
- Yang ZJ, Chee CE, Huang S, Sinicrope FA. The role of autophagy in cancer: therapeutic implications. Mol Cancer Ther. 2011;10:1533–1541.
- McAfee Q, Zhang Z, Samanta A, Levi SM, Ma XH, Piao S, Lynch JP, Uehara T, Sepulveda AR, Davis LE, et al. Autophagy inhibitor Lys05 has single-agent antitumor activity and reproduces the phenotype of a genetic autophagy deficiency. Proc Natl Acad Sci USA. 2012;109:8253–8258.
- Shi TT, Yu XX, Yan LJ, Xiao HT. Research progress of hydroxychloroquine and autophagy inhibitors on cancer. Cancer Chemother Pharmacol. 2017;79:287–294.
- Huang J, Ni J, Liu K, Yu Y, Xie M, Kang R, Vernon P, Cao L, Tang D. HMGB1 promotes drug resistance in osteosarcoma. Cancer Res. 2012;72:230–238.
- Liu K, Ren T, Huang Y, Sun K, Bao X, Wang S, Zheng B, Guo W. Apatinib promotes autophagy and apoptosis through VEGFR2/STAT3/BCL-2 signaling in osteosarcoma. Cell Death Dis. 2017;8:e3015.
- Kondo Y, Kanzawa T, Sawaya R, Kondo S. The role of autophagy in cancer development and response to therapy. Nat Rev Cancer. 2005;5:726–734.
- Levine B. Unraveling the role of autophagy in cancer. Autophagy. 2006;2:65–66.
- Gillissen B, Essmann F, Hemmati PG, Richter A, Richter A, Oztop I, Chinnadurai G, Dorken B, Daniel PT. Mcl-1 determines the Bax dependency of Nbk/Bik-induced apoptosis. J Cell Biol. 2007;179:701–715.
- Scarlatti F, Maffei R, Beau I, Codogno P, Ghidoni R. Role of non-canonical Beclin 1-independent autophagy in cell death induced by resveratrol in human breast cancer cells. Cell Death Differ. 2008;15:1318–1329.
- Wang H, Zhang T, Sun W, Wang Z, Zuo D, Zhou Z, Li S, Xu J, Yin F, Hua Y, et al. Erianin induces G2/M-phase arrest, apoptosis, and autophagy via the ROS/JNK signaling pathway in human osteosarcoma cells in vitro and in vivo. Cell Death Dis. 2016;7:e2247.
- Zhou X, Shi X, Ren K, Fan GT, Wu SJ, Zhao JN. Celecoxib inhibits cell growth and modulates the expression of matrix metalloproteinases in human osteosarcoma MG-63 cell line. Eur Rev Med Pharmacol Sci. 2015;19:4087–4097.
- Swamy MV, Herzog CR, Rao CV. Inhibition of COX-2 in colon cancer cell lines by celecoxib increases the nuclear localization of active p53. Cancer Res. 2003;63:5239–5242.
- Maier TJ, Schilling K, Schmidt R, Geisslinger G, Grosch S. Cyclooxygenase-2 (COX-2)-dependent and -independent anticarcinogenic effects of celecoxib in human colon carcinoma cells. Biochem Pharmacol. 2004;67:1469–1478.
- Grosch S, Tegeder I, Niederberger E, Brautigam L, Geisslinger G. COX-2 independent induction of cell cycle arrest and apoptosis in colon cancer cells by the selective COX-2 inhibitor celecoxib. FASEB J. 2001;15:2742–2744.
- Vosooghi M, Amini M. The discovery and development of cyclooxygenase-2 inhibitors as potential anticancer therapies. Expert Opin Drug Discov. 2014;9:255–267.
- Kulp SK, Yang YT, Hung CC, Chen KF, Lai JP, Tseng PH, Fowble JW, Ward PJ, Chen CS. 3-phosphoinositide-dependent protein kinase-1/Akt signaling represents a major cyclooxygenase-2-independent target for celecoxib in prostate cancer cells. Cancer Res. 2004;64:1444–1451.
- Arico S, Pattingre S, Bauvy C, Gane P, Barbat A, Codogno P, Ogier-Denis E. Celecoxib induces apoptosis by inhibiting 3-phosphoinositide-dependent protein kinase-1 activity in the human colon cancer HT-29 cell line. J Biol Chem. 2002;277:27613–27621.
- Ghosh N, Chaki R, Mandal V, Mandal SC. COX-2 as a target for cancer chemotherapy. Pharmacol Rep. 2010;62:233–244.
- Cha BK, Kim YS, Hwang KE, Cho KH, Oh SH, Kim BR, Jun HY, Yoon KH, Jeong ET, Kim HR. Celecoxib and sulindac inhibit TGF-beta1-induced epithelial-mesenchymal transition and suppress lung cancer migration and invasion via downregulation of sirtuin 1. Oncotarget. 2016;7:57213–57227.
- Mizushima N, Levine B, Cuervo AM, Klionsky DJ. Autophagy fights disease through cellular self-digestion. Nature. 2008;451:1069–1075.
- Mizushima N, Komatsu M. Autophagy: renovation of cells and tissues. Cell. 2011;147:728–741.
- Klionsky DJ. The molecular machinery of autophagy: unanswered questions. J Cell Sci. 2005;118:7–18.
- Sui X, Chen R, Wang Z, Huang Z, Kong N, Zhang M, Han W, Lou F, Yang J, Zhang Q, et al. Autophagy and chemotherapy resistance: a promising therapeutic target for cancer treatment. Cell Death Dis. 2013;4:e838.
- Wolf R, Wolf D, Ruocco V. Antimalarials: unapproved uses or indications. Clin Dermatol. 2000;18:17–35.
- DeVorkin L, Hattersley M, Kim P, Ries J, Spowart J, Anglesio MS, Levi SM, Huntsman DG, Amaravadi RK, Winkler JD, et al. Autophagy inhibition enhances sunitinib efficacy in clear cell ovarian carcinoma. Mol Cancer Res. 2017;15:250–258.
- Li L, Wang ZV, Hill JA, Lin F. New autophagy reporter mice reveal dynamics of proximal tubular autophagy. J Am Soc Nephrol. 2014;25:305–315.
- Kimura S, Noda T, Yoshimori T. Dissection of the autophagosome maturation process by a novel reporter protein, tandem fluorescent-tagged LC3. Autophagy. 2007;3:452–460.