
ABSTRACT
In an attempt to explore the early developmental arrest in embryos from polycystic ovarian syndrome (PCOS) patients, we sequenced the transcriptome profiles of PCOS arrested 2-cell embryos, non-PCOS arrested 2-cell embryos and non-arrested 2-cell embryos using single-cell RNA-Seq technique. Differential expression analysis was performed using the DEGSeq R package. Gene Ontology (GO) enrichment was analyzed using the GOseq R package. Data revealed 62 differentially expressed genes between non-PCOS arrested and PCOS arrested embryos and 2217 differentially expressed genes between PCOS arrested and non-arrested 2-cell embryos. A total of 49 differently expressed genes (DEGs) were annotated with GO terms in the up-regulated genes between PCOS arrested and non-PCOS arrested embryos after GO enrichment. A total of 29 DEGs were annotated with GO terms in the down-regulated genes between PCOS arrested and non-arrested 2-cell embryos after GO enrichment. These data can provide a reference for screening specific genes involved in the arrest of PCOS embryos.
KEYWORDS:
Introduction
Despite the use of in vitro fertilization (IVF) as an assisted reproductive technology for over 30 years, early developmental failure of embryos occurs with a high frequency. More than 50% of IVF embryos do not reach the blastocyst stage of development. After transfer, some embryos are unable to sustain development. Although culture conditions have significantly improved over the years, 10–15% of embryos enter a permanent state of cell cycle arrest, and 40% of patients have at least one arrested embryo per cycle [Citation1].
Polycystic ovarian syndrome (PCOS) is the most common metabolic dysfunction and heterogeneous endocrine disorder in women of reproductive age. This condition is characterized by oligo-ovulation or anovulation, hyperandrogenism and multicystic ovaries [Citation2]. A community-based epidemiological study has shown that the prevalence of PCOS in Chinese women of reproductive age is about 5.6% [Citation3]. Although the number of retrieved oocytes increases during IVF treatment, those of PCOS patients often have lower cleavage rates [Citation4]. In a murine PCOS model induced by dehydroepiandrosterone (DHEA), embryo developmental competence was decreased compared with that of control mice [Citation5]. The underlying mechanism of embryo arrest in PCOS patients remains unclear. To explore this issue, we sequenced the transcriptome profiles of PCOS arrested embryos using the single-cell RNA-Seq technique.
Results
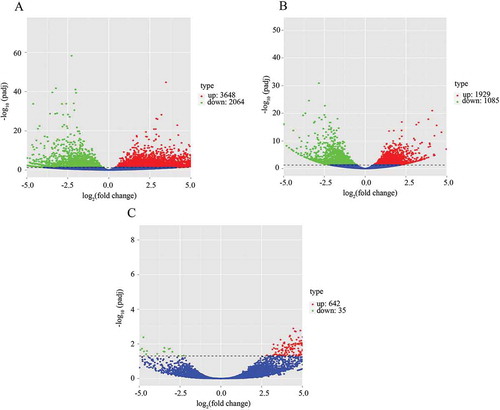
The total transcriptomes were extracted and amplified. The Illumina HiSeq platform was used to sequence the RNA transcriptomes. Clean data were obtained from the non-arrested 2-cell embryo, non-PCOS arrested embryo and PCOS arrested embryo (10.55 Gb, 9.08 GB and 15.32 Gb, respectively) (). Differential expression analysis was performed using the DESeq R package (1.18.0). P-values were adjusted using the Benjamini and Hochberg method for controlling the false discovery rate. Genes with adjusted P < 0.05 were assigned as differentially expressed. Relative to gene expression in the non-arrested 2-cell embryo, 3648 genes were up-regulated and 2064 genes were down-regulated in the non-PCOS arrested embryo ()), and 1929 genes were up-regulated and 1805 genes were down-regulated in the PCOS arrested embryo ()). In addition, gene expression differences were analysed between the non-PCOS and PCOS arrested embryos. Relative to gene expression in the PCOS arrested 2-cell embryo, 642 genes were up-regulated and 35 genes were down-regulated in the non-PCOS arrested embryo ()). Details regarding gene expression in each group are shown in Supplementary Datasets 1–6.
Table 1. Summary of the sequence assembly after Illumina sequencing.
Figure 1. Count of differentially expressed genes between non-PCOS arrested and non-arrested 2-cell embryos (a), PCOS arrested and non-arrested 2-cell embryos (b) and between non-PCOS and PCOS arrested embryos (c). The x-axis shows the fold-change in gene expression, and the y-axis shows significant statistical differences. Red, up-regulated genes; green, down-regulated genes.
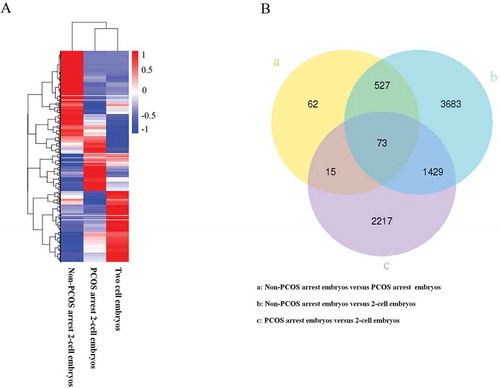
The DEGSeq R package (1.18.0) was used to determine the differentially expressed genes between groups using the sequenced libraries. The hierarchical clustering of all differentially expressed genes was performed as shown in ). There were 62 differentially expressed genes (DEGs) between non-PCOS and PCOS arrested embryos, 3683 DEGs between non-PCOS arrested and non-arrested 2-cell embryos and 2217 DEGs between PCOS arrested and non-arrested 2-cell embryos ()). Details regarding gene expression in each group are shown in Supplementary Dataset 7.
Figure 2. Cluster analysis of DEGs. A, hierarchical cluster analysis of DEGs of PCOS, non-PCOS arrested and non-arrested 2-cell embryos; B, Venn diagram showing the overlaps between groups. Red, high gene expression levels; blue, low gene expression levels.
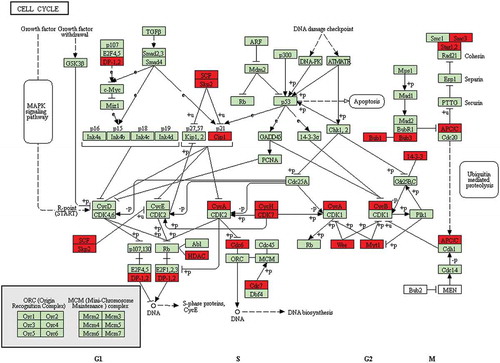
To further analyze differential gene expression in these embryos, GO enrichment analysis was performed using the GOseq R package and five representative GO terms in representive biological process were showed in . Functional annotation of DEGs in the down-regulated genes between PCOS arrested and non-arrested 2-cell embryos is shown in and functional annotation of DEGs in the up-regulated genes between PCOS and non-PCOS arrested embryos is shown in . The enrichment of differentially expressed genes in the KEGG pathways was analysed using KOBAS software. The terms systemic lupus erythematosus, transcriptional misregulation in cancer, spliceosome and alcoholism were significantly enriched in up-regulated genes between PCOS and non-PCOS arrested embryos (P < 0.05, )). The terms ribosome, RNA transport, ubiquitin-mediated proteolysis, Huntington’s disease, Parkinson’s disease, cell cycle, oxidative phosphorylation, metabolic pathways, legionellosis and Alzheimer’s disease were significantly enriched in down-regulated genes between PCOS arrested and 2-cell embryos (P < 0.05, )). The representative cell cycle pathway differed significantly between PCOS arrested and non-arrested 2-cell embryos was shown in .
Table 2. Functional annotation of DEGs in the down-regulated genes between PCOS arrested and 2-cell embryo.
Table 3. Functional annotation of DEGs in the up-regulated genes between PCOS and non-PCOS arrested embryo.
Figure 3. GO enrichment in biological process analysis of DEGs. The x-axis shows −log10 (pvalue), and the y-axis shows the five representative GO terms in biological process. A, down-regulated genes between non-PCOS arrested and non-arrested 2-cell embryos; B, up-regulated genes between non-PCOS arrested and non-arrested 2-cell embryos; C, down-regulated genes between non-PCOS and PCOS arrested embryos; D, up-regulated genes between non-PCOS and PCOS arrested embryos; E, down-regulated genes between PCOS arrested and non-arrested 2-cell embryos; F, up-regulated genes between PCOS arrested and non-arrested 2-cell embryos.
Figure 4. KEGG enrichment analyses of DEGs. The ratio of the number of DEGs to the total gene number is represented by the enrichment factor. Size of dots: gene number; colour of dots: range of P-values. A, representative terms between non-PCOS arrested and non-arrested 2-cell embryos in down-regulated genes; B, representative terms between non-PCOS arrested and non-arrested 2-cell embryos in up-regulated genes; C, representative terms between non-PCOS and PCOS arrested embryos in down-regulated genes; D, representative terms between non-PCOS and PCOS arrested embryos in up-regulated genes; E, representative terms between PCOS arrested and non-arrested 2-cell embryos in down-regulated genes; F, representative terms between PCOS arrested and non-arrested 2-cell embryos in up-regulated genes.
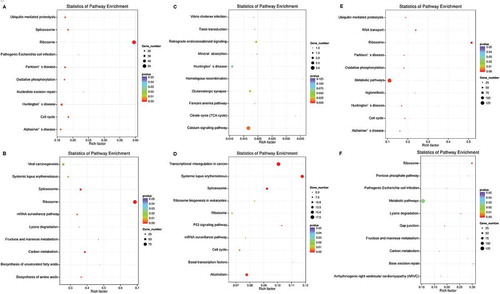
Figure 5. Representative cell cycle pathway between PCOS arrested and non-arrested 2-cell embryos. Red, down-regulated gene names.
To validate the transcripts, the relative mRNA levels of 5 genes involved in mitochondria and the cell cycle were analysed by QPCR. As shown in , these genes were significantly down-regulated in PCOS arrested embryos compared with non-arrested 2-cell embryos, which is consistent with the transcript data.
Figure 6. Relative expression of 5 selected genes by Q-PCR. The relative gene expression levels were calculating using the 2−ΔΔCt method. R.Q., relative expression; *P < 0.05 indicates that the genes were significantly down-regulated in PCOS and non-PCOS arrested embryos relative to the non-arrested 2-cell embryo.
Discussion
In the present study, we used single-cell transcriptome sequencing to profile gene expression of a PCOS arrested embryo. The results indicate that 1929 genes were up-regulated and 1805 genes were down-regulated in the PCOS arrested embryo relative to that of the non-arrested 2-cell embryo.
It is well known that developmental arrest was involved in permanent cell-cycle arrest at the 2–4 cell stage [Citation1]. After fertilization, the zygote develops into a 16-cell morula by undergoing multiple cell doublings. Embryonic genome activation (EGA) plays an important role in the success of preimplantation embryo development [Citation6]. The quality of the oocyte is essential for early embryo development. The early stages of embryo development are driven by the maternal genome. Maternal RNA transcripts influence early embryo developmental kinetics until EGA. The altered gene expression profile was found in human PCOS cumulus cells of MII mature oocytes [Citation7]. Therefore, it is possible that PCOS embryos may have a reduced capacity to complete earlier stages of development because of the abnormality of RNA transcriptome.
During the embryo preimplantation stage, the major role of mitochondria is ATP production through oxidative phosphorylation. Gradually, as the embryo grows from 1 cell to a blastocyst, oxygen consumption increases to support cellular biosynthetic activities, plasma membrane production and morphodynamic processes [Citation8]. Mitochondria are inherited entirely maternally and do not replicate until after implantation. Mitochondrial structural abnormalities in the oocyte have adverse effects on embryo competence because metabolic activity and ATP production are decreased [Citation9].
It had been reported that oocytes of PCOS patients had a higher NADPH content, glucose and pyruvate consumption than control oocytes [Citation10], which could indicate elevated reactive oxygen species (ROS) production in PCOS oocytes. The level of intracellular ROS was elevated and the frequency of embryo arrest was higher in embryos cultured in 20% oxygen conditions than in those cultured in 5% oxygen conditions [Citation11]. Our previous data have shown that oocytes from PCOS mice have lower mtDNA copy numbers, ATP content and inner mitochondrial membrane potential compared with control mice [Citation5]. Jia L et al. found that PCOS in gilts results in hypermethylation of mitochondrial DNA, lower DNA copy number and oocyte malfunction [Citation12]. Development of the preimplantation embryo is a dynamic process requiring energy to fuel mitosis. Mitochondrial ATP generation affects the ATP supply/demand balance in the cytoplasm [Citation13]. An imbalance between ATP supply and demand leads to the arrest of cell division by inducing cell cycle arrest. Therefore, the slower development in early embryos from PCOS women might in part relate to mitochondrial dysfunction in their oocytes. In this study, our results also had showed that genes involved in the oxidative phosphorylation pathway were significantly down-regulated in the PCOS arrested embryos.
The gene ontology and pathway analysis in our results supplied the consistent data that the cellular biosynthetic process and metabolic process were down-regulated and lipopolysaccharide biosynthetic process and glutamate catabolic process were up-regulated in PCOS arrested group than control embryos. Wissing ML et al. examined embryos cleavage kinetics by time-lapse system and found that embryos of PCOS patients took longer to reach the four cell stage than control embryos [Citation14]. The arrested 2-cell embryos were obtained in the present study on Days 3, a long time period with little possibility because of developmental delay. However, it is limit that only embryos from IVF patient were dissected in the present study. The normal pattern of embryonic gene expression of embryos in non-IVF patients need further research in the future.
Altogether, in the present study we identified more than 3000 genes and transcripts that differed between the PCOS arrested embryo and the non-arrested 2-cell embryo. These data provide a reference for screening specific genes involved in PCOS embryo arrest. More research is needed to explore the mechanism underlying the arrest of PCOS embryos.
Methods
Embryo collection
This study was approved by the Ethics Committee of Peking University Third Hospital. Informed consent confirmed that the couple donors were voluntarily donating embryos for research on the arrest mechanism of PCOS embryos, with no monetary payment (No. 2008013). All methods used in the present study were performed in accordance with the relevant guidelines and regulations.
IVF and intracytoplasmic sperm injection were performed according to routine laboratory insemination procedures on the day of oocyte retrieval (Day 0). The presence of two pronuclei was observed 16–18 h after insemination or injection, and the zygotes were then cultured in 25 µL of pre-equilibrated cleavage medium. The embryos were cultured in incubators at 37°C under 5% or 6% CO2. Embryo morphology was evaluated 68–72 h (Day 3) after insemination. The embryos with less than 4 cells were named arrested embryos. In the present study, PCOS arrested embryos and non-PCOS arrested embryos were two-cell embryos on Day 3 with less than 10% fragmentation and no multinucleation. The average maternal age was 30 years and all had tubal factor infertility.
Preparation of single-cell cDNAs
The single-cell RNA-Seq method was used as described previously [Citation15,Citation16]. Briefly, every single embryos were transferred into lysate buffer by mouth pipette and a reverse transcription reaction was performed on the whole-cell lysate. We use terminal deoxynucleotidyl transferase to add a poly (A) tail to the 3ʹ end of the first-strand cDNA, and then perform 20 + 10 cycles of PCR to amplify the single-cell cDNA.
RNA-Seq library preparation
After the generation of cDNA from a single cell, 200 ng of cDNA was sheared into 150- to 350-bp fragments by Covaris S2, and a TrueSeq DNA library preparation kit (Illumina) was used to prepare a sequencing library following the manufacturer’s suggested procedures. The fragmented cDNA was end-repaired, dA-tailed, adaptor ligated and then subjected to 10–12 cycles of PCR amplification. The PCR products were purified (AMPure XP system; Beckman Coulter, Brea, CA, USA), and the library quality was assessed using the Agilent Bioanalyzer 2100 system (Agilent Technologies, Santa Clara, CA, USA).
Clustering and sequencing
Clustering of index-coded samples was performed on a cBot Cluster Generation System using TruSeq PE Cluster Kit v3-cBot-HS (Illumina, San Diego, CA, USA) according to the manufacturer’s instructions. After cluster generation, the library preparations were sequenced on an Illumina Hiseq platform. We obtained 30–80 million 150-bp reads for each individual embryo.
Data analysis
Differential expression analysis of the two groups was performed using the DEGSeq R package (1.18.0). DEGSeq analysis provides statistical routines for determining differential gene expression using a model based on the negative binomial distribution. The P-values were adjusted using the Benjamini and Hochberg method for controlling the false discovery rate. Genes with adjusted P < 0.05 were assigned as differentially expressed.
Gene Ontology (GO) enrichment analysis was performed using the GOseq R package with correction for gene length bias. GO terms with corrected P < 0.05 were considered significantly enriched by differentially expressed genes. The enrichment of differentially expressed genes in KEGG pathways was analysed using KOBAS software. The data for non-arrested 2-cell embryos was acquired from our previous study [Citation16].
Quantitative real-time PCR
Quantitative real-time PCR (QPCR) was performed using an ABI model 7700 real-time PCR system (ABI). Each group including three different sequenced samples and were analyzed for each gene, and RPS24 was used as the internal control gene. The expression level was evaluated by ∆∆Ct method. The primers are listed in Supplementary Datasets 8.
Author contributions
Conceived and designed the study: SLL, HBC and CLL; coordinated embryo collection: SLL, YPW, HBC and LNW; analysed the data: SLL, CLL, SH, LLY, XF, PL and JQ; wrote the manuscript: SLL; all authors interpreted the data.
Ethics approval and consent to participate
The study was approved by the Ethics Committee of Peking University Third Hospital (No. 2008013).
Supplemental Material
Download Zip (1 MB)Disclosure statement
No potential conflict of interest was reported by the authors.
Supplementary material
Supplemental data for this article can be accessed here.
Additional information
Funding
Related Research Data
References
- Betts DH, Madan P. Permanent embryo arrest: molecular and cellular concepts. Mol Hum Reprod. 2008;14:445–453.
- Li R, Yu G, Yang D, et al. Prevalence and predictors of metabolic abnormalities in Chinese women with PCOS: a cross- sectional study. BMC Endocr Disord. 2014;14:76.
- Li R, Zhang Q, Yang D, et al. Prevalence of polycystic ovary syndrome in women in China: a large community-based study. Hum Reprod. 2013;28:2562–2569.
- Qiao J, Feng HL. Extra- and intra-ovarian factors in polycystic ovary syndrome: impact on oocyte maturation and embryo developmental competence. Hum Reprod Update. 2011;17:17–33.
- Huang Y, Yu Y, Gao J, et al. Impaired oocyte quality induced by dehydroepiandrosterone is partially rescued by metformin treatment. PloS One. 2015;10:e0122370.
- Harrison MM, Eisen MB. Transcriptional activation of the zygotic genome in drosophila. Curr Top Dev Biol. 2015;113:85–112.
- Haouzi D, Assou S, Monzo C, et al. Altered gene expression profile in cumulus cells of mature MII oocytes from patients with polycystic ovary syndrome. Hum Reprod. 2012;27:3523–3530.
- Trimarchi JR, Liu L, Porterfield DM, et al. Oxidative phosphorylation-dependent and -independent oxygen consumption by individual preimplantation mouse embryos. Biol Reprod. 2000;62:1866–1874.
- Meldrum DR, Casper RF, Diez-Juan A, et al. Aging and the environment affect gamete and embryo potential: can we intervene? Fertil Steril. 2016;105:548–559.
- Harris SE, Maruthini D, Tang T, et al. Metabolism and karyotype analysis of oocytes from patients with polycystic ovary syndrome. Hum Reprod. 2010;25:2305–2315.
- Peng H, Shi W, Zhang W, et al. Better quality and more usable embryos obtained on day 3 cultured in 5% than 20% oxygen: a controlled and randomized study using the sibling oocytes. Reprod Sci. 2016;23:372–378.
- Jia L, Li J, He B, et al. Abnormally activated one-carbon metabolic pathway is associated with mtDNA hypermethylation and mitochondrial malfunction in the oocytes of polycystic gilt ovaries. Sci Rep. 2016;6:19436.
- Ramalho-Santos J, Varum S, Amaral S, et al. Mitochondrial functionality in reproduction: from gonads and gametes to embryos and embryonic stem cells. Hum Reprod Update. 2009;15:553–572.
- Wissing ML, Bjerge MR, Olesen AI, et al. Impact of PCOS on early embryo cleavage kinetics. Reprod Biomed Online. 2014;28:508–514.
- Tang F, Barbacioru C, Wang Y, et al. mRNA-Seq whole-transcriptome analysis of a single cell. Nat Methods. 2009;6:377–382.
- Yan L, Yang M, Guo H, et al. Single-cell RNA-Seq profiling of human preimplantation embryos and embryonic stem cells. Nat Struct Mol Biol. 2013;20:1131–1139.