
ABSTRACT
Glioblastoma multiforme (GBM) is the most common and aggressive brain tumor and refractory to existing therapies. The oncogene BMI-1, a member of Polycomb Repressive Complex 1 (PRC1) plays essential roles in various human cancers and becomes an attractive therapeutic target. Here we showed that BMI-1 is highly expressed in GBM and especially enriched in glioblastoma stem cells (GSCs). Then we comprehensively investigated the anti-GBM effects of PTC-209, a novel specific inhibitor of BMI-1. We found that PTC-209 efficiently downregulates BMI-1 expression and the histone H2AK119ub1 levels at microM concentrations. In vitro, PTC-209 effectively inhibits glioblastoma cell proliferation and migration, and GSC self-renewal. Transcriptomic analyses of TCGA datasets of glioblastoma and PTC-209-treated GBM cells demonstrate that PTC-209 reverses the altered transcriptional program associated with BMI-1 overexpression. And Chromatin Immunoprecipitation assay confirms that the derepressed tumor suppressor genes belong to BMI-1 targets and the enrichment levels of H2AK119ub1 at their promoters is decreased upon PTC-209 treatment. Strikingly, the glioblastoma growth is significantly attenuated by PTC-209 in a murine orthotopic xenograft model. Therefore our study provides proof-of-concept for inhibitors targeting BMI-1 in potential applications as an anti-GBM therapy.
KEYWORDS:
Introduction
Glioblastoma multiforme (GBM) is the most common and lethal intracranial tumor. The overall survival of GBM patients remains unimproved despite of advances in combination treatments of radiation and chemotherapy with temozolomide (TMZ) following surgical resection of the tumor. The heterogeneity is one of the main factors that contribute to the chemo- and radio-resistance [Citation1,Citation2]. Growing research suggests that a minor population of tumor cells, known as cancer stem cells (CSCs) or tumor-initiating cells (TICs), possess stem cell-like features and evade regular therapy and immune suppression [Citation3,Citation4]. It is well recognized that CSCs including glioblastoma stem cells (GSCs) are generally responsible for the aggressiveness and tumor relapse after chemo- and/or radiotherapy [Citation5–Citation7]. Eliminating CSCs has been proven to improve the outcome in many tumor models including brain tumors [Citation8,Citation9]. Therefore it is of huge interest to identify key factors to maintain GSC properties.
Polycomb group (PcG) genes play vital roles in the control of cell identity. Their mutations or deregulated expression have been tightly linked to cancer development. PcG proteins generally maintain transcriptional repression by forming multi-subunit chromatin-modifying complexes. Two main complexes, namely Polycomb repressive complex 2 (PRC2) and PRC1, have been described. PRC2 methylates histone H3 on lysine 27 (H3K27), while PRC1 monoubiquitylates histone H2A on lysine 119 (H2AK119) in addition to compacting chromatin [Citation10]. BMI-1, one of the core components of PRC1, was originally identified as an oncogenic partner in lymphomagenesis [Citation11], and was subsequently found to be overexpressed in various human tumors, including glioblastoma [Citation12,Citation13]. There is a statistically significant correlation between high frequency of BMI-1-positive tumour cells and poor prognosis of patients according to the data analysis of multiple cancer types. And BMI-1 has been shown to be highly enriched in CSCs and act as critical regulators of their self-renewal and differentiation [Citation13–Citation15]. Interestingly, multiple studies demonstrate that targeting BMI-1 using gene therapy overcomes the chemo-resistance of tumor cells [Citation16,Citation17], and BMI-1 knockdown prevents brain tumor formation in mice [Citation13].
Recently a small-molecule BMI-1 inhibitor called PTC-209 was identified by high throughput screening of compounds utilizing the gene expression modulation by small-molecules (GEMS) technology [Citation18]. Its tumor-suppressive effects in several malignancies have recently been reported [Citation19,Citation20]. Here we investigated the effects of PTC-209 on GBM cells. We found that PTC-209 displays significant effects in retarding GBM cell proliferation and migration, impairing GSC self-renewal in vitro and inhibiting tumor growth in vivo. And the potential therapeutic effects in GBM cells are attributed to the derepression of a subset of BMI-1 targeted tumor suppressor genes associated with ell proliferation, tumor invasion, cell communication and signaling transduction. Therefore we provide evidences that PTC-209 could be an attractive option for the future clinical treatment of GBM patients.
Results
BMI-1 is highly expressed in glioblastoma cell lines and primary glioblastoma cells
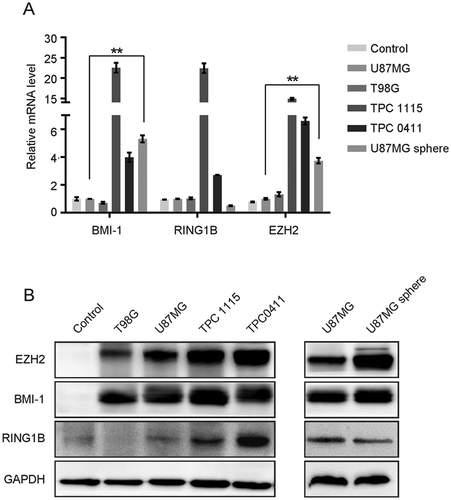
The altered expression of PcG genes has been associated with the initiation and maintenance of GBM [Citation21]. We have been interested in finding out which one could be a direct theraperutic target. First we examined the expression levels of three core PcG members in two GBM cell lines (U87MG and T98G) and two of the previously established tumor progenitor cell (TPC) lines (TPC-1115 and 0411) from surgically resected glioblastoma samples [Citation22]. Both quantitative RT-PCR (qRT-PCR) and western blot (WB) analyses show that the expression levels of BMI-1, RING1B and EZH2 are generally higher in the GBM cells than in the normal brain tissues (control) (). Notably, the monolayer-cultured GBM cell lines in serum medium contain quite a few GSCs as indicated by the percentage of CD133+ cells while the TPCs retain CSC properties when cultured in serum-free conditions (Supplementary Figure S1A and B). As shown in , BMI-1, RING1B and EZH2 are especially enriched in the TPCs maintained in serum-free conditions with EGF and bFGF. Even for the same cell line, the expression levels of BMI-1 and EZH2 expression are significantly higher when cultured as neurospheres in which GSCs are enriched ( and Supplementary Figure S1A and B). These data demonstrate that BMI-1 are overexpressed in GBMs and especially enriched in GSCs.
Figure 1. BMI-1 is upregulated in GBM cells. (A-B)The mRNA (A) and protein (B) levels of BMI-1, EZH2 and RING1B in GBM cell lines, primary cultured tumor progenitor cells (TPC) versus normal brain tissues (control) and in U87MG sphere cells versus parental adherent cells. Results in figure A are mean ± SD (n = 3; **p < 0.01)
To get insight into the expression profiling of BMI-1, we queried The Cancer Genome Atlas (TCGA) and REMBRANDT datasets of glioblastoma. Unexpectedly the mRNA levels of BMI-1 are not significantly correlated with the glioma grade or poor prognosis (data not shown). However immunohistochemical (IHC) stainings have shown that BMI-1 is highly expressed in GBM samples [Citation11]. Hence the expression of BMI-1 is likely to be regulated through posttranscriptional mechanisms as previously suggested [Citation23,Citation24].
Inhibition of BMI-1 expression by PTC-209 leads to cell cycle arrest and attenuated cell proliferation
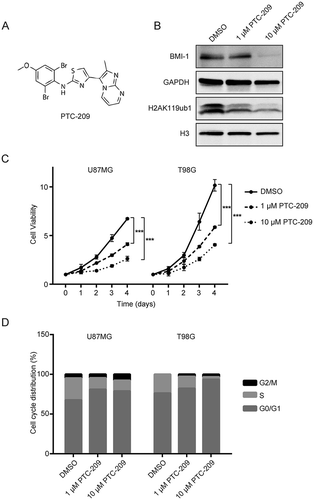
Genetically depleting BMI-1 in GBM cells has been been shown to inhibit the clonogenic potential in vitro and brain tumor formation in vivo [Citation11]. Therefore we would like to test the effects of the small-molecule BMI-1 inhibitor PTC-209 ()) on GBM cells. To determine the cytotoxicity of PTC-209 and the percentage of cell inhibition, U87MG and T98G were treated with various concentrations of PTC-209 for two days. MTS assays showed statistically significant (P < 0.001) dose-dependent inhibition by PTC-209 with IC50 value of 4.39 μM in U87MG and 10.98 μM in T98G (Supplementary Figure S2). Therefore two different concentrations (1, 10 μM) of PTC-209 were used in the following studies. As shown in ), PTC-209 treatment for 4 days in U87MG cells results in significant decrease of BMI-1 protein levels and global H2AK119ub1 levels, indicating its downregulation of PRC1 activity. The MTS assay showed that the proliferation of U87MG and T98G was significantly inhibited by PTC-209 in a dose-dependent manner ()). Then we examined the effect of PTC-209 on GBM cell cycles. U87MG and T98G cells were treated with PTC-209 for 24 h followed by cell cycle analysis. As shown in ), the cells were arrested at G0/G1 and G2/M phase at the concentration of 1 and 10 μM. These results indicated that PTC-209 displays strong anti-proliferative effects on GBM cells.
Figure 2. PTC-209 inhibits glioblastoma cell proliferation and results in cell cycle arrest. (A) Chemical structure of PTC-209. (B) Western blot analysis of U87MG cell lysates following PTC-209 (1 μM and 10 μM) or vehicle control (DMSO) treatment for 4 days. (C) Cell proliferation assay results for PTC-209 (1 μM and 10 μM) or DMSO treated U87MG and T98G cells (mean ± SD; n = 6; ***p < 0.001). (D) U87MG and T98G cells treated with PTC-209 (1 μM and 10 μM) or DMSO for 4 days were analyzed by flow cytometry-based propidium iodide staining. Graphs represent the mean of 3 independent experiments
PTC-209 inhibits GBM cell migration
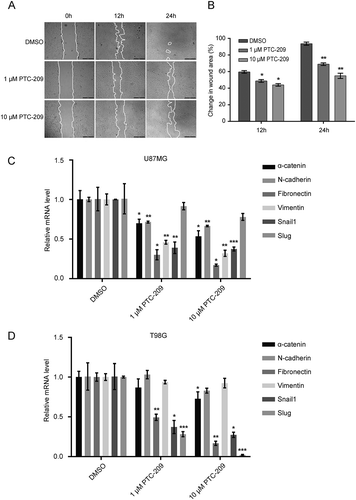
Next, we examined the influence of PTC-209 on the migratory capacity of GBM cells using scratch wound assay. After injury of tipping scratch, the U87MG and T98G cells were treated with PTC-209. Cell migration into the wound was measured according to the distance between the wound edges before and two time points after drug treatment (12 h and 24 h). We observed significantly reduced migratory potential in cells treated with PTC-209 compared to DMSO at 12 h after treatment and the anti-migratory effect was even more pronounced at 24 h ()). Accordingly, treatment with PTC-209 for 4 days in the two cell lines caused a pronounced reduction of several mesenchymal signature genes, including the mesenchymal markers: α-catenin, N-cadherin, Fibronectin and Vimentin, as well as mesenchymal-inducing transcription factors: Snail1 and Slug (also known as Snail2), despite of slight differences in two cell lines (,)). These data are consistent with the recent finding that BMI-1 acts an important regulator in response to TGFβ/BMP pathway [Citation21] and that BMI-1 is highly active in mesenchymal subtype of GBM and associated with mesenchymal gene signatures [Citation22]. Taken together, PTC-209 suppresses mesenchymal gene expression and shows anti-migratory effects on GBM cells.
Figure 3. PTC-209 inhibits glioblastoma cell migration. (A) Scratch wound healing assay was performed using U87MG cells treated with PTC-209 (1 μM and 10 μM) or DMSO. Pictures of scratch wound closure were captured at the indicated time points. Edges of scratches were highlighted manually afterwards only to illustrate cell migration. Pictures are representatives of three independent experiments. Scale bar 500 μm. (B) Unmodified pictures were analyzed by ImageJ and percentage change of wound area (i.e. wound closure) after the incubation time was calculated for 3 independent wells in parallel. PTC-209 treatment reduced the expression of genes involved in EMT. (C-D) U87MG (C) and T98G cells (D) treated with PTC-209 (1 μM and 10 μM) or DMSO for 4 days were analyzed by RT-qPCR for the mesenchymal genes (mean ± SD, n = 3; *p < 0.05; **p < 0.01; ***p < 0.001)
PTC-209 inhibits GSC self-renewal
Since the expression of BMI-1 is strikingly upregulated in GSCs (), we evaluated the effect of PTC-209 treatment on the enrichment of GSCs. Flow cytometry analysis showed that upon treatment with 1 μM or 10 μM PTC-209, the percentage of the side population (SP) cells was significantly reduced in U87MG and T98G cells ()) and the number of cells with high CD133 expression was decreased in T98G cells (,)).
Figure 4. PTC-209 inhibits the self-renewal of glioblastoma stem cells (GSCs) in vitro. (A) After treatment of with PTC-209 (1 μM and 10 μM) or DMSO for 4 days, U87MG and T98G cells were respectively incubated with Hoechst 33,342 dye and side population (SP) was determined by FACS. (B) Percentage of SP cells in U87MG and T98G adherent cells in designated groups (mean ± SD; n = 3; **p < 0.01; ***p < 0.001). (C) Following treatment with PTC-209 (1 μM and 10 μM) or DMSO for 4 days, T98G cells were stained with CD133 antibody and subjected to FACS analysis. (D) Percentage of CD133+ cells in T98G adherent cells (mean ± SD; n = 3; ***p < 0.001). (E-F) Extreme limiting dilution analysis was used to measure self-renewal capability of GICs derived from parental adhesive cells under indicated condition. The frequency of sphere-initiating cells and the log fraction nonresponding calculated by webtool at http://bioinf.wehi.edu.au/software/elda/with 95% confidence interval were shown in figure E and F, respectively. The data value with zero negative response at dose 100 is represented by a down-pointing triangle in figure F. (G) Microscopic observation of T98G sphere colonies after 2 weeks under treatment with DMSO, 1 μM PTC-209, 10 μM PTC-209 or 200 μM TMZ. Images are represented for 60 independent wells. Scale bar 100 μm
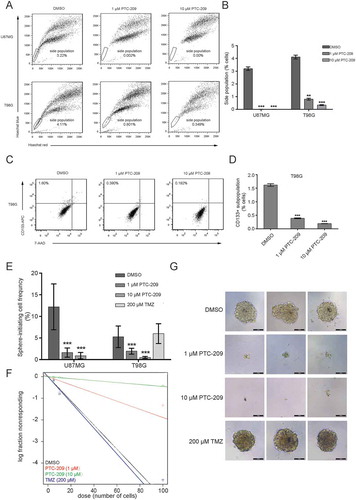
To directly determine whether PTC-209 affects GSC self-renewal, we took advantage of the widely used in vitro tumor-sphere formation assay and limiting dilution analysis (LDA) to ensure the accuracy of our measurements. As shown in –) and Supplemental Table S1, the sphere initiating cell frequency was significantly decreased in PTC-209 treated U87MG and T98G cells compared to DMSO control group. Even though few spheres were formed after PTC-209 treatment, they were much smaller than the control group ()). And the fold of frequency decrease is comparable with the analysis of the BMI-1-depleted (sh-BMI-1) U87MG and T98G cells compared to the controls (sh-Scr) (Supplementary Figure S3, Supplemental Table S1). Notably, we did not observe any effect of TMZ on the sphere initiating cell frequency, indicating that TMZ does not affect GSC self-renewal (–)). These data strongly indicate that PTC-209 has a marked effect on the maintenance of GSCs.
PTC-209 reverses the altered transcriptional program associated with overexpressed BMI-1
As a well-known oncogene, high expression of BMI-1 is associated with numerous cancers through a variety of regulatory processes. To figure out the potential key regulatory process for BMI-1 in GBM, we took advantage of the transcriptome data from TCGA datasets of glioblastoma and performed correlation analyses. Given that PRCs are generally regarded as transcriptional repressors, the negatively correlated genes with BMI-1 were brought into focus. We obtained a cluseter of the top 1,123 genes which are significantly negative correlated with BMI-1 expression (R < -0.3) (Supplemental Table S2). Gene Ontology (GO) analyses showed that these genes are mainly associated with biological functions of cell proliferation, tumor invasion, cell communication and signaling transduction ()). Therefore these analyses suggest that the BMI-1-induced alteration of transcriptional program which accounts for its oncogenic functions in GBM development.
Figure 5. PTC-209 reverses BMI-1-induced changes of transcriptional program underlying GBM development. (A) In silico analysis of BMI-1 negatively correlated genes (Pearson correlation coefficient < -0.3) in glioblastoma based on TCGA datasets. The heatmap of relative expression of BMI-1 negatively correlated genes sorted by the level of BMI-1 expression (left) and bubble plots showing GO enrichment of BMI-1 negatively correlated genes in GBMs (right) were based on the TCGA datasets. (B) Volcano plots of genes in U87MG cells treated with 1 µM PTC-209 for 4 days compared with DMSO treated controls. The red plots represent the upregulated genes (up, p-value < 0.05, log2 fold change > 1), the green plots represent the downregulated genes (down, p-value < 0.05, log2 fold change < -1), and the gray plots represent the insignicantly deregulated genes (not sig). (C) qRT-PCR analysis for the validation of up/down-regulated genes which were also BMI-1 negatively/positively correlated. Data were normalized to GAPDH and related to DMSO treated controls (mean ± SD; n = 3; *p < 0.05; **p < 0.01). (D) GO analysis for upregulated genes in RNA-seq data of U87MG cells treated with 1 µM PTC-209 for 4 days compared with DMSO treated controls. Biological processes that are also enriched in T98G cells under the same treatment as U87MG cells and the BMI-1 negatively correlated genes based on the clinical data were listed
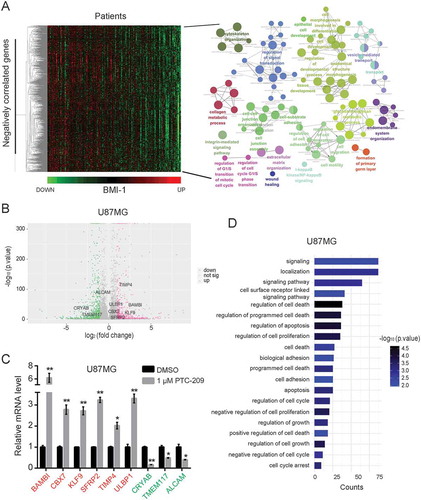
To explore how PTC-209 exerts its anti-GBM effects, we undertook an unbiased genomic approach to define the altered transcriptional program. RNA sequencing (RNA-seq) assay was performed to identify transcripts differentially expressed by PTC-209 treatment in U87MG and T98G cells. Bioinformatics analysis revealed 1,046 (442 genes upregulated and 604 genes downregulated) and 1,109 (447 genes upregulated and 662 genes downregulated) differentially expressed genes upon PTC-209 treatment respectively in U87MG and T98G cells (fold change > 2) () and Supplemental Table S3 and S4). Interestingly, several suppressors of glioblastoma growth, invasion or stemness are significantly upregulated, such as CBX7 [Citation21,Citation23], TIMP4 [Citation24], SFRP2 [Citation25], KLF9 [Citation26], as validated by qRT-PCR analysis in U87MG cells ()).
Probably due to different genetic background, the KEGG analyses of the derepressed genes in U87MG and T98G cells revealed distinct enrichment of pathways (Supplementary Figure S3A and B). However the upregulated genes in both cell lines showed an enrichment of various GO terms like regulation of cell proliferation and cell death, biological adhesion, cell cycle, signaling pathway, etc, which largely coincide with the above GO analysis of BMI-1 negatively associated genes () and Supplementary Figure S3C). These data suggest that PTC-209 reverses the BMI-1-associated alteration of transcriptional program underlying GBM development, contributing to its anti-GBM efficacy.
PTC-209 induces the derepression of tumor suppressor genes through disruption of polycomb functions at their promoters
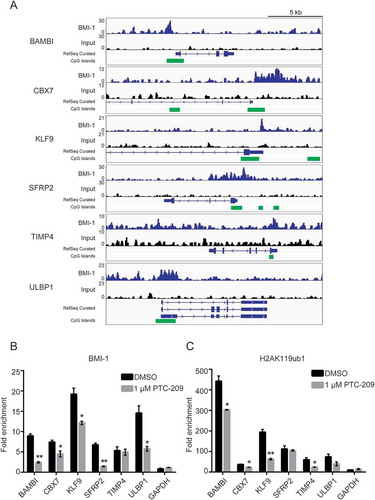
Next, we would like to see whether BMI-1 is directly invovled in the repression of the above upregulated genes with potential tumor suppressor activities. Taking advantage of published Chromatin Immunoprecipitation sequencing (ChIP-seq) dataset in GBM cells [Citation25], we confirmed that BMI-1 is significantly enriched at the promoters of the validated derepressed genes ()). Moreover, ChIP-qPCR analysis in U87MG cells showed that PTC-209 results in the decreased binding of BMI1 and reduced levels of H2AK119ub1at their promoters (,)). Therefore the downstream transcription regulatory effect of PTC-209 at least partially resides in the disruption of PcG functions in GBM cells.
Figure 6. PTC-209 depressed the BMI-1 binding and H2AK119ub1 levels at the promoters of BMI-1 target genes. (A) Example of tracks from ChIP-seq analysis for BMI-1 at the promoters of the indicated genes in GBMs. The normalized numbers of tags (TPM) are given to the left of each graph. CpG islands are labeled with green blocks. (B-C) ChIP-qPCR analyses using anti-BMI-1 antibody. (B-C) ChIP-qPCR analyses using anti-BMI-1 antibody (B) and anti-H2AK119ub1 antibody (C) were performed on chromatin lysates prepared from U87MG treated with DMSO or 1 µM PTC-209 for 4 days. Results are expressed as the fold-enrichments relative to IgG IP controls (mean ±SD, n = 3; *p < 0.05; **p < 0.01)
PTC-209 showed anti-GBM activity in vivo
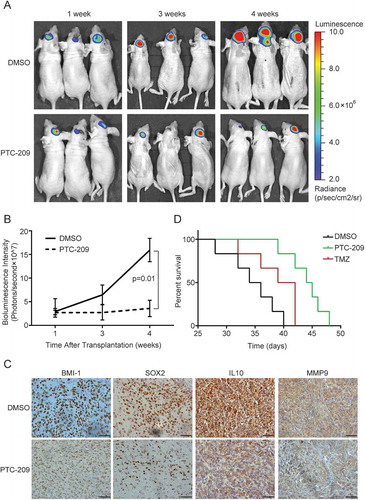
Besides the in vitro functional studies, we proceeded to investigate the impact of PTC-209 on GBM tumor progression in vivo. Since U87MG is sensitive to PTC-209 in vitro and is commonly used for xenograft studies due to its high tumorigenicity and genetic features typical for GBM, we established the orthotopic mouse models using this cell line transduced with luciferase expressing lentivirus. As desribed previously [Citation27], U87MG-luciferase cells (5 × 10⁵) were injected intracerebrally. One week after transplantion, the nude mice were treated with PTC-209 (60 mg/kg/time), TMZ (40 mg/kg/time) or DMSO, three times weekly for 3 weeks through intraperitoneal injection. The bioluminescence imaging showed tumor growth was significantly abrogated in the PTC-209 treatment group compared with the DMSO control group tumors. The tumor volume appeared significantly smaller after 2 weeks of PTC-209 injection (3 and 4 weeks after implantation) ()). As measured in ), PTC-209 showed significant anti-tumor efficacy with a final T/C-ratio of 0.18. Then the mice were sacrificed to extract tumors for the IHC staining. As shown in ), the in situ BMI-1 protein levels were significantly downregulated by PTC-209 treatment. In addition, we compared the expression levels of the GSC marker SOX2 [Citation28,Citation29], invasiness and high-risk signature genes IL10 and MMP9 [Citation30] between the two groups through IHC staining. Their expression levels were obviously decreased in the PTC-209 group ()), indicative of reduced tumor aggressiveness after treatment. Moreover, the xenografted mice receiving monotherapy with PTC-209 had a significantly longer survival than the group of monotherapy with TMZ ()).
Figure 7. PTC-209 abrogates intracranial GBM progression. (A) Representative in vivo bioluminescent image of U87MG-derived intracranial tumors in the PTC-209 or DMSO treated mice brains at 1, 3 and 4 weeks after U87MG implantation. (B) The average signals of luciferase activity in PTC-209 or DMSO treated mice brains at different time points (mean ± SD; n = 8). (C) Excised tumors from the mice were subjected to IHC staining with designated antibodies (Scale bar 50 µm). (D) Survival curve of specified group of mice which were injected intracranially with 3 × 10^5 of U87 cells expressing luciferase (n = 6)
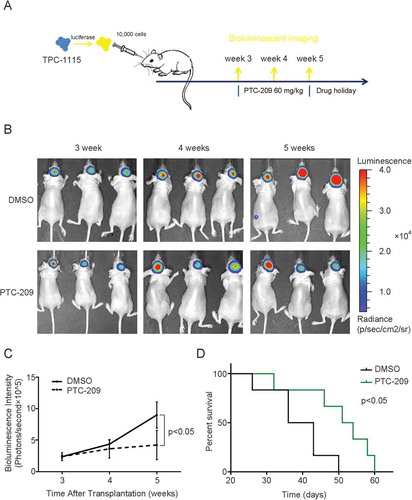
As patients-derived cells better reflect key properties of GSCs such as differentiation capabilities and heterogeneity, we treated TPC1115 with PTC-209. As shown in Supplementary Figure S5, the inhibitor also downregulates the protein levels of BMI-1 and inhibits H2AK119 monoubiquitylation in a dose-dependent manner. Then we would like to measure the effects of PTC-209 on the intracranial tumor growth with TPC1115-luciferase cells. To avoid the disruption of Blood-brain barrier (BBB) by the surgical procedure, we allow the transplanted mice to recover for three weeks before starting the drug treatment ()). Though we injected only TPC1115-luciferase cells (1 × 10⁴) fewer than U87MG cells, the tumors develop fast in control group, indicative of higher tumorigenicty of these TPC cells. And it is gratifying that the tumor growth in PTC-209-treatment group is significantly reduced (,)). Compared with the control group, the PTC-209 treatment extends the survival of tumor-bearing mice ()). Therefore our data convincingly demonstrate that PTC-209 inhibits glioblastoma growth in vivo and may provide therapeutic benefit to patients with malignant gliomas.
Figure 8. PTC-209 abrogates progression of TPC-1115-derived intracranial tumors
Discussion
Improved therapeutic options for malignant gliomas are urgently needed. In the past decades, much effort has been put into understanding how epigenetic changes contribute to glioblastoma development, progression, and resistance to chemotherapy [Citation31]. The dysregulated PcG functions have been found in diversity of tumors including GBM [Citation13,Citation32,Citation33]. However it still remains a challenging question which PcG member could be an optimal theraperutic target. Among the well-characterized PRC subunits, the deregulated expression of BMI-1 and EZH2 is regarded as a causal factor to malignancies and therefore of particular interest in basic and translational cancer studies. So far pharmacological inhibition of the methyltranferase activity of EZH2 on H3K27 has shown promosing anti-cancer effects and several compounds have already been in clinical trials [Citation34]. However prolonged Ezh2 inhibition in GBM results in tumor progression followed by initial inhibition [Citation35]. Another innegligible concern is that these inhibitors cannot affect the non-histone methylation by EZH2 which may vitally contribute to its oncogenic functions [Citation36]. Moreover targeting EZH2 may be a double-edge sword considering that EZH2 is the core member of PRC2 and EZH2 loss-of-function is also linked to malignancies [Citation37,Citation38]. In contrast, BMI-1 is only one of six PCGF orthologs in mammals and its function in normal cells may be compensated. In this study, we demonstrated a highly efficacious anti-GBM activity of PTC-209, a novel specific inhibitor that directly suppresses BMI-1 expression.
Overexpression of BMI-1 has been reported in various malignancies, including GBM. We likewise observed a significant elevated expression of BMI-1 in GBM cell lines and patient derived GBM cells (). Our in vitro and in vivo functional studies demonstrated that PTC-209 inhibits GBM cell growth, migration and the tumor initiating cell self-renewal (–), and therefore strongly abrogates tumor formation (–). As PTC-209 downregulaes the BMI-1 protein levels, it should faithfully recapitulate the effect of BMI-1 downregulation. To find out the transcriptional effects on GBM cells and to relate them to its anti-GBM activity, we first digged out information of BMI-1 negatively correlated genes from TCGA datasets, which are closely linked to its oncogenic functions such as promoting cell cycle progression, cell migration and stemness. Meanwhile we performed analysis of derepressed genes by PTC-209 in GBM cell lines. Though these genes were not completely overlapped with BMI-1 negatively correlated genes, our GO analysis demonstrated that the specific inhibitor of BMI-1 just derepresses the genes whose suppression by BMI-1 underlies the GBM tumorigenesis (). Furthermore we confirmed a subset of these tumor suppresor genes as direct targets for BMI-1 and H2AK119 monoubiquitylation is involved in the transcriptional repression (). Therefore the anti-GBM function of PTC-209 attibutes to the restoration of transcriptional program altered by hyperactive BMI-1 activity.
Taken together, our study adds an important compound that could be a potential target therapy for malignant gliomas. Due to technical limitation, we did not examine accurately how much of the drug cross BBB in this study. According to the molecular weight and the prediction of liposolubility, the BBB permeability of PTC-209 could not be so high in normal conditions. However a breach of the BBB after around 2 weeks of GBM development has been frequently observed probably due to development of leaky tumor vasculature upon neoangiogenesis. The intraperitoneal injections of PTC-209 successfully achieved significant inhibition of BMI1-1 expression as shown by the IHC analysis ()). Therefore the anti-GBM efficacy we observed in the in vivo assay was likely due to compromised BBB. To maximize benefits and lower toxity, there is strong rationale for conjugation the compound to brain-penetratrting Angiopep or RVG peptides or developing next-generation BMI-1 inhibitors with increased BBB penetration. In addition, optimized combination therapies with the existing drugs should also be tested in the future.
Materials and methods
Datasets of glioma samples
The mRNA expression datasets and the corresponding clinical information were obtained from websites as follows: TCGA (http://cancergenome.nih.gov) [Citation39], The ChIP-seq data for BMI-1 were downloaded from the GEO dataset GSE33912 [Citation21].
Glioblastoma cells and compounds
The U87MG and T98G cell lines were obtained from the American Type Culture Collection and were cultivated in high glucose DMEM (C11995500BT, Gibco) supplemented with 10% fetal bovine serum (FBS) and 1% penicillin-streptomycin (PS, 15,140,122, Gibco) at 37°C in a humidified 5% CO2 incubator. The derivation and culture of the two primary gliobalstoma tumor progenitor cells (TPCs) TPC-1115 and TPC-0411 were as described [Citation22]. Briefly, the cells were maintained in DMEM/Ham’s F12 (12,400,024, Gibco) supplemented with 75 μg/ml BSA (B2064, Sigma), 24 μl/ml N2 Supplement (17,502,048, Gibco), 24 μl/ml B27 Supplement (17,504,044, Gibco), 10 μg/ml insulin (12,585,014, Gibco), 1% PS, 20 ng/ml bFGF (10,014-HNAE, Sino Biological) and 20 ng/ml EGF (10,605-HNAE, Sino Biological). For sphere formation, cells were cultured in serum-free DMEM/Ham’s F12 medium containing 20 μl/ml B27 supplement, 5 μg/ml insulin, 1% PS, 20 ng/ml bFGF and 10 ng/ml EGF at ultra-low attachment plates (C153261-20EA, Corning). PTC-209 and Temozolomide (TMZ) were purchased from Selleck Chemicals (PTC-209: S7539 http://www.selleck.cn/products/ptc-209-hbr.html; Temozolomide: S1237 http://www.selleck.cn/products/Methazolastone.html) and were dissolved in dimethyl sulfoxide (DMSO, Sigma).
RNA extraction, RT-qPCR and RNA sequencing (RNA-seq)
Total RNA was extracted using Trizol Reagent (15,596,026, Invitrogen) according to the instructions. Reverse transcription reactions were performed with DNase I (EN0521, Thermo Scientific) and First Strand cDNA Synthesis Kit (K1622, Thermo Scientific). To determine the fold change in the expression of each gene, real-time qPCR was performed using FastStart Universal SYBR Green Master (Rox) (4,913,914,001, Roche) in a 7500 fast Real-Time PCR System (Applied Biosystems, Thermo Scientific). For each sample, the qPCRs were performed in triplicate with each pair of primers. The RT-qPCR primer squences are summarized in Supplemental Table S5.
To analyze the genome-wide changes in gene expression, the RNA-seq library and RNA-seq was constructed by BGI company (Shenzhen, China). The raw data of RNA-seq were processed using CASAVA V1.6 package. The quality control of each sample was accomplished using FASTQC V0.11.5. Clean reads were used in the whole analysis process as described [Citation40].
Protein extraction and western blotting
The total proteins from cells were extracted with RIPA lysis buffer. The concentration of proteins in the supernatant was analyzed using the BCA method (P0011, Beyotime Biotechnology). The protein samples (10–60 μg per lane) were loaded onto SDS gels, electrophoresed, and then transferred to PVDF membranes. After blocked with 5% milk diluted in TBST for 1 h at room temperature (RT), PVDF membranes were incubated with primary antibodies diluted in TBST overnight at 4°C. After washing three times with TBST, the membranes were incubated with a HRP-conjugated Goat Anti-Mouse IgG or Goat Anti-Rabbit IgG for 1 h at RT. The bands were visualized and quantified using the ECL chemiluminescence detection system (Alliance mini HD6, UVITEC Cambridge). The primary antibodies used in this study are listed in Supplemental Table S6.
Cell growth analysis
Cells were plated at a density of 1000 cells/well into 96-well plates. The number of live cells was counted at the specified time by means of celltiter 96® aqueous non-radioactive cell proliferation assay (promega).
Cell cycle analysis
Cells were harvested and washed with ice-cold 1×PBS for twice, and then resuspend with 70% ethanol overnight at 4°C. After the ethanol was removed by centrifugation, pellets were washed with ice-cold 1×PBS and then resuspended in 500 μl of DNA staining buffer composed of 50 μg/ml propidium iodide (PI), 0.2% Triton X-100, and 100 μg/ml RNase. After 30 min of incubation at 4°C in the dark, the cells were analyzed using the BD LSRFortessa™ cell analyzer (BD Biosciences). The cell cycle phase distribution results were then analyzed using the ModFit LT Program (Verify Software House, Topsham, ME).
Side population (SP) analysis
Cells (1 × 10⁶ cells/ml) were incubated in pre-warmed mediam (containing 97% high glucose DMEM, 2% FBS and 1% PS) added Hoechst 33,342 (5 μg/ml final concentration) for 90 min at 37°C with intermittent mixing. At the end of incubation, cells were spun down at 4°C and resuspended in ice-cold 1×PBS. 7-AAD (2 μg/ml final concentration) was added for 5 min before fluorescence-activated cell sorting (FACS) analysis, which allows for the discrimination of dead versus live cells. Samples were analyzed on the BD LSRFortessa™ cell analyzer. The Hoechst dye was excited with the UV laser at 355 nm and its fluorescence measured with a 450 nm side population filter (Hoechst blue) and a 675 EFLP optical filter (Hoechst red). A 610 DSP filter was used to separate the emission wavelengths.
Analysis and sorting for the CD133+ cells
Cells were resuspended in 1×PBS (1 × 10⁷ cells/ml, 100 μl/test) and were stained with anti-APC-cd133 (5 μl/test, 17–1338-41, eBioscience) for 2 hrs at RT in dark. Cells were then washed with 1ml 1×PBS once, and resuspended in 300 μl 1×PBS for analysis or sorting. Cells were sorted using the BD LSRFortessa™ cell analyzer.
Extreme limiting dilution analysis
For the limiting dilution assay, U87MG and T98G cells were planted into 96-well plates pre-coated with 0.5% agarose at the indicated cell doses. For each cell dose, at least 60 wells were seeded with cells. Two weeks later, the number of wells containing spheres was counted, and used to calculate the the tumor initiating frequency (TIF) using the ELDA software [Citation41].
Animals and in vivo tumor xenograft assay
All animal experiments were carried out in the animal unit of Tianjin Medical University according to procedures authorized and specifically approved by the institutional ethical committee (permit SYXK 2009–0001). To establish orthotopic GBM xenografts, U87MG and TPC-1115 cells transduced with lentiviral expressing constructs of luciferase were transplanted into brains of Female BALB/C nude mice (4–6 weeks old). One week (or three weeks) after transplantion, mice were treated with PTC-209 (60 mg/kg/time), TMZ (40 mg/kg/time) or vehicle control (DMSO) three times weekly for 3 weeks through intraperitoneal injection. Animals were monitored at desired time points by bioluminescent imaging using IVIS Spectrum Pre-clinical In Vivo Imaging System (PE). The experiments were repeated at least six times.
Immunohistochemical (IHC) staining
Mice were sacrificed by cervical dislocation at 4 weeks after implantation and the tumors were extracted, and tissues were fixed with Bouin’s solution (HT101128, Sigma) and embedded with paraffin for histological study. Paraffin-embedded tissue sections of samples were baked at 60°C for 1 h and then taken through xylene and graded ethanols into distilled water. After retrieving antigen epitopes, quenching the endogenous peroxidase activity and blocking the nonspecific binding sites, the sections were incubated with primary antibodies at 4°C overnight. The primary antibodies were detected by HRP labeled secondary antibodies at the dilution of 1:1000 (Boster), and then stained with the DAB solution. The primary antibodies for IHC are listed in Supplemental Table S6.
Chromatin immunoprecipitation (ChIP)
The ChIP assays were performed as previously described [Citation42]. Briefly, cells were chemically cross-linked with 1% formaldehyde solution for 10 min at RT with gentle agitation and quenched with 0.125 M glycine. Cells were rinsed twice with 1xPBS, and re-suspended, lysed, and sonicated to solubilize and shear crosslinked DNA. To ensure consistent sonication between samples, we used Bioruptor pico (Diagenode). Sonication was performed for 4–6 cycles (30 s-ON, 30 s-OFF). The resulting chromatin extract was precleared and appropriate amount was taken to incubate at 4°C with 2–4 µg of antibody for at least 3 hr.The primer sequences for ChIP-qPCR analysis are available in Supplemental Table S5.
Statistical analysis
Kaplan–Meier survival analysis was used to estimate the survival distributions. One-way ANOVA, Student’s t-test, and the Pearson correlation were used to determine significant differences. Error bars denoted the standard deviation (SD). The final T/C-ratio means the treated over control tumor volume ratio at 4 weeks after xenograft assay and was measured as previously described [Citation43]. SPSS software was used for the statistical analysis. And GraphPad Prism 5 software was used for data analysis. The Gene Ontology biological processes and KEGG pathways were analyzed using the ClueGO: a Cytoscape plug-in to decipher functionally grouped genes.
Supplemental Material
Download Zip (1.5 MB)Acknowledgments
We thank members of the Wu laboratory for critical reading of the manuscript and discussions, technical advice and support. The work was supported by National Natural Science Foundation of China (grant numbers 31570774, 81772676, 81500258 and 81500170), the Ministry of Science and Technology of China (2016YFC0902502 and 2017YFA0504102) and the Natural Science Foundation of Tianjin (16JCQNJC12100, 16JCQNJC10300). This work was also supported by Talent Excellence Program from Tianjin Medical University and Beijing Key Laboratory for Precancerous Lesion of Digestive Diseases.
Disclosure statement
No potential conflict of interest was reported by the authors.
Supplementary Material
Supplemental data for this article can be accessed here.
Additional information
Funding
Related Research Data
References
- Qazi MA, Vora P, Venugopal C, et al. Intratumoral heterogeneity: pathways to treatment resistance and relapse in human glioblastoma. Ann Oncol. 2017;28:1448–1456.
- Osuka S, Van Meir EG. Overcoming therapeutic resistance in glioblastoma: the way forward. J Clin Invest. 2017;127:415–426.
- Kreso A, Dick JE. Evolution of the cancer stem cell model. Cell Stem Cell. 2014;14:275–291.
- Meacham CE, Morrison SJ. Tumour heterogeneity and cancer cell plasticity. Nature. 2013;501:328–337.
- Alvarado AG, Thiagarajan PS, Mulkearns-Hubert EE, et al. Glioblastoma cancer stem cells evade innate immune suppression of self-renewal through reduced TLR4 expression. Cell Stem Cell. 2017;20:450–461 e454.
- Bao S, Wu Q, McLendon RE, et al. Glioma stem cells promote radioresistance by preferential activation of the DNA damage response. Nature. 2006;444:756–760.
- Chen J, Li Y, Yu TS, et al. A restricted cell population propagates glioblastoma growth after chemotherapy. Nature. 2012;488:522–526.
- Triscott J, Rose Pambid M, Dunn SE. Concise review: bullseye: targeting cancer stem cells to improve the treatment of gliomas by repurposing disulfiram. Stem Cells (Dayton, Ohio). 2015;33:1042–1046.
- Zhu Z, Khan MA, Weiler M, et al. Targeting self-renewal in high-grade brain tumors leads to loss of brain tumor stem cells and prolonged survival. Cell Stem Cell. 2014;15:185–198.
- Di Croce L, Helin K. Transcriptional regulation by Polycomb group proteins. Nat Struct Mol Biol. 2013;20:1147–1155.
- Alkema MJ, Jacobs H, van Lohuizen M, et al. Pertubation of B and T cell development and predisposition to lymphomagenesis in Emu Bmi1 transgenic mice require the Bmi1 RING finger. Oncogene. 1997;15:899–910.
- Bruggeman SW, Hulsman D, Tanger E, et al. Bmi1 controls tumor development in an ink4a/arf-independent manner in a mouse model for glioma. Cancer Cell. 2007;12:328–341.
- Abdouh M, Facchino S, Chatoo W, et al. BMI1 sustains human glioblastoma multiforme stem cell renewal. J Neurosci. 2009;29:8884–8896.
- Chiba T, Miyagi S, Saraya A, et al. The polycomb gene product BMI1 contributes to the maintenance of tumor-initiating side population cells in hepatocellular carcinoma. Cancer Res. 2008;68:7742–7749.
- Dovey JS, Zacharek SJ, Kim CF, et al. Bmi1 is critical for lung tumorigenesis and bronchioalveolar stem cell expansion. Proc Natl Acad Sci U S A. 2008.
- Chen D, Wu M, Li Y, et al. Targeting BMI1+ cancer stem cells overcomes chemoresistance and inhibits metastases in squamous cell carcinoma. Cell Stem Cell. 2017;20:621–634 e626.
- Ferretti R, Bhutkar A, McNamara MC, et al. BMI1 induces an invasive signature in melanoma that promotes metastasis and chemoresistance. Genes Dev. 2016;30:18–33.
- Kreso A, van Galen P, Pedley NM, et al. Self-renewal as a therapeutic target in human colorectal cancer. Nat Med. 2014;20:29–36.
- Bolomsky A, Schlangen K, Schreiner W, et al. Targeting of BMI-1 with PTC-209 shows potent anti-myeloma activity and impairs the tumour microenvironment. J Hematol Oncol. 2016;9:17.
- Mayr C, Wagner A, Loeffelberger M, et al. The BMI1 inhibitor PTC-209 is a potential compound to halt cellular growth in biliary tract cancer cells. Oncotarget. 2016;7:745–758.
- Gargiulo G, Cesaroni M, Serresi M, et al. In Vivo RNAi Screen for BMI1 Targets Identifies TGF-beta/BMP-ER stress pathways as key regulators of neural- and malignant glioma-stem cell homeostasis. Cancer Cell. 2013;23:660–676.
- Jin X, Kim LJY, Wu Q, et al. Targeting glioma stem cells through combined BMI1 and EZH2 inhibition. Nat Med. 2017.
- Nawaz Z, Patil V, Arora A, et al. Cbx7 is epigenetically silenced in glioblastoma and inhibits cell migration by targeting YAP/TAZ-dependent transcription. Sci Rep. 2016;6:27753.
- Pullen NA, Anand M, Cooper PS, et al. Matrix metalloproteinase-1 expression enhances tumorigenicity as well as tumor-related angiogenesis and is inversely associated with TIMP-4 expression in a model of glioblastoma. J Neurooncol. 2012;106:461–471.
- Stricker SH, Feber A, Engstrom PG, et al. Widespread resetting of DNA methylation in glioblastoma-initiating cells suppresses malignant cellular behavior in a lineage-dependent manner. Genes Dev. 2013;27:654–669.
- Ying M, Tilghman J, Wei Y, et al. Kruppel-like factor-9 (KLF9) inhibits glioblastoma stemness through global transcription repression and integrin alpha6 inhibition. J Biol Chem. 2014;289:32742–32756.
- Huang K, Yang C, Wang QX, et al. The CRISPR/Cas9 system targeting EGFR exon 17 abrogates NF-kappaB activation via epigenetic modulation of UBXN1 in EGFRwt/vIII glioma cells. Cancer Lett. 2016;388:269–280.
- Suva ML, Rheinbay E, Gillespie SM, et al. Reconstructing and reprogramming the tumor-propagating potential of glioblastoma stem-like cells. Cell. 2014;157:580–594.
- Mao DD, Gujar AD, Mahlokozera T, et al. A CDC20-APC/SOX2 signaling axis regulates human glioblastoma stem-like cells. Cell Rep. 2015;11:1809–1821.
- Cheng W, Ren X, Zhang C, et al. Bioinformatic profiling identifies an immune-related risk signature for glioblastoma. Neurology. 2016;86:2226–2234.
- Sturm D, Bender S, Jones DT, et al. Paediatric and adult glioblastoma: multiform (epi)genomic culprits emerge. Nat Rev Cancer. 2014;14:92–107.
- Natsume A, Ito M, Katsushima K, et al. Chromatin regulator PRC2 is a key regulator of epigenetic plasticity in glioblastoma. Cancer Res. 2013;73:4559–4570.
- Li G, Warden C, Zou Z, et al. Altered expression of polycomb group genes in glioblastoma multiforme. PLoS ONE. 2013;8:e80970.
- Melnick A. Epigenetic therapy leaps ahead with specific targeting of EZH2. Cancer Cell. 2012;22:569–570.
- de Vries NA, Hulsman D, Akhtar W, et al. Prolonged Ezh2 depletion in glioblastoma causes a robust switch in cell fate resulting in tumor progression. Cell Rep. 2015;10:383–397.
- Kim E, Kim M, Woo DH, et al. Phosphorylation of EZH2 activates STAT3 signaling via STAT3 methylation and promotes tumorigenicity of glioblastoma stem-like cells. Cancer Cell. 2013;23:839–852.
- Sashida G, Wang C, Tomioka T, et al. The loss of Ezh2 drives the pathogenesis of myelofibrosis and sensitizes tumor-initiating cells to bromodomain inhibition. J Exp Med. 2016;213:1459–1477.
- Ntziachristos P, Tsirigos A, Van Vlierberghe P, et al. Genetic inactivation of the polycomb repressive complex 2 in T cell acute lymphoblastic leukemia. Nat Med. 2012;18:298–301.
- Brennan CW, Verhaak RG, McKenna A, et al. The somatic genomic landscape of glioblastoma. Cell. 2013;155:462–477.
- Riising EM, Comet I, Leblanc B, et al. Gene silencing triggers polycomb repressive complex 2 recruitment to CpG islands genome wide. Mol Cell. 2014;55:347–360.
- Hu Y, Smyth GK. ELDA: extreme limiting dilution analysis for comparing depleted and enriched populations in stem cell and other assays. J Immunol Methods. 2009;347:70–78.
- Wu X, Bekker-Jensen IH, Christensen J, et al. Tumor suppressor ASXL1 is essential for the activation of INK4B expression in response to oncogene activity and anti-proliferative signals. Cell Res. 2015;25:1205–1218.
- Voskoglou-Nomikos T, Pater JL, Seymour L. Clinical predictive value of the in vitro cell line, human xenograft, and mouse allograft preclinical cancer models. Clin Cancer Res. 2003;9:4227–4239.