
ABSTRACT
Long noncoding RNAs (lncRNAs) are important regulators of the biological functions and underlying molecular mechanisms of colorectal cancer (CRC). However, the role of the lncRNA ZEB1-AS1 in CRC is not thoroughly understood. In this study, we found that ZEB1-AS1 was markedly upregulated in CRC. ZEB1-AS1 knockdown significantly suppressed CRC cell proliferation and induced apoptosis, whereas enhanced expression of ZEB1-AS1 had the opposite effect. Bioinformatics analysis identified miR-181a-5p as a candidate target of ZEB1-AS1. Moreover, we found an inverse correlation between ZEB1-AS1 and miR-181a-5p expression in CRC tissue. Inhibition of miR-181a-5p significantly upregulated ZEB1-AS1, whereas overexpression of miR-181a-5p had the opposite effect, suggesting that ZEB1-AS1 is negatively regulated by miR-181a-5p. Using luciferase reporter and RIP assays, we found that miR-181a-5p directly targets ZEB1-AS1. Importantly, ZEB1-AS1 may act as an endogenous ‘sponge’ to regulate miRNA targets by competing for miR-181a-5p binding. In summary, our findings provide the evidence supporting the role of ZEB1-AS1 as an oncogene in CRC. Our study also demonstrates that miR-181a-5p targets not only protein-coding genes but also the lncRNA ZEB1-AS1.
Introduction
Colorectal cancer (CRC) is the third most common cancer worldwide [Citation1]. Although the survival rate of most cancers has improved significantly over the past three decades, the prognosis of CRC patients has shown slower improvement [Citation2]. Recent studies have shown that CRC occurrence and progression is regulated by many cellular signaling pathways including the p53 pathway, the PI3K-Akt pathway, and the Wnt/beta-catenin pathway. [Citation3]
Multiple genomic and transcriptomic studies have shown that only a very small percentage (1–2%) of the genome encodes proteins, while the rest of the genome encodes large amounts of non-coding RNA [Citation4,Citation5]. Long noncoding RNAs (lncRNAs) are RNA transcripts greater than 200 nucleotides in length that lack protein-coding functionality [Citation6]. More and more studies have shown that lncRNAs appear to be involved in the development and progression of various human diseases [Citation7,Citation8]. Given these findings, recent research has sought to emphasize mechanisms mediated by lncRNAs in cancer progression. Recent studies have shown that a novel long non-coding RNA, ZEB1 antisense 1 (ZEB1-AS1), is an antisense transcript that originates from the ZEB1 promoter and is expressed at significantly elevated levels in osteosarcoma, hepatocellular carcinoma, and prostate cancer [Citation9–Citation11]. Dysregulation of ZEB1-AS1 has been demonstrated to play a pivotal role in tumorigenesis and progression, suggesting its potential clinical value as a biomarker or therapeutic target for a diverse range of cancers. Further, this lncRNA may be utilized as a new prognostic biomarker for CRC [Citation12]. However, the function and mechanism of ZEB1-AS1 in CRC needs to be clarified.
LncRNAs have been found to be associated with the development and progression of human disease, but little is known about the mechanisms underlying these processes. MicroRNAs (miRNAs), which are ~22 nucleotides in length, play important roles in the regulation of target gene expression by base pairing to complementary sites in the 3′-untranslated regions (3′UTRs), 5′UTRs, and/or coding regions of target mRNAs [Citation13,Citation14]. A notable exception is competing endogenous RNAs (ceRNAs), which act as molecular sponges for miRNAs, thus relieving the repression of target mRNAs [Citation15,Citation16]. Thus, we suggest that ZEB1-AS1 can also interact with miRNAs in this manner.
In this study, the expression and role of ZEB1-AS1 was investigated in CRC. First, we found that ZEB1-AS1 levels are significantly upregulated in CRC tissues. ZEB1-AS1 acts as a possible oncogenic lncRNA to promote proliferation and inhibit the apoptosis of CRC cells. Second, miR-181a-5p directly targets and negatively regulates ZEB1-AS1 through a miRNA binding site. More importantly, we found that ZEB1-AS1 also acts as a “molecular sponge” of miR-181a-5p, thus regulating the expression of downstream target genes.
Results
ZEB1-AS1 is upregulated in CRC
ZEB1-AS1 expression levels were assessed by RT-qPCR in 65 paired CRC samples and histologically normal adjacent tissues. The results showed that ZEB1-AS1 levels were significantly higher in tumor tissues (P < 0.01; )). Examination of the correlations between ZEB1-AS1 expression and clinical pathological features showed that upregulation of ZEB1-AS1 was correlated with tumor histology grade, N grade, and M grade (). However, ZEB1-AS1 expression was not correlated with patients’ gender, age, tumor size, or T grade (). These results implied that ZEB1-AS1 overexpression might be useful as a novel marker of CRC prognosis or progression. We then used RT-qPCR to examine ZEB1-AS1 expression levels in CRC cell lines (RKO, Caco2, DLD1, HCT116, LOVO and SW480) and 293T cells. Compared with 293T cells, CRC cells exhibited significantly higher ZEB1-AS1 expression (n = 6, P < 0.05; )). Collectively, these results suggest that ZEB1-AS1 is upregulated in CRC.
Table 1. Association between patients, characteristics, and ZEB1-AS1 expression in 65 CRC cases
Figure 1. Abnormal ZEB1-AS1 expression is associated with CRC. (a) Expression of ZEB1-AS1 in 65 CRC tissue samples. The expression of ZEB1-AS1 was significantly elevated in the CRC tissues compared with that in the adjacent non-tumor tissues. Statistical differences were analyzed using the Wilcoxon signed-rank test (*P < 0.01). (b) RT-qPCR analysis was used to examine ZEB1-AS1 expression levels in various CRC cell lines (RKO, Caco2, DLD1, HCT116, LOVO and SW480) and the HEK293T cell line (mean ± SD, n = 6; *P < 0.05 vs 293T)
Knockdown of ZEB1-AS1 inhibits CRC cell proliferation and induces apoptosis
To evaluate the possible role of ZEB1-AS1 in CRC, we transfected LOVO and SW480 cells with two different siRNAs against ZEB1-AS1 (designated si#1 and si#2), both of which were capable of efficient knockdown of endogenous ZEB1-AS1 (n = 6, P < 0.05; )). Cell proliferation was assessed using CellTiter 96® AQueous One Solution Cell Proliferation assays. The results of these assays showed that ZEB1-AS1 knockdown significantly inhibited CRC cell proliferation (n = 6, P < 0.05; )). Consistent with these results, colony-formation assays showed that ZEB1-AS1 downregulation significantly inhibited the colony-forming abilities of both cell lines compared with the control treatment (n = 6, P < 0.05; )). Moreover, EdU incorporation was drastically reduced following ZEB1-AS1 downregulation (n = 6, P < 0.05; )). These data provide evidence that ZEB1-AS1 plays a pro-proliferative role in CRC cells. To better understand the mechanisms of proliferation following ZEB1-AS1 knockdown, flow cytometry was employed to examine the cell cycle distribution in both cell lines. The results showed that siRNAs targeting ZEB1-AS1 increased the percentage of cells in the G1 phase with concomitant decreases in the percentage of cells in the S phase compared with the control treatment (n = 6, P < 0.05; )). Based on the observed ZEB1-AS1-regulation of cell cycle distribution, we next detected the levels of several important cell cycle-related proteins in siRNA-transfected CRC cells. ZEB1-AS1 knockdown decreased the expression of Cyclin D1, cyclin-dependent kinase 4 (CDK4), retinoblastoma (Rb) and phosphorylated Rb (p-Rb) compared with the control treatment (n = 6, P < 0.05; , ). Therefore, these results suggested that ZEB1-AS1 might be capable of promoting cell proliferation in CRC by regulating the cell cycle.
Figure 2. ZEB1-AS1 knockdown inhibits CRC cell proliferation. (a) Knockdown efficiencies in LOVO cells and SW480 cells transfected with si-ZEB1-AS1 (si#1 and #2; mean ± SD, n = 6; *P < 0.05 vs NC). (b) Knockdown of ZEB1-AS1 impaired proliferation in LOVO and SW480 cells, as revealed by CellTiter 96® AQueous One Solution Cell Proliferation assay (n = 6; *P < 0.05 vs NC). (c) Histological analysis of the rates of colony formation in control (NC) and ZEB1-AS1 knockdown groups (si#1 and si#2; n = 6; *P < 0.05 vs NC). (d) The EdU incorporation assay was used to examine the effects of ZEB1-AS1 inhibition on DNA synthesis during cell proliferation. Images were taken at × 200. The results showed that the proportion of S-phase cells (EdU-positive cells) was decreased in the siRNA-treated groups (n = 6, *P < 0.05 vs NC). (e) Flow cytometric analysis of cell cycle arrest 48 h after treatment with siRNAs (si#1 and si#2) or a negative control (NC) in LOVO and SW480 cells (n = 6, *P < 0.05 vs NC). (f-g) The expression of cell cycle-related proteins (cyclin D1, CDK4, Rb, and p-Rb) was analyzed by Western blotting in control (NC) and ZEB1-AS1-knockdown LOVO and SW480 cells (n = 6; *P < 0.05 vs NC). (A-B) Flow cytometric analysis of apoptotic rates in LOVO and SW480 cells after siRNA treatment. (C-F) Western blotting was used to investigate alterations in the levels of apoptosis-related proteins in LOVO and SW480 cells. (Mean ± SD, n = 6; *P < 0.05 vs NC)
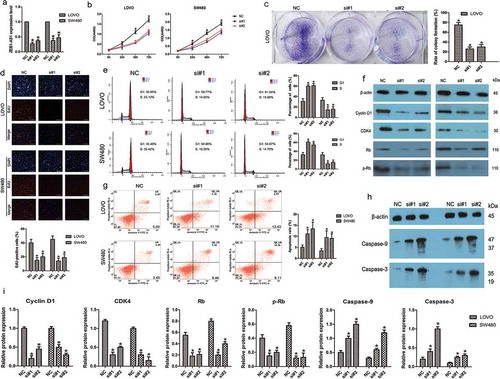
Annexin V staining showed that the percentage of early apoptotic cells was drastically increased relative to that in the control groups following siRNA treatment (n = 6, P < 0.05; )), indicating that ZEB1-AS1 downregulation induced CRC cell apoptosis. To explore the potential mechanisms accounting for the apoptosis-induced anticancer behaviors triggered by ZEB1-AS1 depletion, we used Western blotting to investigate alterations in apoptosis-related proteins. Cleaved caspase-9 and caspase-3 are known to be prominent markers of the mitochondria-mediated caspase-dependent pathway. In the present study, the increased rate of apoptosis following ZEB1-AS1 knockdown was consistent with the enhanced levels of cleaved caspase-9 and caspase-3 in both LOVO and SW480 cells (n = 6, P < 0.05; , ), indicating that activation of the intrinsic apoptotic pathway was involved in ZEB1-AS1 downregulation-induced apoptosis. These data imply that G0/G1 to S-phase arrest and increased apoptosis may contribute to si-ZEB1-AS1-mediated growth inhibition.
Overexpression of ZEB1-AS1 promotes CRC cell proliferation and inhibits apoptosis
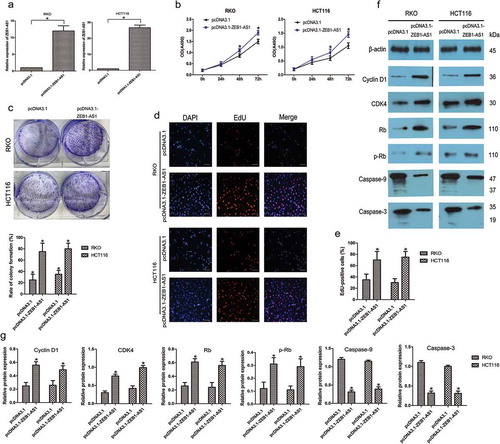
We further examined the role of ZEB1-AS1 by assessing the effect of its overexpression in CRC cells using the pcDNA3.1-ZEB1-AS1 expression plasmid, focusing on cell lines with moderate (RKO) or low (HCT116) endogenous ZEB1-AS1 levels. ZEB1-AS1 expression was drastically increased in both RKO and HCT116 cells after transfection with the pcDNA3.1-ZEB1-AS1 vector compared with the expression in cells transfected with an empty pcDNA3.1 vector (n = 6, P < 0.05; )). CellTiter 96® AQueous One Solution Cell Proliferation assays showed that ZEB1-AS1 upregulation promoted cell proliferation in both cell types (n = 6, P < 0.05; )). Colony-formation assays showed that pcDNA3.1-ZEB1-AS1-transfected cells formed significantly more colonies than control cells (n = 6, P < 0.05; )), indicating that overexpression of ZEB1-AS1 also enhanced the anchorage-independent growth of CRC cells. Moreover, EdU-incorporation assays supported these findings, as the percentage of EdU-incorporating cells was markedly increased following ZEB1-AS1 overexpression (n = 6, P < 0.05; , ). We next examined the expression of several important cell cycle-related and apoptosis-related proteins in ZEB1-AS1-overexpressing CRC cells. The overexpression of ZEB1-AS1 led to increased expression of cyclin D1, CDK4, Rb and p-Rb and decreased levels of cleaved caspase-9 and caspase-3 (n = 6, P < 0.05; , ). Therefore, these data suggested that ZEB1-AS1 might be capable of promoting cell proliferation and inhibiting apoptosis in CRC.
Figure 3. Upregulation of ZEB1-AS1 increases CRC cell proliferation. (a) RT–qPCR analysis of ZEB1-AS1 expression in RKO and HCT116 cells transfected with pcDNA3.1-ZEB1-AS1 or empty pcDNA3.1 vector (mean ± SD, n = 6; *P < 0.05 vs pcDNA3.1). (b) Upregulation of ZEB1-AS1 promoted proliferation in RKO and HCT116 cells, as revealed by CellTiter 96® AQueous One Solution Cell Proliferation assay (n = 6; *P < 0.05 vs pcDNA3.1). (c) Histological analysis of the rates of colony formation in pcDNA3.1 and ZEB1-AS1-overexpressing groups (n = 6; *P < 0.05 vs pcDNA3.1). (d-e) EdU incorporation assays were used to examine the effects of ZEB1-AS1 overexpression on DNA synthesis during cell growth. Images were taken at × 200. (n = 6; *P < 0.05 vs pcDNA3.1). (f-g) Western blotting showed that the proportion of S-phase cells (EdU-positive cells) was increased in pcDNA3.1-ZEB1-AS1-treated groups (n = 6, *P < 0.05 vs pcDNA3.1)
Lncrna ZEB1-AS1 is negatively regulated by mir-181a-5p
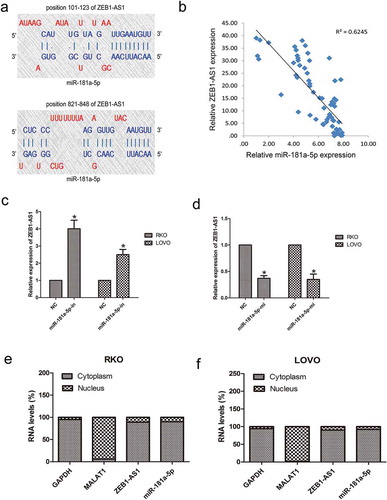
To determine the mechanism of action of ZEB1-AS1 in CRC development, we identified miR-181a-5p as a potential target of ZEB1-AS1 using the DIANA-LncBase Predicted v.2. There are two putative ZEB1-AS1 binding sites within miR-181a-5p: regions 101–123 and 821–848 ()). RT–qPCR showed that, while ZEB1-AS1 was upregulated in CRC tissues, miR-181a-5p was downregulated in the same tumor specimens, resulting in a significant inverse correlation between ZEB1-AS1 and miR-181a-5p (P < 0.01, R2 = 0.6245; ). To further assess the potential relationship between miR-181a-5p and ZEB1-AS1, we transfected RKO and LOVO cells with miR-181a-5p inhibitor or mimic to decrease or increase miR-181a-5p expression, respectively. Inhibition of miR-181a-5p expression resulted in a significant upregulation of ZEB1-AS1 (n = 6, P < 0.05; )), while overexpression of miR-181a-5p significantly reduced ZEB1-AS1 expression in both cell lines (n = 6, P < 0.05; )). Importantly, overexpression or knockdown of ZEB1-AS1 did not change the expression levels of miR-181a-5p. These results suggest that miR-181a-5p negatively regulates ZEB1-AS1 either directly or indirectly. RT–qPCR analysis of RKO and LOVO nuclear and cytoplasmic fractions further confirmed that both miR-181a-5p and ZEB1-AS1 are located in the cytoplasm (), demonstrating the potential for a reciprocal interaction between ZEB1-AS1 and miR-181a-5p.
Figure 4. Negative regulation of ZEB1-AS1 by miR-181a-5p. (a) Predicted miR-181a-5p binding sites in the ZEB1-AS1 sequence. Numbers indicate nucleotide positions relative to the ZEB1-AS1 transcriptional start site. (b) miR-181a-5p mRNA levels were plotted against ZEB1-AS1 expression in 65 CRC specimens, demonstrating a significant positive correlation (two-tailed Pearson’s correlation, r = 0.706; P < 0.01). (c, d) RKO and LOVO cells were transfected with a miR-181a-5p inhibitor (c) or mimic (d), and ZEB1-AS1 expression was analyzed by RT-qPCR 48 h later (n = 6, *P < 0.05 vs NC). (e-f) RT–qPCR was used to detect ZEB1-AS1, miR-181a-5p, GAPDH and MALAT1 levels in the cytoplasmic and nuclear fractions of RKO and LOVO cells. GAPDH and MALAT1 served as a cytoplasmic and nuclear localization marker, respectively (n = 6, *P < 0.05 vs NC)
Mir-181a-5p suppresses ZEB1-AS1 function
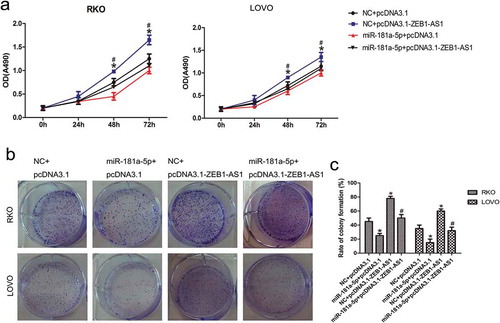
We transfected RKO and LOVO cells with a miR-181a-5p mimic and a ZEB1-AS1 expression vector to study the ZEB1-AS1-mediated effects of miR-181a-5p on cell proliferation. CellTiter 96® AQueous One Solution Cell Proliferation assays revealed that miR-181a-5p suppressed cell proliferation and ZEB1-AS1 promoted cell proliferation (n = 6, P < 0.05; )). Experiments involving co-transfection of the miR-181a-5p mimic and the ZEB1-AS1 expression plasmid showed that miR-181a-5p could abrogate the ZEB1-AS1-mediated induction of cell proliferation (n = 6, P < 0.05; )). Moreover, colony-formation assays demonstrated that miR-181a-5p suppressed and ZEB1-AS1 promoted CRC colony formation (n = 6, P < 0.05; , ). Co-transfection with both the miR-181a-5p mimic and the ZEB1-AS1 expression vector showed that miR-181a-5p abrogated the ZEB1-AS1-mediated increase in colony numbers (n = 6, P < 0.05; , ). Those observations suggest that the ZEB1-AS1 overexpression-mediated increase in CRC cell proliferation can be diminished by miR-181a-5p, in accordance with the suppression of ectopic ZEB1-AS1 expression by miR-181a-5p ()).
Figure 5. MiR-181a-5p inhibits ZEB1-AS1 function. (a) RKO and LOVO cells were co-transfected with a negative control or miR-181a-5p mimic and either a control plasmid (pcDNA3.1) or ZEB1-AS1 expression plasmid (pcDNA3.1-ZEB1-AS1). Cell viability was determined using CellTiter 96® AQueous One Solution Cell Proliferation assays (n = 6; *P < 0.05 vs NC+pcDNA3.1; #P < 0.05 vs NC+pcDNA3.1-ZEB1-AS1). (b-c) Colony-formation assay in CRC cells after cotransfection with a negative control or miR-181a-5p mimic and a control plasmid or ZEB1-AS1 expression plasmid (n = 6; *P < 0.05 vs NC+pcDNA3.1; #P < 0.05 vs NC+pcDNA3.1-ZEB1-AS1)
ZEB1-AS1 is directly targeted by miR-181a-5p, further regulating the miR-181a-5p targets β-catenin/TCF4 within the Wnt/β-catenin signaling pathway
We next sought to examine whether miR-181a-5p-mediated ZEB1-AS1 regulation occurs through direct targeting of miRNA binding sites in the ZEB1-AS1 sequence. We generated wild-type ZEB1-AS1 luciferase plasmids containing the two potential miR-181a-5p binding sites as well as a mutant version of each site ()). These plasmids were co-transfected into HEK293T cells with miR-181a-5p, and then luciferase assays were performed. As shown in ), miR-181a-5p reduced the activity of wild-type-1 luciferase but did not affect the activities of wild-type-2 and mutant-1, 2 (n = 6, P < 0.05; )). These results indicated that miR-181a-5p binds bases 101–123 of ZEB1-AS1. To further test whether ZEB1-AS1 associates with miR-181a-5p, RNA-binding protein immunoprecipitation (RIP) experiments were performed on CRC cells treated with a miR-181a-5p inhibitor or a negative control. RIP assays revealed that, while ZEB1-AS1 was detected in Ago2 immunoprecipitates from the control group, its levels were drastically reduced in Ago2 complexes purified from cells treated with the miR-181a-5p inhibitor (n = 6, P < 0.05; )), indicating that ZEB1-AS1 is likely located in the miR-181a-5p–RISC complex. Collectively, these results revealed that miR-181a-5p inhibits ZEB1-AS1 expression by directly targeting ZEB1-AS1.
Figure 6. ZEB1-AS1 is a direct target of miR-181a-5p. (a) Schematic illustration of the predicted ZEB1-AS1/miR-181a-5p binding sites and the mutations in these binding sequences. (b) Luciferase assays in 293 T cells transfected with wild-type or mutant ZEB1-AS1 and miR-181a-5p (n = 6, *P < 0.05 vs NC). (c) The amount of ZEB1-AS1 and miR-181a-5p bound to Ago2 or IgG was measured by RT–qPCR in the presence of a miR-181a-5p inhibitor or negative control (n = 6, *P < 0.05 vs NC). (d-e) Western blotting was used to detect levels of β-catenin, TCF4, cyclin D1, Myc, and MMP-7 in LOVO cells after transfection with miR-181a-5p mimic or ZEB1-AS1-siRNAs or co-transfection with miR-181a-5p inhibitor and ZEB1-AS1-siRNAs (n = 6; *P < 0.05 vs NC; #P < 0.05 vs ZEB1-AS1-siRNAs). (f-g) Expression of miR-181a-5p targets in RKO cells transfected with a ZEB1-AS1 expression plasmid or co-transfected with a ZEB1-AS1 expression plasmid and a miR-181a-5p mimic (n = 6; *P < 0.05 vs NC; #P < 0.05 vs miR-181a-5p)
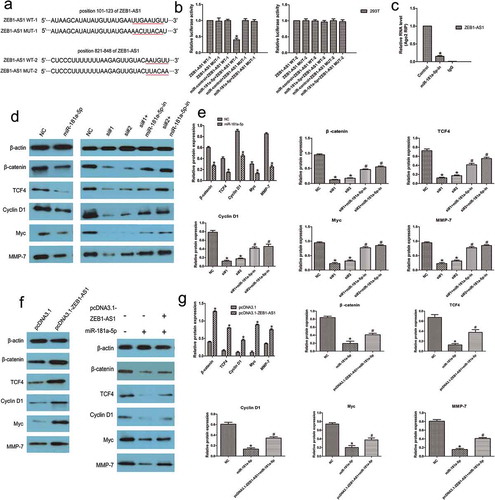
Since miR-181a-5p has been reported to target and repress the expression of both β-catenin and the transcription factor TCF4 [30], we tried to determine whether miR-181a-5p could regulate Wnt signaling in CRC. Western blotting assays revealed that miR-181a-5p decreased the expression of these genes in LOVO cells compared with control treatment (n = 6, P < 0.05; , ). Moreover, we also found that the levels of Cyclin D1, Myc, and MMP-7 were significantly reduced following miR-181a-5p overexpression in CRC cells (n = 6, P < 0.05; , ). We transfected CRC cells with ZEB1-AS1-siRNAs with or without a miR-181a-5p inhibitor and found that ZEB1-AS1 knockdown suppressed the expression of miR-181a-5p targets, whereas miR-181a-5p inhibition partly abolished the ZEB1-AS1 knockdown-mediated silencing effect on these genes (n = 6, P < 0.05; , ). Next, we transfected RKO cells with a ZEB1-AS1 expression plasmid and observed that the expression of miR-181a-5p targets was highly elevated following ZEB1-AS1 upregulation (n = 6, P < 0.05; , ). Furthermore, we co-transfected the miR-181a-5p mimic and the ZEB1-AS1 expression plasmid into CRC cells. We found that the expression of the miR-181a-5p targets was upregulated in the ZEB1-AS1 expression plasmid group compared with that in the control group. Expression of these targets was partly restored by co-transfection of miR-181a-5p mimic and ZEB1-AS1 expression plasmid compared with the expression in the miR-181a-5p group (n = 6, P < 0.05; , ). These results suggest that ZEB1-AS1 could regulate miR-181a-5p target genes through sequestration of endogenous miR-181a-5p. We provide evidence that ZEB1-AS1 may act as an endogenous ‘sponge’ of miR-181a-5p, thus abolishing the miRNA-induced repression of target genes.
Discussion
Despite the great progress made in previous decades that has led to a better understanding of tumorigenesis and therapeutic options, cancer continues to respond poorly to traditional therapies, and patients may experience relapses shortly after clinical treatment. The functions and therapeutic potential of cancer-related lncRNAs have attracted considerable interest in the past few years [Citation17,Citation18]. The interactions between proteins and lncRNAs were the main focus of the current study, which demonstrated that lncRNAs might be a key missing component in oncogenic or tumor-suppressor networks. However, the function and detailed mechanism of action of lncRNA-AS have not been well studied. Therefore, we designed a series of experiments to explain the relationship between CRC and ZEB1-AS1 and to identify the potential role of ZEB1-AS1 in CRC treatment.
In the present study, our data showed that ZEB1-AS1 was over-expressed in CRC tissues and positively correlated with tumor histology grade, N grade, and M grade. These results suggested that ZEB1-AS1 might be a potential diagnostic biomarker or therapeutic target in CRC [Citation19–Citation21]. To further understood the role of ZEB1-AS1 in CRC, we chose to detect changes in the biological behaviors in CRC cell lines. Applying loss-of-function and gain-of-function approaches, we demonstrated that ZEB1-AS1 regulates proliferation and apoptosis in CRC cells. ZEB1-AS1 knockdown significantly inhibited CRC cell proliferation and induced apoptosis, whereas upregulation of ZEB1-AS1 had the opposite effects. These results implied that ZEB1-AS1 functions as an oncogene to contribute to CRC development. However, the underlying mechanism of ZEB1-AS1 in CRC remains largely unclear. Recently, accumulating studies have shown that lncRNAs may act as ‘sponges’ to bind specific miRNAs, thus downregulating the expression and activity of these miRNAs [Citation22,Citation23]. Therefore, we hypothesized that ZEB1-AS1 also targets miRNAs in CRC.
In this study, we identified an inverse correlation between miR-181a-5p and ZEB1-AS1 expression in CRC tissues. Bioinformatics, dual-luciferase assays and RIP assays revealed that ZEB1-AS1 could directly bind miR-181a-5p. Moreover, because ZEB1-AS1 knockdown and overexpression did not affect miR-181a-5p levels, we hypothesized that ZEB1-AS1 may function as an endogenous decoy for miR-181a-5p. These results also showed that miR-181a-5p could directly bind to ZEB1-AS1 without inducing its destabilization. Furthermore, we found that ZEB1-AS1 knockdown could suppress the expression of miR-181a-5p targets, while miR-181a-5p overexpression abolished the ZEB1-AS1 overexpression-mediated increase in miR-181a-5p target expression. Therefore, the effects of ZEB1-AS1 on CRC cell proliferation and apoptosis can be explained, in part, by its role as a molecular sponge of miR-181a-5p, which provides a possible mechanism for ZEB1-AS1 functioning as a tumor oncogene.
β-catenin expression is well known to be necessary for the activation of WNT signaling [Citation24–Citation26]. However, conflicting reports regarding the role of miR-181a-5p in suppressing or promoting tumorigenesis in different cancer types have left unanswered questions [Citation27–Citation29]. In this study, miR-181a-5p regulated β-catenin expression in CRC, in agreement with a previous report showing that miR-181a-5p induces β-catenin mRNA degradation[Citation30]. Based on these results, we hypothesize that miR-181a-5p functions as a tumor suppressor to inhibit CRC proliferation. In our study, ZEB1-AS1 regulated β-catenin by sequestering endogenous miR-181a-5p. In addition, ZEB1-AS1 also affected the expression levels of downstream target genes including TCF4, cyclin D1, Myc, and MMP-7, which are correlated with proliferation and apoptosis. These results suggest that ZEB1-AS1 may act as an endogenous ‘sponge’ that binds miR-181a-5p and abolishes the miRNA-induced repression of β-catenin.
In summary, our study showed that ZEB1-AS1 exhibited strong effects on CRC cells by promoting proliferation and attenuating apoptosis. The potential mechanisms underlying these effects include dysregulation of the cell cycle and inactivation of intrinsic apoptosis via regulation of the WNT/β-catenin signaling pathway. ZEB1-AS1 acts as a molecular sponge for miR-181a-5p and regulates its target gene β-catenin. This reciprocal repression of miR-181a-5p and ZEB1-AS1 may highlight the significance of RNA–RNA interactions and provide new insights into the mechanisms underlying various aspects of tumorigenesis including tumor proliferation and apoptosis.
Materials and methods
Patients and CRC tissue samples
Sixty-five paired CRC and adjacent non-tumor samples were obtained from patients who underwent surgery at The Affiliated Hospital of Qingdao University. (According to CRC radical surgical principles, we usually cut the intestinal tissue between 5 and 10 cm away from the tumor tissue. The surgical margin was sent to pathology and was considered normal tissue if it was found to be negative (-) for tumor presence.) The postoperative pathologic staging of each subject was determined according to the 7th edition of the Union for International Cancer Control (UICC) tumor-node-metastasis (TNM) staging system for CRC. Tissue samples were collected and immediately snap-frozen in liquid nitrogen and stored at −80°C until further analysis. Prior to the use of these clinical materials for research purposes, written consent was obtained from all patients, and approval from the Hospital Ethics Review Committee was acquired.
Cell lines and culture conditions
Six CRC cell lines (RKO, Caco2, DLD1, HCT116, LOVO and SW480) and HEK293T cells (a human non-CRC cell line) were purchased from the Institute of Biochemistry and Cell Biology of the Chinese Academy of Sciences (Shanghai, China). The above cell lines have often been used in our research as well as other CRC research. All selected CRC cells were epithelial in nature and were cultured as a monolayer for proliferation and apoptosis experiments. Cells were cultured in RPMI 1640 or DMEM (Gibco, Grand Island, NY, USA) medium supplemented with 10% fetal bovine serum (Gibco, USA), 100 U/ml penicillin, and 100 mg/ml streptomycin (Gibco, USA) in humidified air at 37°C with 5% CO2.
RNA extraction, reverse transcription and quantitative real-time PCR (RT–qPCR)
Total RNA was extracted from cell lines and tissue samples using TRIzol reagent (Invitrogen, USA). First-strand cDNA was synthesized with PrimeScript RT Master Mix (TAKARA, Dalian, China). Following reverse transcription from total RNA, qPCR was conducted to examine the expression of ZEB1-AS1 using SYBR Green PCR Master mix (TAKARA, Dalian, China) on a Bio-Rad Real-Time PCR instrument (Bio-Rad, Hercules, California, USA). MiRNA expression was assessed in triplicate using SYBR PrimeScriptTM miRNA RT-PCR Kit (TAKARA, Dalian, China). The sequences of the primers are listed in . Data were analyzed using the ΔΔCt method.
Sirna and mirna transfection
siRNAs targeting ZEB1-AS1 (si#1 and si#2) were synthesized by GenePharma (Shanghai, China); the sequences of these siRNAs are shown in . LOVO and SW480 cells were seeded in 6-well plates before transfection. Lipofectamine 3000 Transfection Reagent (Life Technologies, Grand Island, NY, USA) was used to transfect siRNAs into cells. MiRNA mimics and inhibitors were also synthesized and purified by GenePharma. Cells were transfected with 50 nM miRNA using the Lipofectamine 3000 Reagent (Life Technologies, Grand Island, NY, USA) according to the manufacturer’s protocol. The sequences of the RNAs used for transfections are indicated in .
Plasmid construction and transfection
First-strand ZEB1-AS1 cDNA was synthesized with gene-specific primers using the SuperScript III First-Strand Synthesis System for RT-qPCR (Life Technologies, Grand Island, NY, USA). The entire ZEB1-AS1 sequence was amplified using Platinum Taq DNA Polymerase High Fidelity (Life Technologies, Grand Island, NY, USA). Full length ZEB1-AS1 was then cloned into the pcDNA3.1(+) expression vector (Life Technologies, Grand Island, NY, USA) for overexpression of the lncRNA in CRC cells. For the quantitative evaluation of miRNA activity, the ZEB1-AS1 miRNA target sequence was amplified from NIH 3T3 genomic and cloned into the pmiR-RB-REPORT™ plasmid (ZEB1-AS1-wnt-1, −2; RiboBio, Guangzhou, China). A plasmid containing the target sequence with a mutation in the miRNA binding site was used as a negative control (ZEB1-AS1-mut-1, −2; RiboBio). Mutations were introduced with the KOD-plus mutagenesis kit (Toyobo, Osaka, Japan). Firefly and Renilla luciferase activities were measured using the Dual-Luciferase Reporter Assay system (Promega, Madison, WI, USA). Lipofectamine 3000 Reagent (Life Technologies) was used for plasmid transfections.
Edu incorporation assay
To assess cell proliferation, we used the EdU Cell Proliferation Assay Kit (Ribobio, Guangzhou, China) to detect cell proliferation. Cells were seeded and incubated in 24-well plates. Forty-eight hours after transfection, the EdU cell proliferation assay was performed according to the manufacturer’s protocol. Briefly, the cells were incubated with 50 mM EdU for 3 h before fixation, permeabilization, and EdU staining. The cell nuclei were stained with 1 mg/mL DAPI (Sigma-Aldrich, St. Louis, MO, USA) for 10 min. The proportion of cells that incorporated EdU was determined by fluorescence microscopy.
Celltiter 96® aqueous one solution cell proliferation assay
To detect cell proliferation, we used the CellTiter 96® AQueous One Solution Cell Proliferation Assay kit (Promega) to count cells. Cells (1000 cells/well) were seeded in 96-well plates and then treated with pc-DNA and siRNAs. On day 2, the cell counting reagent was added to replicate wells (one-fifth of the total volume), and incubated for 2 h at 37°C. Absorbance was measured with the multifunctional microplate reader SpectraMax M5 (Molecular Devices, Sunnyvale, CA, USA) every 24 h for 4 days.
Colony formation assay
CRC cells were transfected with pc-DNA or siRNAs for 24 h and were routinely trypsinized and seeded in 6-well plates (1000 cells/well). The medium was changed every three days. After one week in culture, cells were washed with PBS, fixed with 4% paraformaldehyde for 30 min, and then stained with crystal violet for 30 min for visualization and counting.
Flow cytometry
CRC cells were seeded into 6-well plates. Then, cells were transfected, harvested and stained with annexin V-FITC and propidium iodide (PI) according to the manufacturer’s instructions. For growth phase analysis, cells were resuspended in 200 μL PBS and fixed with 70% ice-cold ethanol overnight. Cell cycle distribution was detected using a FACSVerse™ flow cytometer.
Isolation of cytoplasmic/nuclear cell fractions
CRC cell cytoplasmic and nuclear extracts were isolated using the NE-PER Nuclear and Cytoplasmic Extraction Reagents (Thermo Scientific, Waltham, MA, USA). RT-qPCR was used to detect levels of a nuclear control transcript (MALAT1), a cytoplasmic control transcript (GAPDH), lncRNA ZEB1-AS1, and miR-181a-5p in each of the fractions.
Rna-binding protein immunoprecipitation
The Magna RIP RNA-binding protein immunoprecipitation kit (Millipore, Billerica, MA, USA) was used to perform RIP experiments. The Ago2 antibody was purchased from Abcam (Cambridge, MA, USA). All experimental procedures were performed according to the manufacturer’s protocol. Co-precipitated RNAs were analyzed by RT–qPCR.
Protein extraction and western blotting
Cells were washed twice with cold PBS and lysed with RIPA buffer (Thermo Fisher Scientific, Waltham, MA, USA). Protein (40 μg per sample) was separated on a 10% sodium dodecylsulphate-polyacrylamide gel (SDS-PAGE) and transferred onto a PVDF membrane. After the membrane was blocked with 5% skim milk, it was incubated with the appropriate primary antibodies (anti-cyclin D1, CDK4, Rb, p-Rb, caspase-9, caspase-3, β-catenin, TCF4, Myc, MMP-7, and β-actin) overnight at 4°C. All primary antibodies were obtained from Cell Signaling Technology (Beverly, MA, USA) and diluted 1:1000. Membranes were then incubated with an HRP-linked secondary antibody for 1 h (Cell Signaling Technology, USA) at room temperature. The blots were detected using an enhanced chemiluminescence kit (Millipore, Billerica, Massachusetts, USA) and X-ray film.
Statistical analysis
All experiments were performed at least six times, and the mean values and standard deviations (SDs) were calculated. For the proliferation and apoptosis experiments, differences between two groups were analyzed using Student’s t-test. The correlations between ZEB1-AS1 and CRC clinical characteristics were determined using SPSS 22.0 Pearson Chi-square test. A value of P < 0.05 was considered to be statistically significant.
Supplemental Material
Download MS Word (41 KB)Acknowledgments
All authors read and approved the final manuscript. This study was supported by the Natural Science Foundation of Shandong Province (No. ZR2017BH103) and the Youth Foundation of The Affiliated Hospital of Qingdao University.
Disclosure statement
No potential conflict of interest was reported by the authors.
Supplementary material
Supplemental data for this article can be accessed here.
Additional information
Funding
Related Research Data
References
- Torre LA, Bray F, Siegel RL, et al. Global cancer statistics, 2012. CA Cancer J Clin. 2015;65:87–108.
- Siegel R, Naishadham D, Jemal A. Cancer statistics, 2013. CA Cancer J Clin. 2013;63:11–30.
- Shirafkan N, Mansoori B, Mohammadi A, et al. MicroRNAs as novel biomarkers for colorectal cancer: new outlooks. Biomed Pharmacother. 2018;97:1319–1330.
- Hrdlickova B, De Almeida RC, Borek Z, et al. Genetic variation in the non-coding genome: involvement of micro-RNAs and long non-coding RNAs in disease. Biochim Biophys Acta. 2014;1842:1910–1922.
- Muers M. RNA: genome-wide views of long non-coding RNAs. Nat Rev Genet. 2011;12:742.
- Novikova IV, Hennelly SP, Tung CS, et al. Rise of the RNA machines: exploring the structure of long non-coding RNAs. J Mol Biol. 2013;425:3731–3746.
- Saha P, Verma S, Pathak RU, et al. Long noncoding RNAs in mammalian development and diseases. Adv Exp Med Biol. 2017;1008:155–198.
- Delás MJ, Hannon GJ. lncRNAs in development and disease: from functions to mechanisms. Open Biol. 2017;7.
- Su W, Xu M, Chen X, et al. Long noncoding RNA ZEB1-AS1 epigenetically regulates the expressions of ZEB1 and downstream molecules in prostate cancer. Mol Cancer. 2017;16:142.
- Liu C, Pan C, Cai Y, et al. Interplay between long noncoding RNA ZEB1-AS1 and miR-200s regulates osteosarcoma cell proliferation and migration. J Cell Biochem. 2017;118:2250–2260.
- Li T, Xie J, Shen C, et al. Upregulation of long noncoding RNA ZEB1-AS1 promotes tumor metastasis and predicts poor prognosis in hepatocellular carcinoma. Oncogene. 2016;35:1575–1584.
- Fu J, Cui Y. Long noncoding RNA ZEB1-AS1 expression predicts progression and poor prognosis of colorectal cancer. Int J Biol Markers. 2017;32:e428–e433.
- Nam JW, Rissland OS, Koppstein D, et al. Global analyses of the effect of different cellular contexts on microRNA targeting. Mol Cell. 2014;53:1031–1043.
- Da Sacco L, Masotti A. Recent insights and novel bioinformatics tools to understand the role of microRNAs binding to 5ʹ untranslated region. Int J Mol Sci. 2012;14:480–495.
- Li F, Li Q, Wu X. Construction and analysis for differentially expressed long non-coding RNAs and MicroRNAs mediated competing endogenous RNA network in colon cancer. PLoS One. 2018;13:e0192494.
- Cesana M, Cacchiarelli D, Legnini I, et al. A long noncoding RNA controls muscle differentiation by functioning as a competing endogenous RNA. Cell. 2011;147:358–369.
- DeOcesano-Pereira C, Amaral MS, Parreira KS, et al. Retraction: long non-coding RNA INXS is a critical mediator of BCL-XS induced apoptosis. Nucleic Acids Res. 2016;44:9518.
- Kim K, Jutooru I, Chadalapaka G, et al. HOTAIR is a negative prognostic factor and exhibits pro-oncogenic activity in pancreatic cancer. Oncogene. 2013;32:1616–1625.
- Li XL, Subramanian M, Jones MF, et al. Long noncoding RNA PURPL suppresses basal p53 levels and promotes tumorigenicity in colorectal cancer. Cell Rep. 2017;20:2408–2423.
- Shan TD, Xu JH, Yu T, et al. Knockdown of linc-POU3F3 suppresses the proliferation, apoptosis, and migration resistance of colorectal cancer. Oncotarget. 2016;7:961–975.
- Yu T, Shan TD, Li JY, et al. Knockdown of linc-UFC1 suppresses proliferation and induces apoptosis of colorectal cancer. Cell Death Dis. 2016;7:e2228.
- Tran DDH, Kessler C, Niehus SE, et al. Myc target gene, long intergenic noncoding RNA, Linc00176 in hepatocellular carcinoma regulates cell cycle and cell survival by titrating tumor suppressor microRNAs. Oncogene 2017;37:75–85.
- Conte F, Fiscon G, Chiara M, et al. Role of the long non-coding RNA PVT1 in the dysregulation of the ceRNA-ceRNA network in human breast cancer. PLoS One. 2017;12:e0171661.
- Proto MC, Fiore D, Piscopo C, et al. Inhibition of Wnt/β-catenin pathway and histone acetyltransferase activity by rimonabant: a therapeutic target for colon cancer. Sci Rep. 2017;7:11678.
- Yang G, Shen T, Yi X, et al. Crosstalk between long non-coding RNAs and Wnt/β-catenin signalling in cancer. J Cell Mol Med. 2018;22:2062–2070, Epub ahead of print
- Paluszczak J, Kleszcz R, Studzińska-Sroka E, et al. Lichen-derived caperatic acid and physodic acid inhibit Wnt signaling in colorectal cancer cells. Mol Cell Biochem 2017;441:109–124.
- Chen L, Hu N, Wang C, et al. Long non-coding RNA CCAT1 promotes multiple myeloma progression by acting as a molecular sponge of miR-181a-5p to modulate HOXA1 expression. Cell Cycle. 2018;1–11.
- Li Y, Kuscu C, Banach A, et al. miR-181a-5p inhibits cancer cell migration and angiogenesis via downregulation of matrix metalloproteinase-14. Cancer Res. 2015;75:2674–2685.
- Yang M, Zhai X, Ge T, et al. MiR-181a-5p promotes proliferation and invasion, and inhibits apoptosis of cervical cancer cells via regulating inositol polyphosphate-5-phosphatase A (INPP5A). Oncol Res 2017;26:703–712.
- Han P, Li JW, Zhang BM, et al. The lncRNA CRNDE promotes colorectal cancer cell proliferation and chemoresistance via miR-181a-5p-mediated regulation of Wnt/β-catenin signaling. Mol Cancer. 2017;16:9.