
 ?Mathematical formulae have been encoded as MathML and are displayed in this HTML version using MathJax in order to improve their display. Uncheck the box to turn MathJax off. This feature requires Javascript. Click on a formula to zoom.
ABSTRACT
DNA damage in cells occurs from both endogenous and exogenous sources, and failure to repair such damage is associated with the emergence of different cancers, neurological disorders and aging. DNA damage responses (DDR) in cells are closely associated with the cell cycle. While most of our knowledge of DDR comes from bulk biochemistry, such methods require cells to be arrested at specific stages for cell cycle studies, potentially altering measured responses; nor is cell to cell variability in DDR or direct cell-level correlation of two response metrics measured in such methods. To overcome these limitations we developed a microscopy-based assay for determining cell cycle stages over large cell numbers. This method can be used to study cell-cycle-dependent DDR in cultured cells without the need for cell synchronization. Upon DNA damage γH2A.X induction was correlated to nuclear enrichment of p53 on a cell-by-cell basis and in a cell cycle dependent manner. Imaging-based cell cycle staging was combined with single molecule P53 mRNA detection and immunofluorescence for p53 protein in the very same cells to reveal an intriguing repression of P53 transcript numbers due to reduced transcription across different stages of the cell cycle during DNA damage. Our study hints at an unexplored mechanism for p53 regulation and underscores the importance of measuring single cell level responses to DNA damage.
Introduction
Potential sources of damage to genetic material of cells are common in the environment. These can be both endogenous, like reactive oxygen species produced as byproducts of cellular metabolism [Citation1], replication errors or modification of bases [Citation2], or exogenous, like radiation or environmental mutagens. DNA damage, if unrepaired, is associated with increased risk of different cancers, neurological disorders and premature aging [Citation2]. Cellular responses to these damages not only depend on the type of damage but also on the cell cycle stage of the cell. For example, homologous recombination (HR) is specific to cells in S and G2 phases of the cell cycle. This is the case even when the alternative to HR, non-homologous end joining (NHEJ), is known to be more error-prone [Citation3]. Possible cell cycle dependence of base excision repair and mismatch repair have also been investigated, where the former was found to peak in G1 phase while the latter in S phase [Citation4,Citation5]. Major cell cycle checkpoints are known to regulate DNA damage responses (DDR) and many important oncogenes and tumor-suppressor genes, which are mutated in different cancers, are implicated also in cell cycle regulation [Citation6–Citation8].
A number of studies have reported on the cell cycle regulation of DDR and the genes involved in different repair pathways [Citation9–Citation15]. Most of these studies employ elegant methods of bulk biochemistry or flow cytometry. However, bulk biochemistry measures the mean level responses in a population of cells, and necessitates cell synchronization in cell cycle studies [Citation16–Citation18], which in itself may alter the measured response. For example, aphidicolin blocks used to synchronize cells at the G1-S boundary can induce replication stress and activate ATR [Citation19]; similarly serum starvation or double thymidine blocks have their own caveats [Citation20–Citation22]. Such bulk biochemistry-based techniques also cannot report on cell to cell variability of DDR or subcellular localization of gene products nor do they yield information about possible correlations between two measured responses on a cell-by-cell basis [Citation23,Citation24]. Flow cytometry does report on the cell-to-cell variability in a population of cells [Citation25] but lacks localization information and cannot be combined with the methods which yield absolute transcript counts like single-molecule RNA fluorescence in situ hybridization (smFISH) [Citation26–Citation28]. To overcome these limitations we report a microscopy-based technique to study the cell cycle dependence of DDR in asynchronous cells in culture. A few previous studies have attempted to infer cell cycle stage from DNA content in microscopy images but were limited to low cell numbers [Citation29]. A recent study reported a great improvement on this front [Citation30]. Here we used a similar approach, which we validated against different cell cycle markers. We combined the method with the counting of individual RNA molecules opening up a new avenue of studying cell-level transcriptional responses. We studied cell cycle dependent γH2A.X induction, as a proxy for DDR activation, with p53 regulation in terms of transcription, translation, localization and phosphorylation on a cell-by-cell basis, thus integrating the different facets of p53 function. We show that during DNA damage, P53 is not only translationally regulated but intriguingly is also transcriptionally repressed. Our studies open up a whole new avenue for studying DDR at a single-cell resolution.
Results
Microscopy-based cell cycle staging
DNA damage response (DDR) involves an interplay of different protein pathways [Citation31] which finally leads to the repair of the damage or the elimination of the damaged cell. Though there are preferred repair pathways based on the cell cycle stage the cell is in, many proteins are found common among different repair pathways [Citation32]. Which is why instead of investigating individual marker proteins in isolation, it becomes important to simultaneously interrogate more than one protein and their interaction at a time. Here we report a microscopy-based cell cycle staging of cells which can be employed to investigate regulation of more than one gene simultaneously – at protein and transcript level – and their post-translational modifications like phosphorylation, which form major benchmarks in DDR.
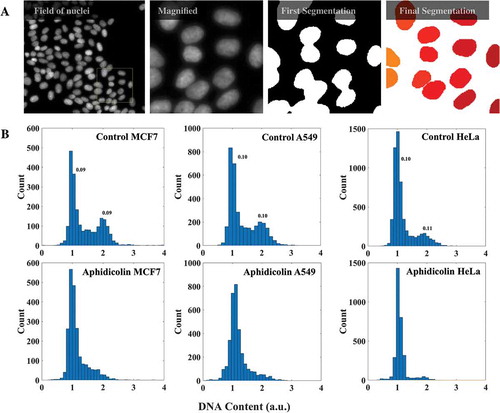
The principle behind the method is the same as that of the conventional flow cytometry: cells are staged according to their DNA content obtained from the fluorescence intensities of DNA binding dyes. Cells stained for DNA were imaged with the appropriate stack numbers (Materials and Methods). The average projection of such stacks was then used to identify individual nuclei in the field using a fully automated Matlab routine ()). The total intensity of a nucleus thus identified was regarded as its DNA content. Automated imaging and analysis over several hundreds to thousands of nuclei yielded the expected bimodal distribution of DNA content in a population of cells corresponding to G1 and G2 peaks. ) shows the comparison of such distributions between asynchronous cells and cells arrested at G1/S boundary using aphidicolin – a potent inhibitor of B-family of DNA polymerases – for three different cell lines: MCF7, A549 and HeLa. As expected the populations of cells treated with aphidicolin had their G2/M peaks suppressed when compared with control cells corroborating that the measured distribution of DNA content was indeed related to the cell cycle. Further, the coefficients of variation for G1- and G2-peak were comparable with those obtained with similar analysis from a conventional flow cytometer (Supplementary Figure S1). The above observations suggest that the numbers (intensity values) obtained for the nuclei from the image analysis could indeed reflect the DNA content of the corresponding nuclei. To further check the applicability of our microscopy-based cell cycle staging, we tested it against different cell cycle markers, at both transcript and protein levels, in HeLa cells.
Figure 1. DNA content analysis with imaging. (a) A field of HeLa cells with DNA stained with DAPI is shown. The yellow box is shown magnified on the right. From images like these the nuclear masks were obtained from a fully automated Matlab program for evaluation of DNA content. (b) DNA content histograms of mock and aphidicolin treated MCF7 (2250 cells), A549 (3480 cells) and HeLa cells (3190 cells). Numbers on the peaks are corresponding coefficients of variation. (See also Supplementary Figure S1.).
Cell cycle stages obtained from image analysis conform with the expression profiles of cell cycle markers
Cyclins are known primarily for their roles in the regulation of cell cycle progression by associating with cyclin-dependent kinases (CDKs). Cyclin A and cyclin E, in particular, are known to play critical roles in the regulation of the transitioning of a cell from one cell cycle phase to the other: cyclin E regulates G1 to S transition [Citation33] while cyclin A, depending upon the CDK it associates with, regulates S to G2 and G2 to M transitions [Citation34]. It is known that Cyclin A expression – protein and mRNA – peaks in late G2 and early M [Citation35] while Cyclin E expression – protein and mRNA – peaks in G1 phase through a combination of regulated expression and degradation [Citation36]. Because of this complementarity of their expressions, we tested the microscopy-based cell cycle staging presented here against them by performing smFISH for both the cyclins simultaneously on the same population of cells ()). The DNA content analysis presented here was conveniently merged with the spot-counting algorithm for mRNA spots due to its easy integrability with other analysis tools.
Figure 2. Cell cycle staging from imaging conforms with the expression profiles of histone and cyclin mRNAs. (a) smFISH was done for Cyclin E1 and Cyclin A2 simultaneously on the same population of HeLa cells (376 cells in total. Scale bar: 10μm). (b, c, d) Distributions of Cyclin E1 (CCNE1), Cyclin A2 (CCNA2) and Histone H4 (Hist1H4E) mRNAs with respect to DNA content. Each dot represents an individual cell. (E, F, G) Mean mRNA numbers for Cyclin E1, Cyclin A2 and Histone H4 in respective cell cycle phases. The mean mRNA counts for Cyclin E1 for cells in G1, S and G2 phases of the cell cycle were 27 ± 1, 23 ± 2 and 17 ± 1 respectively while for Cyclin A2 they were 24 ± 2, 111 ± 11 and 186 ± 9 and for Histone H4 they were 199 ± 20, 1057 ± 120 and 586 ± 132. On average, G2/M cells had the highest number of Cyclin A2 mRNA and lowest of Cyclin E1 mRNA and vice versa for G1 cells. Histone H4 mRNA number peaked in the S phase as obtained from the analysis (284 cells in total). (Errorbars are standard errors. See also Supplementary Figure S2-A and S2-B.).
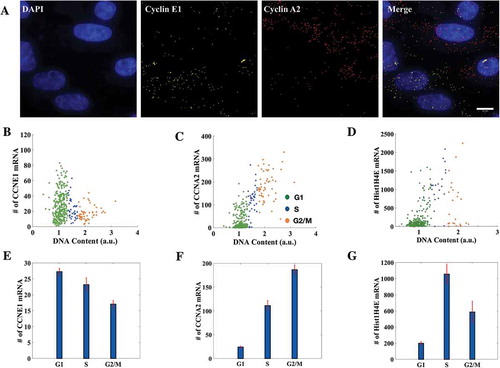
We observed that though the mRNA counts in individual phases of the cell cycle for both the cyclins were spread across a wide range of values, those cells identified as G1-phase cells from the analysis had the highest average count for Cyclin E1 and lowest for Cyclin A2, while the trend reversed for G2-phase cells as expected (,c)). Moreover, simultaneous performance of smFISH for Cyclin A2 and Cyclin E1 helped us capture the anti-correlatedness of their expression profiles with DNA content (,)). Interestingly while the mean trend was as expected, the scatter plots for mRNA numbers (,)) showed a clear correlation with DNA content for Cyclin A2 mRNA counts, while the anti-correlation was less apparent for Cyclin E1 mRNA. As the cell goes through the cell cycle and grows in size, mean transcription is thought to increase as more cellular machinery for gene expression is available to the cell. Thus a lot of cell-to-cell variability is explained by the simple fact of the cell growing larger as demonstrated before [Citation37]. For Cyclin E1, the specific cell cycle dependent transcriptional down regulation (whether by decreased production or increased degradation of transcripts) may be partially offset by the general tendency for increased transcription as cells progress into G2; while for Cyclin A2, the two effects would act in concert. This may explain the observed trends in the scatter plots. A similar trend was also seen even at protein levels for the cell cycle marker proteins cdt1 and geminin (Supplementary Figure S2-A). The presence of cdt1 and geminin in a cell marks G1 and G2 phases respectively; for this reason they are used in FUCCI (fluorescent ubiquitination-based cell cycle indicator)-based cell cycle staging of live cells [Citation38]. We immunostained the cells for cdt1 and geminin and observed again that the cell cycle stages obtained from the microscopy conformed with the expression profiles of the proteins (Supplementary Figure S2-A). A similar trend like the Cyclin mRNAs was seen with a stronger correlation and differential expression for geminin, which peaks in G2, as opposed to cdt1, which peaks in G1.
To further corroborate the efficacy of our method, we tested it against the expression profile of Histone H4 across the cell cycle. Transcription of histone genes is strongly coupled to the S phase of the cell cycle [Citation39,Citation40] and has been used for the determination of cell cycle stage in smFISH experiments [Citation37]. Here we aimed to capture the observed correspondence between transcript numbers of a Histone H4 family member, Hist1H4E, and the cell cycle from our image-based cell cycle staging. As expected, the cells classified as S-phase cells had the highest average count for Hist1H4E transcripts ()). The expression profile captured the fact that histone transcription peaks in S phase of the cell cycle determined from DNA content ()) despite the cell-to-cell variability which also was reported previously [Citation37].
Taken together, we have shown that the microscopy-based cell cycle staging of cells proposed here is as good as, or perhaps even better than, conventional flow cytometry offering spatial resolution and the ability to access absolute transcript counts at the same time.
Correlation between nuclear p53 and γH2A.X levels increases in DNA damaged cells
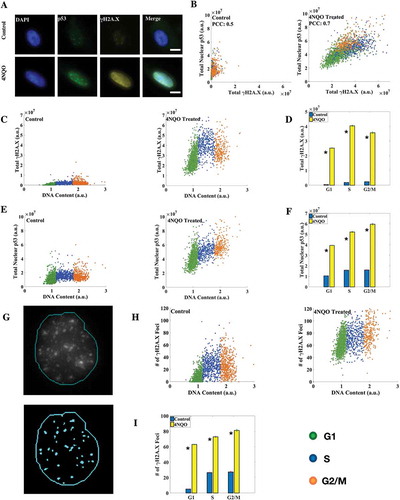
With the cell cycle staging method standardized, we used it to study the cell cycle regulation of different DNA damage markers. It is known that damage in DNA is followed by rapid rounds of histone modifications to facilitate DNA damage repair [Citation41,Citation42]. One such modification is the phosphorylation of core histone variant H2A.X at serine 139, known generally as γH2A.X, within minutes of DNA double strand breaks (DSBs) by the kinase ATM [Citation43]. H2A.X can get phosphorylated to up to 0.5 to 2 Mb across the DSB and hence γH2A.X foci are considered as markers of DSBs. Besides, it plays an important role in cell cycle arrest via the p53 pathway [Citation43]. p53 is an important transcription factor known for its tumor-suppressor role and is most frequently found mutated in human cancer [Citation44]. It is implicated in major DNA repair pathways and is involved in regulating cell cycle by arresting cells in different phases of the cell cycle during DNA damage [Citation43,Citation45]. Furthermore, it is known that p53 is mainly regulated at translational levels by Mdm2 via inhibitory interactions with ribosome protein L26 [Citation46,Citation47]. We sought to employ our method to obtain a cell-by-cell correlation of γH2A.X and p53 levels and localization across the cell cycle in control and DNA damaged cells. 4-nitroquinoline 1-oxide (4NQO), a UV-mimetic drug, was used to induce DNA damage in cells at 2g/ml concentration for 2 hours ()). Both UV and 4NQO are known to induce γH2A.X in cells [Citation48–Citation50]. We observed that while in control cells γH2A.X levels increased linearly with the DNA content, in DNA damaged cells γH2A.X levels peaked in the S phase as was reported previously [Citation12] (,)). Nuclear levels of p53 however showed a linear correlation with DNA content in both DNA damaged and control cells (,)). At the same time the correlation between nuclear p53 and γH2A.X levels improved significantly in DNA damaged cells over Control cells ()). We also counted γH2A.X foci in cells using an automated foci-detection algorithm in Matlab ()). Cell cycle distributions of γH2A.X foci counts were somewhat distinct from the corresponding γH2A.X intensities (,)), indicating that intensity and foci count may not simply be proxies for each other. The mean number of γH2A.X foci in control cells in G1, S and G2/M phases were found to be 5.17 ± 0.18, 26.55 ± 0.64 and 27.34 ± 0.82 respectively, while the numbers for DNA damaged cells were 62.93 ± 0.35, 72.96 ± 0.83 and 81.35 ± 1.25 respectively ()). A similar response in terms of γH2A.X and p53 levels was observed in another cell line (HeLa) studied (Supplementary Figure S3).
Figure 3. Correlation between nuclear p53 and γH2A.X levels increases upon DNA damage. (a) Immunofluorescence (IF) for p53 and γH2A.X in A549 cells (scale bar: 10 μm). (b) Correlation coefficient between γH2A.X and p53 levels increased in DNA damaged cells. (c, e) Distribution of γH2A.X and p53 with DNA content in control and 4NQO-treated cells. γH2A.X levels linearly increased in control cells while they peaked in the S phase in DNA damaged cells. (d) Mean levels of total nuclear γH2A.X. A large induction of γH2A.X in DNA damaged cells in all the phases of the cell cycle was observed. (f) Mean levels of total nuclear p53. Significant induction of nuclear p53 in DNA damaged cells was observed. (g) Results of the γH2A.X foci detection algorithm in Matlab. Most of the observed foci were identified. The thin line represents the nuclear boundary. (h) γH2A.X foci number distribution in control and DNA damaged cells. (i) Average number of γH2A.X foci in the respective phases of the cell cycle. The fold change here is smaller than that for γH2A.X protein levels, as larger and more intense foci are formed in damaged cells without affecting foci count. All differences are significant with p-value < 0.05 (K-S test). (Errorbars are standard errors. The analysis was done on 5000 cells for each plot. See also Supplementary Figures S3 and S4.).
DNA damage response involves phosphorylation of DNA repair proteins to activate their repair functions and enhance their stability. For example, during DNA damage p53 is phosphorylated at serine 15 (p53-pS15) and serine 46 (p53-pS46). The former is known to promote stabilization of p53 on DNA damage [Citation51] while the latter is thought to be involved in different aspects of DDR of which apoptosis is just one [Citation52,Citation53]. We investigated the correlations between p53 phosphorylated at serine 15 (p53-pS15) and at serine 46 (p53-pS46) (Supplementary Figure S4). We observed that the correlation between p53-pS46 and p53-pS15 increased in DNA damaged – but non-apoptotic – cells with both the forms reflecting an increased damage response.
Together the above observations highlight two major advantages of our microscopic analysis of the cell cycle: first, increase in p53 can be measured specifically in the nuclear compartment, as there is a handle of localization; second, in addition to γH2A.X intensity, the number of γH2A.X foci can also be measured. While both microscopic and flow cytometric analysis report the induction of γH2A.X in DNA damaged cells, such counts of γH2A.X foci or nuclear enrichment of p53 in a given nucleus is inaccessible by flow cytometry.
Transcriptional repression of P53 upon DNA damage
It is known that p53 protein induction upon DNA damage is regulated at the level of translation by Mdm2 via inhibitory interactions with ribosome protein L26 [Citation47,Citation54,Citation55]; but the transcriptional contribution to the induction remains unclear. While p53 protein is induced upon genotoxic stress, P53 mRNA levels are thought to be unaffected [Citation55,Citation56]. However, P53 transcription is thought to be cell cycle dependent from previous bulk biochemical studies using synchronized cells [Citation17,Citation18]. We integrated microscopy-based DNA content analysis with immunofluorescence (IF) for p53 protein and smFISH for P53 mRNA to simultaneously investigate cell cycle-dependent regulation of the P53 gene at transcriptional and translational levels during DNA damage in the very same cells ()) in an asynchronous culture.
Figure 4. Transcriptional and translational regulation of P53. (a) smFISH for P53 RNA was combined with IF for p53 protein in A549 cells (scale bar: 10 μm). (b) Correlation between P53 mRNA number and protein levels decreased in DNA damaged cells. (c, e) Cell cycle distribution of P53 mRNA number and nuclear-to-cytoplasmic ratio of mean levels of p53. (d) Mean P53 mRNA counts in DNA damaged and control cells in respective cell cycle phases. mRNA count is consistently lower in DNA damaged cells. The average numbers of P53 mRNA in control cells in G1, S and G2/M phases of the cell cycle are 59 ± 1, 73 ± 3, 79 ± 3 while for DNA damaged cells they are 52 ± 1, 65 ± 2, 74 ± 3. (f) Nuclear to cytoplasmic ratio of mean levels of p53 protein goes up in DNA damaged cells and remains constant throughout the cell cycle in both DNA damaged and control cells. All differences are significant with p-value < 0.05 (K-S test). (Errorbars are standard errors. The analysis was done on 410 cells each. See also Supplementary Figures S5, S6-A, S6-B and S7.).
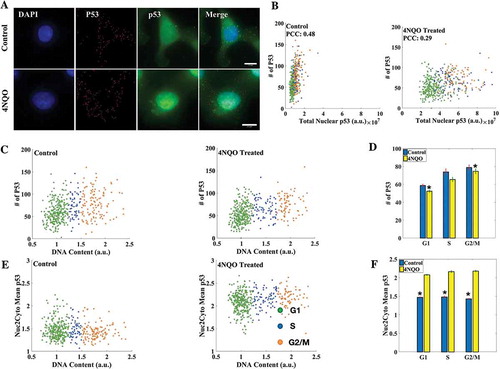
The nuclear expression of p53 protein levels obtained from IF when combined with smFISH for P53 followed the same trend across the cell cycle as was observed when IF for p53 was done in isolation (,) and Supplementary Figure S5). We observed a poor correlation between P53 mRNA and protein levels in both control and DNA damaged cells. Furthermore, when P53 mRNA expression was looked at in isolation, we found that while P53 mRNA counts increased as the cells progressed in the cell cycle both in control and DNA damaged cells, the average P53 mRNA count surprisingly was found to be consistently lower in DNA damaged cells than that in Control cells in all the phases of the cell cycle (,d)). A similar and even more pronounced repression was observed in two different cell lines studied, HeLa and MCF7 (Supplementary Figure S6-A and S6-B). The observed repression in P53 mRNA count in DNA damaged cells could be due to reduced transcription or increased degradation of P53 mRNA. To identify which of the two was responsible we blocked transcription in cells with DRB. We observed that when treated with DRB the repression in P53 mRNA count in 4NQO-treated cells when compared with control cells was almost entirely absent across the cell cycle in three cell lines studied (A549, MCF7, HeLa). These observations suggest that that the repression observed in P53 mRNA count is due to impaired transcription in DNA-damaged cells and not due to active degradation (Supplementary Figure S7). The reasons for this transcriptional repression of P53 inferred by investigating absolute RNA counts across the cell cycle, along with translational induction of p53 protein, remain to be investigated.
Another aspect of p53 regulation during DNA damage is its stabilization and nuclear export. It is known that in normal cells most of p53 pool in cells is produced and degraded in the cytoplasm itself [Citation57], while in DNA damaged cells p53 is exported to the nucleus and once the cell recovers from the damage is mainly degraded in the nucleus itself [Citation58]. To investigate if nuclear localization of p53 during DNA damage is favored in any particular phase of the cell cycle, we measured the nuclear to cytoplasmic ratio of mean levels of p53 in DNA damaged and control cells. We observed a significant increase in the ratio in DNA damaged cells when compared with control cells indicating nuclear accumulation and stabilization of p53. Despite this increased stabilization and localization of p53 in the nucleus the mean levels of the nuclear to cytoplasmic ratio of mean levels of p53 remained constant across the cell cycle in both control and DNA damaged cells (,)).
Together the results show that though there is an increase in p53 expression in DNA damaged cells, there is there is surprising decrease in the number of P53 mRNA in damaged cells when compared with control cells due to reduced transcription. This indicates that though p53 protein induction is primarily regulated at translational level, there is an underlying mechanism regulating P53 transcription during DNA damage across the cell cycle. And in spite of the poor correlation observed between P53 transcript number and protein levels hinting at a possible decoupling between the two processes, the observed repression of P53 transcription could possibly have a role to play in p53-mediated DDR, requiring further investigation.
Discussion
The cell cycle is known to be an important regulator of DNA damage repair. Based on the cell cycle stage the cell is in, it might prefer one repair pathway to another [Citation3] or might decide to repress the repair altogether: for example, DNA repair is known to be repressed in the mitotic phase of the cell cycle for double-strand breaks [Citation59]. The existing methods to study DDR in the context of cell cycle using bulk biochemistry or flow cytometry either do not report on cell-to-cell heterogeneity or subcellular localization of gene products. Direct correlations between mRNA counts or number of damage foci, with DDR proteins are also not possible. Recently smFISH has been combined with flow cytometry, but this assay still reports on relative intensities and not absolute transcript counts like microscopy [Citation60,Citation61]. In a different context of stem cell differentiation, smFISH has been combined with imaging-based DNA content analysis, but the cell cycle resolution was poorer in that study [Citation62]. FUCCI-based assays limit the number of fluorophores which can be used to study responses. To address the limitations of the existing methods, we devised a microscopy-based technique for studying cell cycle dependent DDR while preserving access to statistics over high cell numbers. The DNA content histograms obtained showed a clear bimodality with peaks corresponding to G1 and G2 cells, as in a previous study [Citation30]. By combining microscopy-based cell cycle staging with smFISH, we counted the average number of Cyclin A2 and Cyclin E1 transcripts in different phases of the cell cycle and showed that the cell cycle stages obtained from the analysis correctly correspond to the expression profiles of these cyclins. Together, we believe that the method presented here may provide richer information about the cell cycle regulated processes. We then applied our method to the study of p53 regulation upon DNA damage, in terms of levels, localization and phosphorylation, in relation to γH2A.X induction as a proxy for DDR activation.
The variant histone H2A.X is phosphorylated at Serine 139 by the master ATM/ATR kinases in response to DNA damage, and is called γH2A.X in this form. Through downstream kinases ATM/ATR also target p53. We found that γH2A.X became correlated more strongly to the nuclear enrichment of p53 upon DNA damage. γH2A.X levels peaked in S-phase in DNA damaged cells, while p53 protein levels showed a linear dependence on DNA content both in control and DNA damaged cells. p53 function may be controlled at various levels through transcription, translation, localization and phosphorylation, all of which need to be addressed for insight into p53 regulation. Because DDR in itself may be cell cycle dependent, another important factor regulating p53 is the cell cycle. Our microscopy-based method could address all these aspects of p53 regulation allowing us to investigate the interplay of more than one factor simultaneously in the same cell. Single molecule detection for P53 transcripts was combined with immunofluorescence detection of p53 protein in the very same cells to reveal an unexpected cell cycle dependent repression of P53 transcription upon DNA damage, while the protein was induced. On further investigation the repression was attributed to impaired transcription during DNA damage. At the same time we observed that the correlation between P53 mRNA count and nuclear enrichment of p53 protein remained poor in both control and DNA damaged cells, suggesting a possible decoupling of transcription and translation. Finally, we also looked at the nuclear transport of p53 protein across the cell cycle in control and DNA damaged cells by measuring the nuclear-to-cytoplasmic ratio of mean levels of p53. We observed that though nuclear-to-cytoplasmic ratio of mean levels of p53 increased significantly in DNA damaged cells over control cells, the ratio remained constant throughout the cell cycle in both control and DNA damaged cells. A similar trend of responses was observed for P53 expression in MCF7 and HeLa cells at both protein and mRNA levels. It is known that p53 protein is rapidly degraded in HeLa cells due HPV E6 activity [Citation63], but P53 transcription is thought to be normal. These observations suggest that though the induction p53 upon DNA damage lies primarily at the level of translation as reported before [Citation47,Citation54], it is regulated both at transcriptional and translational levels during DDR. Usually in mammalian cells, DDR is primarily regulated by phosphorylation cascades rather than gene expression changes, but opposing transcriptional and translational control may operate for the master regulator p53. In the future, it will be interesting to see how P53 transcript numbers change with the change in DNA damage, dosage and time of treatment. Furthermore, with the microscopic potential and the easy integrability of the technique presented here with different analysis tools, it can prove to be a great aid in studying a variety of cell cycle regulated processes.
Materials and methods
Cell culture
Cells were grown in Full Medium (DMEM supplemented with 10% fetal bovine serum to which 1% penicillin-streptomycin was added). Cells were assigned their cell cycle stages based on their DNA content. DNA content of a cell was estimated by staining the genomic DNA with 4ʹ,6-diamidino-2- phenylindole (DAPI). DAPI is a cell-permeable minor groove binder dye with a preference for binding to two or more consecutive A-T base pairs with excitation maximum at 358 nm and emission maximum at 461 nm [Citation64]. DAPI staining was done using standard fixation and permeabilization protocol briefly described here: Fixation was performed with 4% paraformaldehyde (PFA) in PBS (10 minutes) followed by permeabilization with 0.3% Triton-x 100 in PBS (10 minutes). The cells were then washed with PBS and placed in 2 g/ml DAPI in PBS for 7–10 minutes. The cells were then imaged with freshly-made 0.1% p-PDA (p-phenylene diamine) in PBS as a mounting medium.
To study DDR, cells were grown on two glass-bottom plates. One of the plates (DNA damaged) had the cells treated with g/ml 4NQO (1 mg/ml stock solution of 4-nitro-quinoline 1-oxide in DMSO was used) in Full Medium for 120 minutes while the other one (Control) had cells mock treated with an equal amount of DMSO (dimethyl sulfoxide) in Full Medium for equal amount of time. The cells in both the plates were immediately fixed following the above steps.
To arrest the population of cells at G1/S boundary cells were treated with 10 g/ml aphidicolin in Full Medium for 30 hours. Aphidicolin is a potent inhibitor of B family of DNA polymerases.
To block the transcription cells were pre-treated with 150 M DRB for 90 minutes after which 4NQO or DMSO was added to the same media containing DRB for further experiments.
Flow cytometric analysis
Cells were grown on a 35 mm plastic-bottom plate till confluency. After which the cells were detached from the surface with trypsin. The cells were then transferred into a 15 ml falcon tube and trypsin was de-activated by Full Medium (DMEM (Dulbecco Modified Eagle Medium) with 10% FBS (fetal bovine serum), 1% penicillin and streptomycin) added thrice the quantity of trypsin used for the detachment of the cells. The cell mix was then spun at 300xg for 10 minutes and supernatant was discarded. The pellet was resuspended in 4% PFA (para-formaldehyde) in PBS (phosphate buffered saline) for fixation (10 minutes). The cell-PFA mix was again spun at 300xg for 10 minutes and supernatant was discarded. The pellet then was resuspended in 0.3% Triton X-100 in PBS (10 minutes) for permeabilization. It was followed by spinning at 300xg for 10 minutes. The supernatant was discarded and the pellet was resuspended with 2 g/ml DAPI in PBS. After incubation of 7–10 minutes with DAPI, the cell-DAPI mix was spun at 300xg for 10 minutes and the pellet obtained was resuspended in PBS and was taken to flow cytometer (Cytoflex S, Beckman Coulter) for further analysis.
Immunofluorescence (IF)
The cells were grown, fixed and permeabilized with the exact same steps as described in the previous section. After permeabilization the cells were blocked with 5% BSA (bovine serum albumin) in PBS (Block) for an hour. This was followed by the treatment with primary antibodies (with dilution according to manufacturers’ instructions) in Block. The cells were incubated overnight with the primary antibodies at 4°C. On the next day, the primary antibodies were washed out from the plate and cells were incubated with the secondary antibodies diluted (as recommended by manufacturers) in Block and were left for incubation for 120 minutes at RT. After which the cells were stained for DAPI as described earlier. The cells were imaged with freshly-made 0.1% p-PDA in PBS as the mountant.
cdt1 (4656), phospho-p53 at ser46 (2521) and p53 (7F5) antibodies were procured from Cell Signaling Technologies, γH2A.X (05–636) antibodies from Merck Millipore, and p53 (ab131442) and geminin (ab104306) from Abcam. Dilutions were made as recommended by the manufacturers. p53 was stained using Abcam (ab131442) or Cell Signaling Technologies (7F5) antibodies.
Single molecule fluorescence in situ hybridization (smFISH)
Single transcript detection has been described before [Citation26–Citation28]. In brief, the cells were grown on glass-bottom plates in Full Medium and fixed with 4% PFA in PBS. After which the cells were kept in 70% reagent grade ethanol overnight at 4°C for permeabilization. The next day, the cells were washed with Wash Buffer (10% de-ionized formamide in 2xSSC) for 5 minutes. Hybridization mix was prepared: 135 l Stellaris Hybridization buffer + 15
l de-ionized formamide + 2
l probe solution (10
M). Wash buffer was replaced with the Hybridization mix and the cells were kept for an overnight incubation at 37°C. The cells were then washed thrice with Wash Buffer at RT for 5 minutes and were stained with DAPI for 7 minutes in Wash Buffer. The cells were imaged with 0.1% p-PDA as the mounting medium.
Cyclin A2, Cyclin E1 and Hist1H4E mRNA probe sequences were designed with the Stellaris Probe Designer by Biosearch Technologies and were ordered from the same source. The probes sequences are available in Supplementary Table S1. P53 probes were procured directly from Biosearch Technologies (VSMF-2422–5).
Combined smFISH and IF
The antibodies of the interest pre-conjugated with the fluorophore was added directly to the hybridization mix in the FISH protocol. The rest of the steps remained the same as in standard fluorescence in situ hybridization. For p53 experiments we used p53 antibodies pre-conjugated with Alexa-488 fluorophore (Cell Signaling #5429) of the same clone (7F5) as was used in IF experiments.
Microscopy
Cells were imaged on fully automated inverted microscope Olympus IX83 with a Retiga 6000 camera (QIMaging). Number of planes to be imaged were decided based on the objective used. For 40x five planes at 1.94 μm apart and for 60x seventeen planes at 0.4 μm apart. We used 0.1% p-PDA as the anti-fade. The images thus obtained were analyzed in a Matlab routine. The cells were staged according to their DNA content obtained from the images from DAPI channel. The images from DAPI channel were processed to segment out nuclei in a field of image using a fully-automated Matlab routine based on watershed segmentation. The artefacts from image processing were removed using size and shape criteria. The images in RNA experiments were taken with a 60X, 1.42 NA oil objective. The rest of the experiments were imaged with a 40X, 0.75 NA air objective.
Image analysis
The average projected image of a stack obtained from DAPI-channel was used for nuclear segmentation. The images were first processed to smoothen out nuclear intensities after which the cells were segmented using marker-based watershed segmentation. The resultant image with nuclei identified was further filtered using shape and size criteria to remove artefacts. The total intensities of nuclei thus identified in an average projected image were taken to be the DNA contents of those nuclei. The same mask was used to measure protein levels of other nuclear proteins. The cells were segmented manually for mRNA counting. The cell boundaries were identified from the autofluorescence intensities from cells. In case of ambiguities, the cells were discarded from further analyzes (Supplementary Figure S2-B). Spots were counted using a fully automated spot-counting routine developed in Matlab.
For experiments on p53, mean nuclear levels were obtained by dividing the total nuclear intensity of p53 with total nuclear area in an average-projected image. For mean cytoplasmic levels of p53 a 15-pixel (1.14 μm at 60X) thick shell was defined around individual nuclei whose mean intensities, as defined above, were taken to be the mean levels of cytoplasmic pool of p53 for the corresponding nuclei. This is on assumption that p53 is uniformly distributed throughout the cytoplasm. The analysis codes are available upon request.
Data analysis
The intensity values obtained for the nuclei from DAPI channel were fitted with a bi-modal distribution where the second peak was allowed to vary between 1.7xG1 to 2.3xG1 – here G1 is the position of the first peak. Based on the fit parameters obtained from the analysis inspired from Dean and Jett, JCB (1974) [Citation65]. The cells were staged in different phases of the cell cycle according to the following definition: G1 ≡ [G1-3.0xσ1, G1 + 2.0xσ1); S ≡ [G1 + 2.0xσ1, G2-0.8xσ2) and G2/M ≡ [G2-0.8xσ2, G2 + 3.0xσ2) – here Gs and σs are means and standard deviations of G1 and G2 peaks. The intensities for the proteins were obtained from the same nuclear mask obtained from DAPI channel. For mRNA counts, cells were segmented manually and based on their nuclear intensities were staged in respective cell cycle stages.
Statistical analysis
Tests of significance were done using two-sample Kolmogorov-Smirnov (K-S) tests in Matlab. We chose K-S tests over the more common Student’s t-test because, being a non-parametric test of significance, it does not assume any underlying probability distribution. This is important here because underlying distributions of mRNA counts and protein intensities are often non-Gaussian. The number of cells in immunofluorescence experiments was at least 1500 in all the cases while that in mRNA experiments it was at least 250 due to higher magnification and manual segmentation of cells.
Supplemental Material
Download PDF (11.8 MB)Acknowledgements
We acknowledge the intramural research funds at TIFR Hyderabad to AM, and the TIFR graduate student fellowship to SD. SERB is acknowledged for an Early Career Research Award (ECR/2016/000907) to AM.
Disclosure statement
No potential conflict of interest was reported by the authors.
Supplementary data
Supplemental data for this article can be accessed here.
Additional information
Funding
Related Research Data
References
- Marnett LJ. Oxyradicals and DNA damage. Carcinogenesis. 2000;21(3):361–370.
- Friedberg EC, Walker GC, Siede W, et al. DNA repair and mutagenesis. ASM Press; 2006. DOI:10.1097/01.shk.0000232588.61871.ff
- Branzei D, Foiani M. Regulation of DNA Repair Throughout the Cell Cycle. Nat Rev Mol Cell Biol. 2008;9(4):297–308.
- Schroering AG, Edelbrock MA, Richards TJ, et al. The cell cycle and DNA mismatch repair. Exp Cell Res. 2007;313(2):292–304.
- Chaudhry MA. Base excision repair of ionizing radiation-induced DNA damage in G1 and G2 cell cycle phases. Cancer Cell Int. 2007;7:15.
- Malkin D, Li FP, Strong LC, et al. Germ line p53 mutations in a familial syndrome of breast cancer, sarcomas, and other neoplasms. Science (New York, N.Y.). 1990;250(4985):1233–1238.
- Classon M, Harlow E. The retinoblastoma tumour suppressor in development and cancer. Nat Rev Cancer. 2002;2(12):910–917.
- Bartek J, Lukas J. Chk1 and Chk2 kinases in checkpoint control and cancer. Cancer Cell. 2003;3(5):421–429.
- Jazayeri A, Falck J, Lukas C, et al. ATM- and cell cycle-dependent regulation of ATR in response to DNA double-strand breaks. Nat Cell Biol. 2006;8(1):37–45.
- Escribano-Díaz C, Orthwein A, Fradet-Turcotte A, et al. A cell cycle-dependent regulatory circuit composed of 53BP1-RIF1 and BRCA1-CtIP controls DNA repair pathway choice. Mol Cell. 2013;49(5):872–883.
- Chen F, Nastasi A, Shen Z, et al. Cell cycle-dependent protein expression of mammalian homologs of yeast DNA double-strand break repair genes Rad51 and Rad52. DNA Repair. 1997;384(3):205–211.
- Halicka HD, Huang X, Traganos F, et al. Histone H2AX phosphorylation after cell irradiation with UV-B: relationship to cell cycle phase and induction of apoptosis. Cell Cycle. 2005;4(2):339–345.
- Chen L, Nievera CJ, Lee AY-L, et al. Cell Cycle-dependent complex formation of BRCA•CtIP•MRN is important for DNA double-strand break repair. J Biol Chem. 2008;283(12):7713–7720.
- Kaneko YS, Watanabe N, Morisaki H, et al. Cell-cycle-dependent and ATM-independent expression of human Chk1 kinase. Oncogene. 1999;18(25):3673–3681.
- Karanam K, Kafri R, Loewer A, et al. Quantitative live cell imaging reveals a gradual shift between DNA repair mechanisms and a maximal use of HR in Mid S phase. Mol Cell. 2012;47(2):320–329.
- Ichijima Y, Sakasai R, Okita N, et al. Phosphorylation of histone H2AX at M phase in human cells without DNA damage response. Biochem Biophys Res Commun. 2005;336(3):807–812.
- Reisman D, Takahashi P, Polson A, et al. Transcriptional regulation of the p53 tumor suppressor gene in S-phase of the cell-cycle and the cellular response to DNA damage. Biochem Res Int. 2012;2012. DOI:10.1155/2012/808934
- Katsumoto T, Higaki K, Ohno K, et al. Cell-cycle dependent biosynthesis and localization of p53 protein in untransformed human cells. Biol Cell. 1995;84(3):167–173.
- Guo Z, Kumagai A, Wang SX, et al. Requirement for Atr in phosphorylation of Chk1 and cell cycle regulation in response to DNA replication blocks and UV-damaged DNA in Xenopus egg extracts. Genes Dev. 2000;14(21):2745–2756.
- Shi Y, Felley-Bosco E, Marti TM, et al. Starvation-induced activation of ATM/Chk2/p53 signaling sensitizes cancer cells to cisplatin. BMC Cancer. 2012;12:571.
- Lu C, Shi Y, Wang Z, et al. Serum starvation induces H2AX phosphorylation to regulate apoptosis via p38 MAPK pathway. FEBS Lett. 2008;582(18):2703–2708.
- Hasan NM, Adams GE, Joiner MC. Effect of serum starvation on expression and phosphorylation of PKC-alpha and p53 in V79 cells: implications for cell death. Int J Cancer. 1999;80(3):400–405.
- Pelkmans L. Cell Biology. Using cell-to-cell variability–a new era in molecular biology. Science (New York, N.Y.). 2012;336(6080):425–426.
- Altschuler SJ, Wu LF. Cellular heterogeneity: do differences make a difference? Cell. 2010;141(4):559–563.
- Huang X, Halicka HD, Traganos F, et al. Cytometric assessment of DNA damage in relation to cell cycle phase and apoptosis. Cell Prolif. 2005;38(4):223–243.
- Mazumder A, Tummler K, Bathe M, et al. Single-cell analysis of ribonucleotide reductase transcriptional and translational response to DNA damage. Mol Cell Biol. 2013;33(3):635–642.
- Raj A, Van Den Bogaard P, Rifkin SA, et al. Imaging individual mRNA molecules using multiple singly labeled probes. Nat Methods. 2008;5(10):877–879.
- Zenklusen D, Larson DR, Singer RH. Single-RNA counting reveals alternative modes of gene expression in yeast. Nat Struct Mol Biol. 2008;15(12):1263–1271.
- Bocker W, Gatenberg H-W, Muller WU, et al. Automated cell cycle analysis with fluorescence microscopy and image analysis. Phys Med Biol. 1996;41:523–537.
- Roukos V, Pegoraro G, Voss TC, et al. Cell cycle staging of individual cells by fluorescence microscopy. Nat Protoc. 2015;10(2):334–348.
- Mazumder A, Pesudo LQ, McRee S, et al. Genome-wide single-cell-level screen for protein abundance and localization changes in response to DNA damage in S. cerevisiae. Nucleic Acids Res. 2013;41(20):9310–9324.
- Sengupta S, Harris CC. p53: traffic cop at the crossroads of DNA repair and recombination. Nat Rev Mol Biol. 2005;6(1):44–55.
- Dulić V, Lees E, Reed SI. Association of human cyclin E with a periodic G1-S phase protein kinase. Science. 1992;257(5078):1958–1961.
- Pagano M, Pepperkok R, Verde F, et al. Cyclin A is required at two points in the human cell cycle. EMBO J. 1992;11(3):961–971.
- Henglein B, Chenivesse X, Wang J, et al. Structure and cell cycle-regulated transcription of the human cyclin A gene. Proc Natl Acad Sci U S A. 1994;91(12):5490–5494.
- Geng Y, Eaton EN, Picón M, et al. Regulation of cyclin E transcription by E2Fs and retinoblastoma protein. Oncogene. 1996;12(6):1173–1180. Available from: http://www.ncbi.nlm.nih.gov/pubmed/8649818
- Padovan-Merhar O, Nair GP, Biaesch AG, et al. Single mammalian cells compensate for differences in cellular volume and DNA copy number through independent global transcriptional mechanisms. Mol Cell. 2015;58(2):339–352.
- Sakaue-Sawano A, Kurokawa H, Morimura T, et al. Visualizing Spatiotemporal Dynamics of Multicellular Cell-Cycle Progression. Cell. 2008;132(3):487–498.
- Rickles R, Marashi F, Sierra F, et al. Analysis of histone gene expression during the cell cycle in HeLa cells by using cloned human histone genes. Proc Natl Acad Sci U S A. 1982;79(3):749–753.
- Osley MA. The regulation of histone synthesis in the cell cycle. Annu Rev Biochem. 1991;60(1):827–861.
- Lemaître C, Grabarz A, Tsouroula K. Nuclear position dictates DNA repair pathway choice Nuclear position dictates DNA repair pathway choice. Genes Dev. 2014;0–14. DOI:10.1101/gad.248369.114
- Soutoglou E, Misteli T. Activation of the cellular DNA damage response in the absence of DNA lesions. Science (New York, N.Y.). 2008;320(5882):1507–1510.
- Fragkos M, Jurvansuu J, Beard P. H2AX is required for cell cycle arrest via the p53/p21 pathway. Mol Cell Biol. 2009;29(10):2828–2840.
- Efeyan A, Serrano M. p53: guardian of the genome and policeman of the oncogenes. Cell Cycle. 2007;6(9):1006–1010.
- Smith ML, Seo YR. p53 regulation of DNA excision repair pathways. Mutagenesis. 2002;17(2):149–156.
- Mesaeli N, Phillipson C. Impaired p53 expression, function, and nuclear localization in calreticulin-deficient cells. Mol Biol Cell. 2004;15(4):1862–1870.
- Ofir-Rosenfeld Y, Boggs K, Michael D, et al. Mdm2 regulates p53 mRNA Translation through inhibitory interactions with ribosomal protein L26. Mol Cell. 2008;32(2):180–189.
- Yajima H, Lee K-J, Zhang S, et al. DNA double-strand break formation upon UV-induced replication stress activates ATM and DNA-PKcs kinases. J Mol Biol. 2009;385(3):800–810.
- Miao Z-H, Rao VA, Agama K, et al. 4-nitroquinoline-1-oxide induces the formation of cellular topoisomerase I-DNA cleavage complexes. Cancer Res. 2006;66(13):6540–6545.
- Banáth JP, Olive PL. Expression of phosphorylated histone H2AX as a surrogate of cell killing by drugs that create DNA double-strand breaks. Cancer Res. 2003;63(15):4347–4350. Available from: http://www.ncbi.nlm.nih.gov/pubmed/12907603
- Ashcroft M, Kubbutat MH, Vousden KH. Regulation of p53 function and stability by phosphorylation. Mol Cell Biol. 1999;19(3):1751–1758.
- Kurihara A, Nagoshi H, Yabuki M, et al. Ser 46 phosphorylation of p53 is not always sufficient to induce apoptosis: multiple mechanisms of regulation of p53-dependent apoptosis. Genes to Cells. 2007;12(7):853–861.
- Smeenk L, Van Heeringen SJ, Koeppel M, et al. Role of p53 serine 46 in p53 target gene regulation. Plos One. 2011;6(3):e17574.
- Fu L, Minden MD, Benchimol S. Translational regulation of human p53 gene expression. EMBO J. 1996;15(16):4392–4401.
- Lakin ND, Jackson SP. Regulation of p53 in response to DNA damage. Oncogene. 1999;18(53):7644–7655.
- Kastan MB, Onyekwere O, Sidransky D, et al. Participation of p53 protein in the cellular response to DNA damage. Cancer Res. 1991;51(23 Pt 1):6304–6311. Available from: http://www.ncbi.nlm.nih.gov/pubmed/1933891
- Marine J-C. P53 stabilization: the importance of nuclear import. Cell Death Differ. 2010;17(2):191–192.
- Shirangi TR, Zaika A, Moll UM. Nuclear degradation of p53 occurs during down-regulation of the p53 response after DNA damage. FASEB J. 2002;16(3):420–422.
- Giunta S, Belotserkovskaya R, Jackson SP. DNA damage signaling in response to double-strand breaks during mitosis. J Cell Biol. 2010;190(2):197–207.
- Arrigucci R, Bushkin Y, Radford F, et al. FISH-Flow, a protocol for the concurrent detection of mRNA and protein in single cells using fluorescence in situ hybridization and flow cytometry. Nat Protoc. 2017;12(6):1245–1260.
- Baerlocher GM, Vulto I, De Jong G, et al. Flow cytometry and FISH to measure the average length of telomeres (flow FISH). Nat Protoc. 2006;1(5):2365–2376.
- Skinner SO, Xu H, Nagarkar-Jaiswal S, et al. Single-cell analysis of transcription kinetics across the cell cycle. eLife. 2016;5:e12175.
- Brooks CL, Gu W. p53 ubiquitination: mdm2 and beyond. Mol Cell. 2006;21(3):307–315.
- Trotta E, Paci M. Solution structure of DAPI selectively bound in the minor groove of DNA T·T mismatch-containing site: NMR and molecular dynamics studies. Nucleic Acids Res. 1998;26(20):4706–4713.
- Dean PN, Jett JH. Mathematical analysis of DNA distributions derived from flow microfluorometry. J Cell Biol. 1974;60(2):523–527. Available from: http://www.ncbi.nlm.nih.gov/pubmed/4855906