
ABSTRACT
Necrotizing enterocolitis (NEC) is a potentially fatal illness in premature neonates. Tumor necrosis factor-α (TNF-α) and autophagy are associated with the pathogenesis of NEC. This study aimed to explore whether TNF-α might regulate apoptosis in neonatal NEC model cells IEC-6 via regulation of autophagy. NEC rat model was induced by hand feeding and exposure to asphyxia/cold-stress for histologic examination. The NEC in vitro model (IEC-6/NEC cells) was established by stimulating the intestinal epithelial cell line IEC-6 with lipopolysaccharide (LPS, 100 μg/mL) for 3 h to investigate the effects of TNF-α on IEC-6 proliferation and apoptosis. In this study, NEC rats showed decreased proliferating cell nuclear antigen (PCNA) expression, increased TUNEL-positive cells, higher expression of TNF-α, p-ERK1/2, and autophagy-related proteins in rat small intestine compared with their controls. Additionally, the LPS-stimulated IEC-6/NEC cells showed a significantly decreased proliferation and increased apoptosis compared with the control cells. Furthermore, the LPS-stimulated IEC-6/NEC cells exhibited enhanced autophagy level, as evidenced by a dose-dependent increase in Beclin-1 protein expression, LC3II/LC3I ratio and accumulation of MDC-positive autophagic vacuoles. Moreover, inhibition of autophagy by wortmannin or LY294002 significantly abolished the LPS-mediated decreased proliferation and increased apoptosis of IEC-6/NEC cells. Results also showed that inhibition of ERK1/2 pathway using U0126 significantly inhibited TNF-α-induced autophagy. Furthermore, the TNF-α-mediated inhibition of IEC-6 proliferation and promotion of IEC-6 apoptosis was abolished by U0126. Our findings demonstrated that TNF-α might induce autophagy through ERK1/2 pathway to regulate apoptosis in neonatal NEC cells IEC-6. Our study enhances our understanding of neonatal NEC pathogenesis.
Introduction
Necrotizing enterocolitis (NEC) is considered as one of the most common and potentially most fatal gastrointestinal diseases in neonates [Citation1]. The incidence of NEC in very low birth weight infants is high and the morbidity and mortality of this disease remain the highest in neonates [Citation2,Citation3]. NEC is characterized by patchy areas of inflammation and necrosis that predominantly involve the small intestine [Citation4]. The current treatment options for NEC are limited and include intensive supportive care and surgical intervention [Citation5]. To our knowledge, several factors, including prematurity, intestinal immaturity, hypoxia-ischemia, low perfusion states, colonization with pathogenic bacteria, and formula feeding, play important roles in bowel injury, intestinal inflammation, and release of pro-inflammatory cytokines, thereby resulting in intestinal tissue damage including necrosis and apoptosis in intestinal tissue [Citation6,Citation7]. NEC can be induced by formula gavage, cold stress, hypoxia in vivo or lipopolysaccharide (LPS) stimulation in vitro [Citation8]. However, its pathogenesis still remains largely uncertain and a better understanding of the pathogenesis is important for improving the treatment of NEC.
The importance of tumor necrosis factor-α (TNF-α) in the initiation and propagation NEC has been well documented [Citation9–Citation11]. TNF-α is a potent cytokine whose activation results in apoptosis and induction of inflammatory responses. It have long ago been reported that neonates with NEC showed elevated plasma levels of TNF-α derived from circulating mononuclear phagocytes [Citation12]. Then, Viscardi et al. [Citation13] reported the elevated mRNA levels of TNF-α in intestinal samples of infants with acute NEC. Afterwards, Wang et al. [Citation11] observed that TNF-α level began to increase on Day 1–3 after birth in premature infants, reached a peak on Day 7–10, and declined to normal levels on Day 14–21. Moreover, Hui et al. [Citation14] provided evidence that TNF-α expression in the resected intestine samples by immunohistochemistry were enhanced in neonatal NEC patients with gestational ages of 28 to 29 weeks compared with the controls who underwent intestinal atresia surgery. Furthermore, a more recent study demonstrated that the mRNA expression of TNF-α in the liver was also higher in experimental NEC mice compared with the control pups [Citation15]. The intestinal epithelial (enterocyte) cell line IEC-6 is often used as a NEC model system in vitro [Citation5,Citation8,Citation16,Citation17]. A previous study confirmed that TNF-α induced IEC-6 apoptosis [Citation18]. And it was accepted that enterocytes apoptosis was associated with NEC severity [Citation16]. These studies indicated the importance of TNF-α in the NEC development. However, the potential mechanisms by which the pro-inflammatory factor TNF-α regulates IEC-6 enterocyte apoptosis in NEC remain unclear.
Autophagy is a self-protection mechanism for cells, which plays a critical role in the removal of dysfunctional and damaged organelles and macromolecules [Citation19,Citation20]. Autophagy is capable of regulating cell homeostasis, but uncontrolled activation of autophagy may result in cellular injury [Citation21]. Autophagy and apoptosis are induced by multiple stress pathways which may impact the intestinal barrier, and they have been associated with the pathogenesis of diverse gastrointestinal diseases including NEC [Citation4,Citation22]. Activation of autophagy was observed both in the intestinal epithelium of NEC patients and in the ileum of NEC rats [Citation21]. A variety of studies have observed the suppression of autophagy by TNF-α. For example, TNF-α can suppress epithelial to mesenchymal transition by inhibiting autophagy in hepatocellular carcinoma Huh7 cells [Citation23]. In contrast, there is also evidence supporting the fact that TNF-α induced autophagy, for instance, in adipocytes [Citation23]. The aforementioned studies indicated the importance of TNF-α and autophagy in NEC. Thus, we speculated that TNF-α might regulate enterocyte apoptosis in neonatal NEC via regulation of autophagy.
Materials and methods
Animals and NEC model
The study was approved by the animal care and use committee of The First Affiliated Hospital of Zhengzhou University. All experimental protocols were performed according to the guidelines for the ethical treatment of experimental animals. Twenty newborn SD rat pups (5–6 g) rat pups whose mothers were maintained under standard conditions were divided into two groups:
-group 1 (control group, n = 10): the neonatal rats were obtained after spontaneous vaginally delivery at full term (22.5–23 d) and were mother-fed;
-groups 2 (NEC group, n = 10): NEC was induced by hand feeding and exposure to asphyxia/cold-stress as previously described [Citation10]. Time-dated pregnant SD rats were delivered prematurely on d 21.5 via abdominal incision under CO2 anesthesia. To develop NEC, rat pups were challenged with hypoxia by breathing 100% nitrogen gas in a closed, clear plastic chamber for 60 s, followed by hypothermia – exposure to cold (4°C) for 10 min – starting from 2 h of age and then every 12 h. In addition, the asphyxia/cold-stressed rat pups were hand fed with artificial formula (Rat milk replacer: 168 kcal/100 mL; Wombaroo Food Products, Adelaide, Australia), designed to approximate the protein and caloric content of rat breast milk, using an orogastric tube (L-Cath 28-G, Luther Medical Products, Inc., Tustin, CA). Feeds were started at 0.1 mL from 30 min of age, given every 4 h, and advanced by 0.05 mL every 12 h to a maximum of 0.3 mL per feed by d 4. All rat pups were observed hourly for clinical signs of NEC such as abdominal distension, respiratory distress, and lethargy. 96 hours after birth, or at signs of NEC illness, the pups were euthanized via decapitation, and intestinal tissue was processed and examined for histologic changes of NEC.
Hematoxylin and eosin (HE) staining
HE staining was performed to observe the pathological changes in small intestine. Briefly, a representative 1–2-cm-long specimen was taken from proximal, mid, and distal small intestine for histological analysis. The small intestine tissues were fixed with 4% buffered formalin solution and embedded in paraffin before being cut into 4-μm thick sections. The prepared sections were stained using Mayer’s H&E (Yeasen, Shanghai, China) following a routine staining procedure and analyzed with an Olympus BH-2 light microscope (Olympus, Tokyo, Japan). Pathological changes in intestinal architecture were quantified using a modified NEC scoring system based on a previous study [Citation24]. Histological scores in the small intestine were blindly evaluated by three independent evaluators. The NEC scoring criteria were as follows: 0: normal; 1: separation of the villous core, without other abnormalities (mild NEC); 2: villous core separation, submucosal edema, and epithelial sloughing (moderate NEC); and 3: denudation of epithelium with loss of villi, full-thickness necrosis (severe NEC). The analysis was performed on 3 to 5 sections for each sample. The final score was based on the worst appearing microscopic field. Animals with histological scores ≥ 2 were defined as having NEC. Histological scores were only obtained from the tissues of live animals.
Immunohistochemistry of proliferating cell nuclear antigen (PCNA)
Immunohistochemistry of PCNA (an endogenous marker for cell proliferation) was performed to evaluate small intestine proliferation. Briefly, the small intestine sections were incubated with a primary anti-PCNA (cat. no. ab29; 1: 10,000; Abcam, Cambridge, MA, USA) for 1 h and then incubated with goat anti-rabbit IgG (Abcam) for 30 min. The sections were stained with diaminobenzidine (DAB). The percentage of PCNA-positive cells was calculated as the percentage of positive nuclei (brown) in 10 randomly selected high-power fields at x400 magnification.
In situ detection of apoptotic cells
Apoptotic cells in the small intestine tissues were detected by TUNEL assay, according to the manufacturer’s protocol for the In Situ Cell Death Detection kit (Roche Diagnostics, GmbH, Mannheim, Germany). Apoptotic cells were imaged under an Olympus BH-2 light microscope (Olympus). The TUNEL-positive cells (brown) were counted in 10 randomly selected high-power fields at x400 magnification.
Enzyme-linked immunosorbent assay (ELISA)
The levels of TNF-α in serum and intestinal homogenate of NEC rats as well as in IEC-6 cell supernatant were measured with an ELISA kit (R&D Systems, USA) according to the manufacturer’s protocol.
Western blot
The protein expression of microtubule-associated protein 1 light chain 3 (LC3)-I, LC3-II, Beclin-1, and phosphorylated (p-) ERK1/2 was detected by Western blot. Small intestinal tissues or IEC-6 cells were lysed in 200 μL radioimmunoprecipitation assay lysis buffer (Santa Cruz Biotechnology, Inc., Dallas, TX, USA). The protein concentrations were determined by BCA assay. Subsequently, equal proteins were resolved by 10% SDS-PAGE gels and then transferred to PVDF membranes (Millipore Corp., Billerica, MA, USA). After being blocked with 5% non-fat dried milk, the membranes were incubated with the following primary antibodies; anti- Beclin-1 (cat. no. SAB1306484; 1:1,000), anti- LC3-I/LC3-II (cat. no. SAB2700738; 1:1,000), anti- ERK1/2 (cat. no. SAB1305560; 1:1,000), anti- p-ERK1/2 (cat. no. SAB4301578; 1:1,000) and anti-GAPDH (cat. no. SAB2100894; 1:500) (all from Sigma-Aldrich) overnight at 4°C. Subsequently, protein bands were detected by incubation with horseradish peroxidase-conjugated goat anti-rabbit immunoglobulin G (IgG; Abcam) at room temperature for 1 h. The protein was detected with an enhanced chemiluminescence kit (ECL kit; Pierce Biotechnology, IL) and the band intensity was analyzed by Image-Pro Plus 6.0 software. GAPDH was used as a loading control.
NEC in vitro cell model
We established NEC in vitro cell model by using rat intestinal epithelial cell line IEC-6 in the stimulation of 100 μg/mL LPS for 3 h.
Cell culture
IEC-6 cells were purchased from the American Type Culture Collection (ATCC, USA). Cells were maintained in high glucose Dulbecco’s Modified Eagle’s medium (DMEM, Gibco BRL, Gaithersburg, MD, USA) supplemented with 10% fetal bovine serum (FBS, Gibco BRL), penicillin (100 U/mL), streptomycin (100 μg/mL), and recombinant human insulin (0.1 U/mL). Cells were maintained in 100 mm tissue culture plates in humidified air with 5% CO2 at 37°C. Cells were grown to a confluent monolayer prior to experimentation.
Cell proliferation assay
MTT assay was performed to measure cell viability and proliferation of IEC-6 cells as previously described [Citation25]. Briefly, cells were harvested for 24 h and then plated into 96-well plates at a density of 5, 000 cells/well. After 24 h of incubation, 20 μL MTT (5 mg/mL, Sigma-Aldrich, St. Louis, MO, USA) was added into each well for 4 h of incubation at 37°C. Then the medium was replaced with 150 μL dimethyl sulfoxide (DMSO) for 10 min to solubilize the crystals for 20 min. Cellular viability was determined by measuring the optical density (OD) at 490 nm with averages from triplicate wells by a spectrophotometer (Multiskan MK3, Thermo, Waltham, MA, USA). Cellular viability was normalized to control well.
Cell apoptosis assay
An annexin V-fluorescein isothiocyanate (FITC)/propidium iodide (PI) cell apoptosis kit was used to quantify IEC-6 apoptosis according to the manufacturer’s instructions (Invitrogen, Thermo Fisher Scientific, Inc., Waltham, MA, USA). Briefly, IEC-6 cells were harvested for 24 h following the indicated different treatment. Total cells were washed twice with PBS buffer (pH 7.4), and re-suspended in the staining buffer provided in the kit. After this, 5 µL Annexin V-FITC and 5 µL PI were mixed with the cells. After 10 min of cultivation at room temperature, mixtures were analyzed using the FACScan flow cytometry (BD Biosciences, Franklin Lakes, NJ, USA). The percentage of apoptotic cells is indicated by the sum of the numerical value represented in the upper right (annexin and PI positive) and lower right quadrant (annexin positive/PI negative). The “cell apoptosis rate” was the average of apoptosis rates from four times of flow cytometry analysis.
Monodansylcadaverine (MDC) staining
Autophagy is morphologically characterized by the formation of autophagic vacuoles in cytoplasm. The autofluorescent agent MDC has been proposed as a specific marker for autophagic vacuoles [Citation26]. MDC staining was performed as previously described [Citation27]. Briefly, after treatment, the IEC-6 cells were stained with MDC (50 μmol/L) at 37°C for 30 min. After that, the cells were washed three times with PBS, fixed with 5% paraformaldehyde, and immediately observed under a fluorescence microscope (Olympus Corporation, Tokyo, Japan).
Real time quantitative reverse transcription PCR (qrt-PCR)
Total RNA was isolated from IEC-6 cells using Trizol Reagent (Invitrogen, Life Technologies, CA, USA) according to the manufacturer’s instruction. Then RNA was quantified and reversely transcribed into cDNAs using the iScript cDNA synthesis kit (Bio-Rad, CA). The cDNAs were amplified through qRT-PCR by SYBR Green Realtime PCR Master Mix (TOYOBO, Japan). The relative expression level of TNF-α was calculated using the 2-ΔΔCt method and normalized to the level of internal control GAPDH. The primer sequences were as follows: TNF-α: forward, TTCCGAATTCACTGGAGCCTCGAA (5ʹ-3ʹ), and reverse, TGCACCTCAGGGAAGAATCTGGAA (5ʹ-3ʹ). GAPDH: forward, TGAAGCAGGCATCTGAGGG (5ʹ-3ʹ), and reverse, CGAAGGTGGAAGAGTGGGAG (5ʹ-3ʹ).
Statistical analysis
All statistical analyses were performed using SPSS statistical software package standard version 16.0 (SPSS, Inc., Chicago, IL, USA). The unpaired Student’s t-test was used to analyze differences between two groups. One-way analysis of variance (ANOVA) was used to analyze differences among multiple groups. p < 0.05 was considered statistically significant.
Results
Morphological changes in small intestine of NEC rats
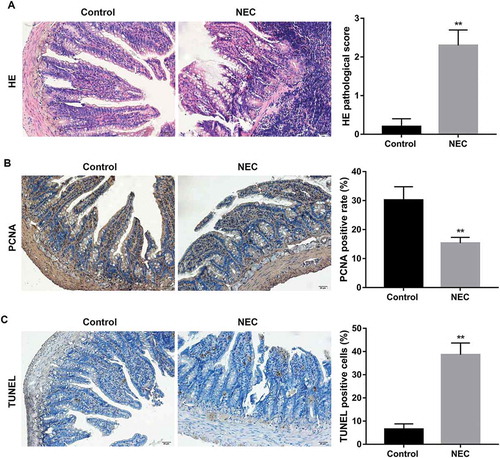
Morphological changes were analyzed in control rats and in experimental NEC rats. HE staining revealed that there were no histologic abnormalities in the control rats, whereas partial loss of villi with separation in the submucosa and lamina propria was observed in NEC rats. In addition, NEC rats showed higher HE histological scores (≥2) in small intestine compared with the control rats, indicating the NEC rat model was established successfully (). Furthermore, NEC rats exhibited lower small intestine proliferation, as indicated by a significant decline in PCNA expression level in NEC rat small intestine compared with that of controls (). Moreover, NEC rats exhibited higher TUNEL positive cells in small intestine compared with the control group (), indicating the intestinal tissue damage.
Figure 1. Morphological changes in small intestine of NEC rats.
NEC rat model was induced by hand feeding and exposure to asphyxia/cold-stress, and the neonatal rats that were obtained after spontaneous vaginally delivery at full term and mother-fed were used as the control rats. (A) HE staining was performed to observe the pathological changes in small intestine. HE pathological scores in the small intestine were blindly evaluated by three independent evaluators to determine the NEC injury. Rats with histological scores ≥2 were defined as having NEC. Scale bar: 20 μM. (B) Immunohistochemistry of PCNA was performed to evaluate small intestine proliferation. The percentage of PCNA positive cells was calculated as the percentage of positive nuclei (brown) in 10 randomly selected high-power fields at x400 magnification. Scale bar: 20 μM. (C) TUNEL staining was performed to evaluate small intestine apoptosis. The percentage of TUNEL positive cells was calculated as the percentage of positive nuclei (brown) in 10 randomly selected high-power fields at x400 magnification. Scale bar: 20 μM. **p < 0.01 vs. Control group.
Expression of TNF-α, p-ERK1/2, and autophagy-related proteins in NEC rats
It has been well documented that TNF-α plays an important role in the initiation and propagation NEC [Citation9–Citation11]. In view of this, we examined TNF-α expression in NEC rats. Our results showed that levels of TNF-α in both serum and small intestinal homogenate of NEC rats were significantly higher than those in the control rats (). Furthermore, NEC rats showed significantly increased protein expression of p-ERK1/2 in small intestine compared with the control rats (). Moreover, as shown in , the protein expression of Beclin-1 in small intestine of NEC rats was significantly higher than that in the control group. Furthermore, the ratio of LC3-II/LC3-I, which indicates the conversion of LC3 from LC3-I to LC3-II and has been established as a useful marker for autophagy, was obviously increased in small intestine of NEC rats compared with the control rats
Figure 2. Expression of TNF-α, p-ERK1/2, and autophagy-related proteins in NEC rats.
Levels of TNF-α in serum (A) and small intestinal homogenate (B) in NEC rats were examined using ELISA test. Western blot was performed to detect the protein expression of p-ERK1/2 (C), LC3II/LC3I and Beclin-1 (D) in small intestine of NEC rats. The quantitative analysis of their relative protein expression normalized to GAPDH using Image-Pro Plus 6.0 software was shown. **p < 0.01 vs. Control group.
Autophagy involved in the decreased proliferation and increased apoptosis in IEC-6/NEC
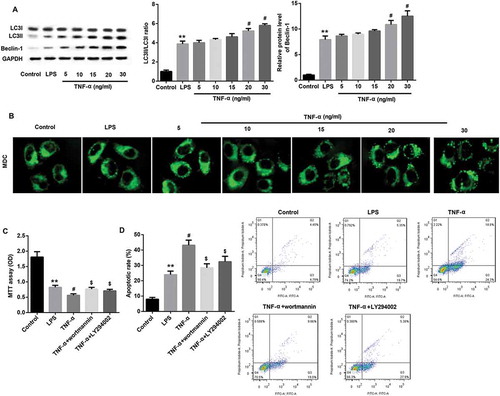
Next, we established NEC in vitro cell model by using rat intestinal epithelial cell line IEC-6 in the stimulation of 100 μg/mL LPS for 3 h (IEC-6/NEC, LPS group). As expected, IEC-6/NEC cells exhibited significantly decreased proliferation () and elevated apoptosis () compared with the control group. Next, we performed Western blot to detect the levels of Beclin-1, LC3-I and LC3-II in IEC-6/NEC cells. Consistent with the in vivo data,, the protein expression of Beclin-1 and the ratio of LC3-II/LC3-I in IEC-6/NEC cells were significantly higher than that in the control IEC-6 cells (). In addition, IEC-6/NEC cells presented increased accumulation of MDC-positive dots (autophagic vacuoles) compared with the controls ().
Figure 3. Autophagy involved in the decreased proliferation and increased apoptosis in IEC-6/NEC.
The IEC-6 cells were stimulated with 100 μg/mL LPS for 3 h to establish NEC in vitro cell model (IEC-6/NEC, LPS group), and the cells treated with equal volume of culture medium served as the control (Control group). (A) MTT assay was performed to determine the effects of LPS on IEC-6 proliferation. (B) Flow cytometry analysis was performed to evaluate the effects of LPS on IEC-6 apoptosis. (C) Western blot was performed to detect the protein expression of LC3II/LC3I and Beclin-1 in IEC-6 cells stimulated with LPS or not. The quantitative analysis of their relative protein expression normalized to GAPDH using Image-Pro Plus 6.0 software was shown. (D) MDC fluorescence staining of autophagic vacuoles in IEC-6 cells treated with LPS or not. (E) MTT assay was performed to determine the effects of autophagy inhibitor wortmannin or LY294002 on the proliferation of the LPS-induced IEC-6/NEC cells. (F) Flow cytometry analysis was performed to evaluate the effects of autophagy inhibitor wortmannin or LY294002 on the apoptosis of the LPS-induced IEC-6/NEC cells. **p < 0.01 vs. Control group; ##p < 0.01 vs. LPS group.
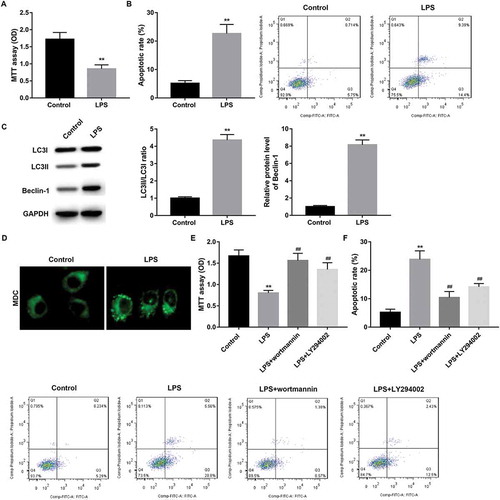
To explore whether autophagy has influence on the decreased proliferation and increased apoptosis in IEC-6/NEC cells, we treated LPS-stimulated IEC-6/NEC cells with autophagy inhibitor wortmannin and LY294002. Data revealed that inhibition of autophagy by wortmannin or LY294002 significantly abolished the LPS-mediated decreased proliferation () and increased apoptosis () of IEC-6/NEC cells.
TNF-α suppressed proliferation and promoted apoptosis in IEC-6/NEC
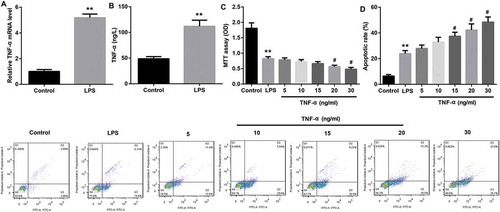
The LPS-stimulated IEC-6/NEC cells showed significantly higher TNF-α mRNA expression compared with the control IEC-6 cells (). Furthermore, TNF-α level in the cell supernatant was significantly higher in the LPS-stimulated IEC-6/NEC cells compared with the controls (). Next, we explored the effects of TNF-α on IEC-6/NEC proliferation and apoptosis. Data revealed that TNF-α treatment with concentration of 20 ng/mL and 30 ng/mL significantly suppressed proliferation () and promoted apoptosis () of IEC-6/NEC cells. In light of the cost and efficiency of TNF-α, 20 ng/mL TNF-α was selected for use in subsequent experiments.
Figure 4. TNF-α suppressed proliferation and promoted apoptosis in IEC-6/NEC.
The IEC-6 cells were stimulated with 100 μg/mL LPS for 3 h to establish NEC in vitro cell model (IEC-6/NEC, LPS group), and the cells treated with equal volume of culture medium served as the control (Control group). (A) The TNF-α mRNA expression in IEC-6 cells stimulated with LPS or not was measured by RT-qPCR. (B) The TNF-α level in the cell supernatant of IEC-6 cells stimulated with LPS or not was measured by Western blot. (C) Effects of TNF-α treatment at increasing concentrations (5, 10, 15, 20, 30 ng/mL) for 6 h on the proliferation of the LPS-induced IEC-6/NEC cells were evaluated by MTT assays. (D) Effects of TNF-α treatment at increasing concentrations (5, 10, 15, 20, 30 ng/mL) for 6 h on the apoptosis of the LPS-induced IEC-6/NEC cells were evaluated by flow cytometry cell apoptosis analysis. **p < 0.01 vs. Control group; #p < 0.05 vs. LPS group.
TNF-α suppressed proliferation and promoted apoptosis in IEC-6/NEC via autophagy induction
Next, we treated ICE-6/NEC cells with increasing concentrations of TNF-α to investigate the effects of TNF-α on autophagy level. Data revealed that TNF-α significantly induced autophagy level, as evidenced by a dose-dependent increase in Beclin-1 protein expression, LC3II/LC3I ratio () and accumulation of MDC-positive autophagic vacuoles (). We then explored whether TNF-α suppressed proliferation and promoted apoptosis in IEC-6/NEC via autophagy induction. Data revealed that inhibition of autophagy by wortmannin or LY294002 significantly abolished the TNF-α (20 ng/mL)-mediated inhibition of proliferation () and promotion of apoptosis () in IEC-6/NEC cells. These results indicated that TNF-α suppressed proliferation and promoted apoptosis in IEC-6/NEC, at least in part, via autophagy induction.
Figure 5. TNF-α suppressed proliferation and promoted apoptosis in IEC-6/NEC via autophagy induction.
The IEC-6 cells were stimulated with 100 μg/mL LPS for 3 h to establish NEC in vitro cell model (IEC-6/NEC, LPS group), and the cells treated with equal volume of culture medium served as the control (Control group). (A) Effects of TNF-α treatment at increasing concentrations (5, 10, 15, 20, 30 ng/mL) on the protein expression of LC3II/LC3I and Beclin-1 in the LPS-induced IEC-6/NEC cells were evaluated by Western blot. The quantitative analysis of their relative protein expression normalized to GAPDH using Image-Pro Plus 6.0 software was shown. (B) Effects of TNF-α treatment at increasing concentrations (5, 10, 15, 20, 30 ng/mL) on the formation of autophagic vacuoles in the LPS-induced IEC-6/NEC cells were evaluated by MDC fluorescence staining. (C) MTT assay was performed to evaluate the effects of pre-treatment with autophagy inhibitor wortmannin or LY294002 on the cell proliferation of the LPS-induced IEC-6/NEC cells treated with TNF-α (20 ng/mL). (D) Flow cytometry analysis was performed to evaluate the effects of pre-treatment with autophagy inhibitor wortmannin or LY294002 on the cell apoptosis of the LPS-induced IEC-6/NEC cells treated with TNF-α (20 ng/mL). **p < 0.01 vs. Control group; #p < 0.05 vs. LPS group; $p < 0.05 vs. TNF-α group.
TNF-α induced autophagy via ERK1/2 signaling in IEC-6/NEC
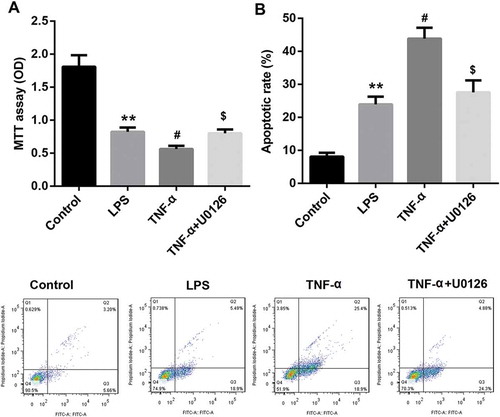
TNF-α treatment dose-dependently upregulated protein expression of p-ERK1/2 in IEC-6/NEC cells, indicating the induction of ERK1/2 signaling (). To explore whether TNF-α induced autophagy via activating ERK1/2 signaling, we evaluated the effects of pre-treatment with ERK1/2 pathway inhibitor U0126 on Beclin-1 protein expression, LC3II/LC3I ratio, and accumulation of autophagic vacuoles in IEC-6/NEC cells treated with 20 ng/mL TNF-α. Data revealed that inhibition of ERK1/2 using U0126 significantly inhibited TNF-α-induced autophagy, as revealed by a significant decrease in Beclin-1 protein expression, LC3II/LC3I ratio () and accumulation of MDC-positive autophagic vacuoles compared with the TNF-α group (). In addition, inhibition of ERK1/2 pathway using U0126 significantly abolished the TNF-α-mediated inhibition of IEC-6 proliferation () and promotion of IEC-6 apoptosis (), indicating that TNF-α suppressed proliferation and promoted apoptosis in IEC-6/NEC cells via ERK1/2 signaling. Collectively, these results suggested that TNF-α induced autophagy via ERK1/2 signaling, thereby suppressing proliferation and promoting apoptosis in IEC-6/NEC cells.
Figure 6. TNF-α induced autophagy via ERK1/2 signaling in IEC-6/NEC.
The IEC-6 cells were stimulated with 100 μg/mL LPS for 3 h to establish NEC in vitro cell model (IEC-6/NEC, LPS group), and the cells treated with equal volume of culture medium served as the control (Control group). (A) Effects of TNF-α treatment at increasing concentrations (5, 10, 15, 20, 30 ng/mL) on the protein expression of p-ERK1/2 in the LPS-induced IEC-6/NEC cells were evaluated by Western blot. The quantitative analysis of p-ERK1/2/ERK1/2 protein expression ratio normalized to GAPDH using Image-Pro Plus 6.0 software was shown. (B) Effects of pre-treatment with ERK1/2 pathway inhibitor U0126 on the protein expression of LC3II/LC3I and Beclin-1 in the LPS-induced IEC-6/NEC cells treated with TNF-α (20 ng/mL) were evaluated by Western blot. The quantitative analysis of their protein expression normalized to GAPDH using Image-Pro Plus 6.0 software was shown. (C) Effects of pre-treatment with ERK1/2 pathway inhibitor U0126 on the formation of autophagic vacuoles in the LPS-induced IEC-6/NEC cells treated with TNF-α (20 ng/mL) were evaluated by MDC fluorescence staining. **p < 0.01 vs. Control group; #p < 0.05 vs. LPS group; $p < 0.05 vs. TNF-α group.
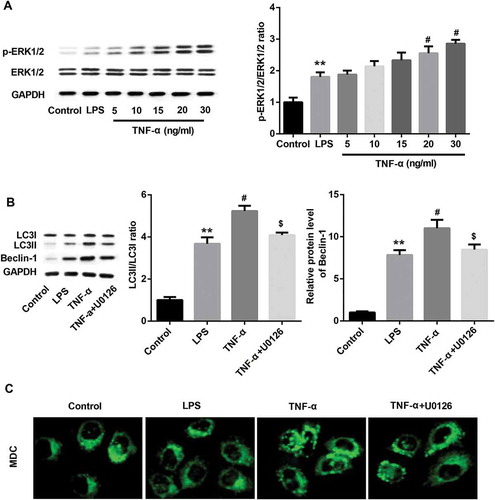
Figure 7. TNF-α suppressed proliferation and promoted apoptosis in IEC-6/NEC cells via ERK1/2 signaling.
The IEC-6 cells were stimulated with 100 μg/mL LPS for 3 h to establish NEC in vitro cell model (IEC-6/NEC, LPS group), and the cells treated with equal volume of culture medium served as the control (Control group). (A) Effects of pre-treatment with ERK1/2 pathway inhibitor U0126 on the cell proliferation of the LPS-induced IEC-6/NEC cells treated with TNF-α (20 ng/mL) were evaluated by MTT assay. (B) Effects of pre-treatment with ERK1/2 pathway inhibitor U0126 on the cell apoptosis of the LPS-induced IEC-6/NEC cells treated with TNF-α (20 ng/mL) were evaluated by flow cytometry assay. **p < 0.01 vs. Control group; #p < 0.05 vs. LPS group; $p < 0.05 vs. TNF-α group.
Discussion
In the present study, we found that NEC rats showed decreased PCNA expression increased TUNEL-positive cells, higher expression of TNF-α, p-ERK1/2, and autophagy-related proteins in small intestine compared with their controls. Additionally, the LPS-stimulated IEC-6/NEC cells showed a significantly decreased proliferation and increased apoptosis compared with the control cells. Furthermore, the LPS-stimulated IEC-6/NEC cells exhibited enhanced autophagy level, as evidenced by a dose-dependent increase in Beclin-1 protein expression, LC3II/LC3I ratio and accumulation of MDC-positive autophagic vacuoles. Moreover, we found that inhibition of autophagy by wortmannin or LY294002 significantly abolished the LPS-mediated decreased proliferation and increased apoptosis of IEC-6/NEC cells. We also showed that TNF-α suppressed proliferation and promoted apoptosis in the LPS-stimulated IEC-6/NEC cells via autophagy induction. In addition, TNF-α induced autophagy via ERK1/2 signaling, thereby suppressing proliferation and promoting apoptosis in the LPS-stimulated IEC-6/NEC cells.
Neonate NEC is a leading cause of morbidity and mortality among premature infants; yet effective interventions are lacking due to the limited understanding of the pathogenesis of NEC [Citation16,Citation28,Citation29]. Inflammation, cell apoptosis and necrosis are key pathologies that parallel with the development of NEC [Citation16]. NEC can be induced by enteral formula feeding, exposure to hypoxia-hyperoxia and cold stress in vivo [Citation8]. The experimental NEC rats showed lower proliferation and higher TUNEL-positive cells in small intestine compared with the controls. Furthermore, expression of TNF-α, p-ERK1/2, and autophagy-related proteins in small intestine of NEC rats were higher than the controls, indicating the potential involvement of TNF-α, ERK1/2, and autophagy in NEC development.
The intestinal enterocyte cell line IEC-6 is often used as a NEC model system in vitro [Citation5,Citation8,Citation16,Citation17]. IEC-6/NEC can be induced by LPS stimulation in vitro [Citation8]. LPS is endotoxin of gram-negative bacteria and is one of the most abundant pro-inflammatory stimuli in the gastrointestinal tract. LPS mediates inflammation and is a key contributor to NEC [Citation30]. In this study, we established NEC in vitro cell model by stimulating IEC-6 cells with 100 μg/mL LPS for 3 h. Our results showed that LPS treatment led to a significantly decreased proliferation and elevated apoptosis of IEC-6 compared with the control cells. Consistent with this, a recent study demonstrating that breast milk protected against development of NEC via inhibition of IEC-6 enterocyte apoptosis and restoration of enterocyte proliferation [Citation8] provided support, to some extent, for the decreased proliferation and elevated apoptosis of the LPS-stimulated IEC-6/NEC cells in this study [Citation8].
In addition, autophagy was significantly induced in the LPS-stimulated IEC-6/NEC cells as indicated by increased expression of the autophagy markers Beclin 1 and LC3II, and by enhanced accumulation of MDC-positive autophagic vacuole. Autophagy has been shown to be associated with the pathogenesis of NEC [Citation4,Citation22,Citation31]. Activation of autophagy was observed both in the intestinal epithelium of NEC patients and in the ileum of NEC rats [Citation21]. Neal et al. [Citation4] stated that the development of NEC in both mouse and human was associated with increased enterocyte autophagy; Furthermore, they harbored the idea that the induction of autophagy was required for but not merely a consequence of NEC. Moreover, Yu et al. [Citation22] demonstrated that autophagy and apoptosis were both rapidly up-regulated in rat experimental NEC model, where autophagy preceded the onset of apoptosis in intestine [Citation22]. Here, we found that autophagy involved in the LPS-mediated decreased proliferation and increased apoptosis of IEC-6/NEC cells.
It has been well documented that TNF-α plays an important role in the initiation and propagation NEC [Citation9–Citation11]. Previous studies have reported that NEC infants showed elevated plasma level of TNF-α [Citation12] and elevated mRNA expression of TNF-α in intestinal samples [Citation13,Citation14] compared with the controls. Wang et al. [Citation11] suggested that monitoring levels of pro-inflammatory factors including TNF-α in blood can be useful in the prediction of the occurrence of NEC. Another study revealed that TNF-α blockade with infliximab could efficiently reduce the severe intestinal damage in newborn NEC model rats [Citation32]. Of note, there are increasing evidences indicating the regulation of autophagy by TNF-α. For instance, TNF-α differentially regulated levels of autophagy marker LC3B in human placenta over gestation [Citation33]. TNF-α exposure decreased cell viability, increased apoptosis and positively regulated autophagy in the chondrogenic ADTC5 cells [Citation34]. The aforementioned studies indicated the importance of TNF-α and autophagy in NEC. Our results indicated that TNF-α suppressed proliferation and promoted apoptosis in the LPS-stimulated IEC-6/NEC cells, at least in part, via autophagy induction.
It was widely accepted that ERK regulate autophagy in response to various stimuli [Citation35]. Depending on the stimuli and cell type, ERK activity will mediate different anti-proliferative events, such as apoptosis, autophagy and senescence in vitro and in vivo [Citation36]. For example, Zhou et al. [Citation37] showed that transforming growth factor-β (TGF-β)-activated kinase 1 (TAK1) mediated excessive autophagy via p38 and ERK in cisplatin-induced acute kidney injury. Yu et al. [Citation22] stated that erythropoietin (Epo) supplementation significantly decreased both autophagy and apoptosis via the Akt/mTOR signaling pathway and the MAPK/ERK pathway respectively. Accordingly, we wondered whether TNF-α induced autophagy in IEC-6/NEC cells via ERK1/2 signaling. We found that inhibition of ERK1/2 pathway using U0126 significantly inhibited TNF-α-induced autophagy. Furthermore, the TNF-α-mediated inhibition of IEC-6 proliferation and promotion of IEC-6 apoptosis was abolished by U0126. Taken together, we concluded that TNF-α induced autophagy via ERK1/2 signaling, thereby suppressing proliferation and promoting apoptosis in IEC-6/NEC cells.
In summary, our findings supported the notion that TNF-α may induce autophagy through ERK1/2 pathway to regulate apoptosis in neonatal NEC cells IEC-6. Our study enhances our understanding of neonatal NEC pathogenesis.
Acknowledgments
This study was supported by grants from The First Affiliated Hospital of Zhengzhou University.
Disclosure statement
No potential conflict of interest was reported by the authors.
Related Research Data
References
- Lin HC, Wu SF, Underwood M. Necrotizing enterocolitis. N Engl J Med. 2011;364: 1878–1879. author reply 9.
- Hall NJ, Eaton S, Pierro A. Royal Australasia of surgeons guest lecture. Necrotizing enterocolitis: prevention, treatment, and outcome. J Pediatr Surg. 2013;48:2359–2367.
- Hull MA, Fisher JG, Gutierrez IM, et al. Mortality and management of surgical necrotizing enterocolitis in very low birth weight neonates: a prospective cohort study. J Am Coll Surg. 2014;218:1148–1155.
- Neal M, Sodhi C, Dyer M, et al. A critical role for TLR4 induction of autophagy in the regulation of enterocyte migration and the pathogenesis of necrotizing enterocolitis. J Immunol. 2013;190:3541–3551.
- Martin C, Patel M, Melendez-Ferro M, et al. Erythropoietin-induced cytoprotection in intestinal epithelial cells is linked to system Xc. Exp Cell Res. 2017;352:202–206.
- Martin CR, Walker WA. Probiotics: role in pathophysiology and prevention in necrotizing enterocolitis. Semin Perinatol. 2008;32:127–137.
- Cetinkaya M, Cansev M, Cekmez F, et al. CDP-choline reduces severity of intestinal injury in a neonatal rat model of necrotizing enterocolitis. J Surg Res. 2013;183:119–128.
- Good M, Sodhi C, Egan C, et al. Breast milk protects against the development of necrotizing enterocolitis through inhibition of Toll-like receptor 4 in the intestinal epithelium via activation of the epidermal growth factor receptor. Mucosal Immunol. 2015;8:1166–1179.
- McElroy SJ, Prince LS, Weitkamp J-H, et al. Tumor necrosis factor receptor 1-dependent depletion of mucus in immature small intestine: a potential role in neonatal necrotizing enterocolitis. Am J Physiol Gastrointest Liver Physiol. 2011;301:G656–G66.
- Travadi J, Patole S, Charles A, et al. Pentoxifylline reduces the incidence and severity of necrotizing enterocolitis in a neonatal rat model. Pediatr Res. 2006;60:185–189.
- Wang W, Xue L, Ma T, et al. Non-intervention observation: dynamic evolution laws of inflammatory response in necrotizing enterocolitis. Exp Ther Med. 2016;12:1770–1774.
- Caplan MS, Sun XM, Hseuh W, et al. Role of platelet activating factor and tumor necrosis factor-alpha in neonatal necrotizing enterocolitis. J Pediatr. 1990;116:960–964.
- Viscardi RM, Lyon NH, Sun CCJ, et al. Inflammatory Cytokine mRNAs in surgical specimens of necrotizing enterocolitis and normal newborn intestine. Pediatr Pathol. 1997;17:547–559.
- Hui L, Dai Y, Guo Z, et al. Immunoregulation effects of different γδT cells and toll-like receptor signaling pathways in neonatal necrotizing enterocolitis. Medicine (Baltimore). 2017;96:e6077.
- Miyake H, Li B, Lee C, et al. Liver damage, proliferation, and progenitor cell markers in experimental necrotizing enterocolitis. J Pediatr Surg. 2018;53:909–913.
- Zhou Y, Li Y, Zhou B, et al. Inflammation and apoptosis: dual mediator role for toll-like receptor 4 in the development of necrotizing enterocolitis. Inflamm Bowel Dis. 2017;23:44–56.
- Sodhi C, Shi X, Richardson W, et al. Toll-like receptor-4 inhibits enterocyte proliferation via impaired beta-catenin signaling in necrotizing enterocolitis. Gastroenterology. 2010;138:185–196.
- Zuckerbraun B, Otterbein L, Boyle P, et al. Carbon monoxide protects against the development of experimental necrotizing enterocolitis. Am J Physiol Gastrointest Liver Physiol. 2005;289:G607–613.
- Levine B, Kroemer G. Autophagy in the pathogenesis of disease. Cell. 2008;132:27.
- Mizushima N, Levine B, Cuervo AM, et al. Autophagy fights disease through cellular self-digestion. Nature. 2008;451:1069.
- Maynard A, Dvorak K, Khailova L, et al. Epidermal growth factor reduces autophagy in intestinal epithelium and in the rat model of necrotizing enterocolitis. Am J Physiol Gastrointest Liver Physiol. 2010;299:G614–622.
- Yu Y, Shiou S, Guo Y, et al. Erythropoietin protects epithelial cells from excessive autophagy and apoptosis in experimental neonatal necrotizing enterocolitis. PLoS ONE. 2013;8:e69620.
- Dash S, Sarashetti P, Rajashekar B, et al. TGF-β2-induced EMT is dampened by inhibition of autophagy and TNF-α treatment. Oncotarget. 2018;9:6433–6449.
- Quintanilla HD, Liu Y, Fatheree NY, et al. Oral administration of surfactant protein-a reduces pathology in an experimental model of necrotizing enterocolitis. J Pediatr Gastroenterol Nutr. 2015;60:613–620.
- Zhang H, Gong Y, Wang Z, et al. Apelin inhibits the proliferation and migration of rat PASMCs via the activation of PI3K/Akt/mTOR signal and the inhibition of autophagy under hypoxia. J Cell Mol Med. 2014;18:542–553.
- Biederbick A, Kern HF, Elsasser HP. Monodansylcadaverine (MDC) is a specific in vivo marker for autophagic vacuoles. Eur J Cell Biol. 1995;66:3–14.
- Zhang BC, Zhang CW, Wang C, et al. Luteolin attenuates foam cell formation and apoptosis in Ox-LDL-Stimulated macrophages by enhancing autophagy. Cell Physiol Biochem. 2016;39:2065–2076.
- Liu H, Garzoni L, Herry C, et al. Can monitoring fetal intestinal inflammation using heart rate variability analysis signal incipient necrotizing enterocolitis of the neonate? Pediatr Crit Care Med. 2016;17:e165–176.
- Thomas D, Bell B, Papillon S, et al. Colonization with Escherichia coli EC 25 protects neonatal rats from necrotizing enterocolitis. PLoS ONE. 2017;12:e0188211.
- McElroy S, Hobbs S, Kallen M, et al. Transactivation of EGFR by LPS induces COX-2 expression in enterocytes. PLoS ONE. 2012;7:e38373.
- Coursodon C, Dvorak B. Epidermal growth factor and necrotizing enterocolitis. Curr Opin Pediatr. 2012;24:160–164.
- Tayman C, Aydemir S, Yakut I, et al. TNF-α blockade efficiently reduced severe intestinal damage in necrotizing enterocolitis. J Invest Surg. 2016;29:209–217.
- Prokesch A, Blaschitz A, Bauer T, et al. Placental DAPK1 and autophagy marker LC3B-II are dysregulated by TNF-α in a gestational age-dependent manner. Histochem Cell Biol. 2017;147:695–705.
- Chen Z, Jin T, Lu Y. AntimiR-30b inhibits TNF-α mediated apoptosis and attenuated cartilage degradation through enhancing autophagy. Cell Physiol Biochem. 2016;40:883–894.
- Webber JL. Regulation of autophagy by p38α MAPK. Autophagy. 2010;6:292–293.
- Cagnol S, Chambard JC. ERK and cell death: mechanisms of ERK-induced cell death–apoptosis, autophagy and senescence. FEBS J. 2010;277:2–21.
- Zhou J, Fan Y, Zhong J, et al. TAK1 mediates excessive autophagy via p38 and ERK in cisplatin-induced acute kidney injury. J Cell Mol Med. 2018;22:2908–2921.